Exploration digest for the survey stack behind book/poverty.md (Task 127 / Task 130).
Grouped by topic; within each variable: question → time series → cohort trajectories → cohort component → period component with time-series overlay.
Coding: Policy and egalitarianism items use conservative y=1 (e.g. spend less on welfare / aid to the poor). Descriptive items (satfin, finrela, class, goodlife, parsol, dwelown, VCF0148) are substantive cuts, not left–right.
Full metadata: notebooks/utils.py. Ops: poverty_refresh.md.
Figure stems (Task 95 nested): figs/{gss|anes}/{var}/time_model.png, model10_cohort_trajectories.png, model10_cohort_standardized.png, model10_period_standardized[_time_series].png.
Layout template (Task 130 / 148): topic H2 → per-variable H3 with question + four figures. Regenerate with
python scripts/gen_chapter_results_md.py poverty.
Welfare spending & affect
natfare — Welfare spending?
Selected (y=1): [3] — Percent saying too much
Question
Tell me whether you think we’re spending too much money on welfare, too little money, or about the right amount.
Time series
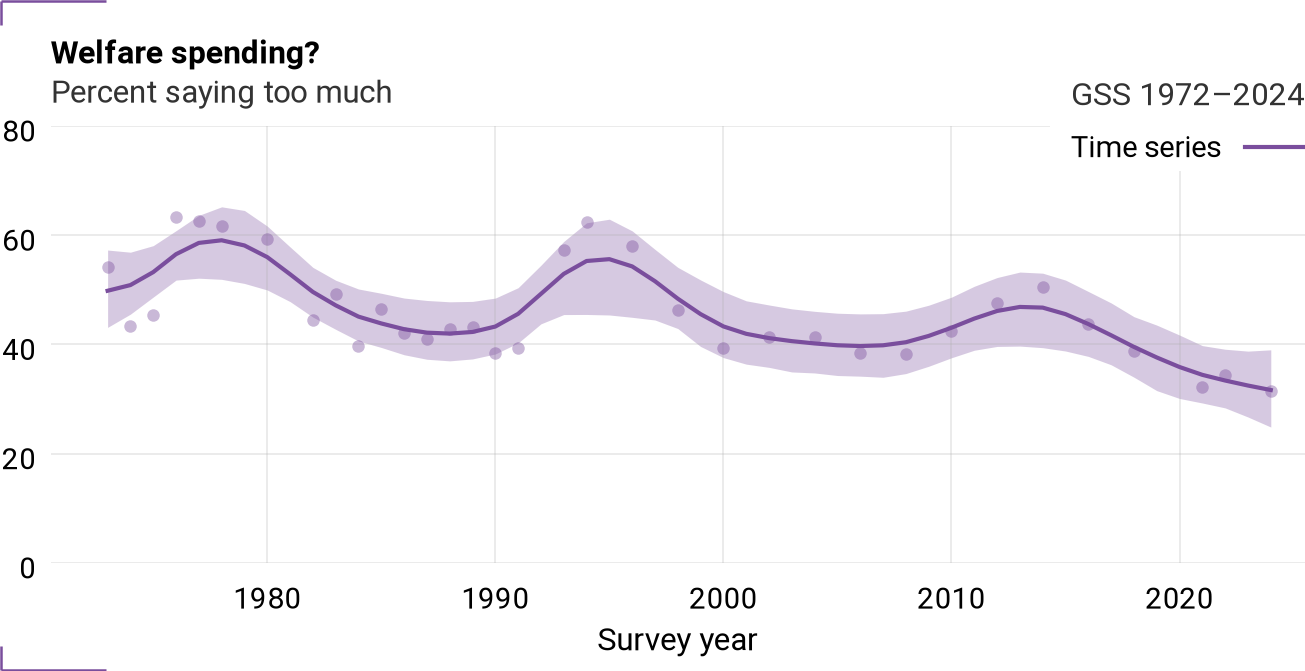
Figure 1:Time series for natfare
Cohort trajectories
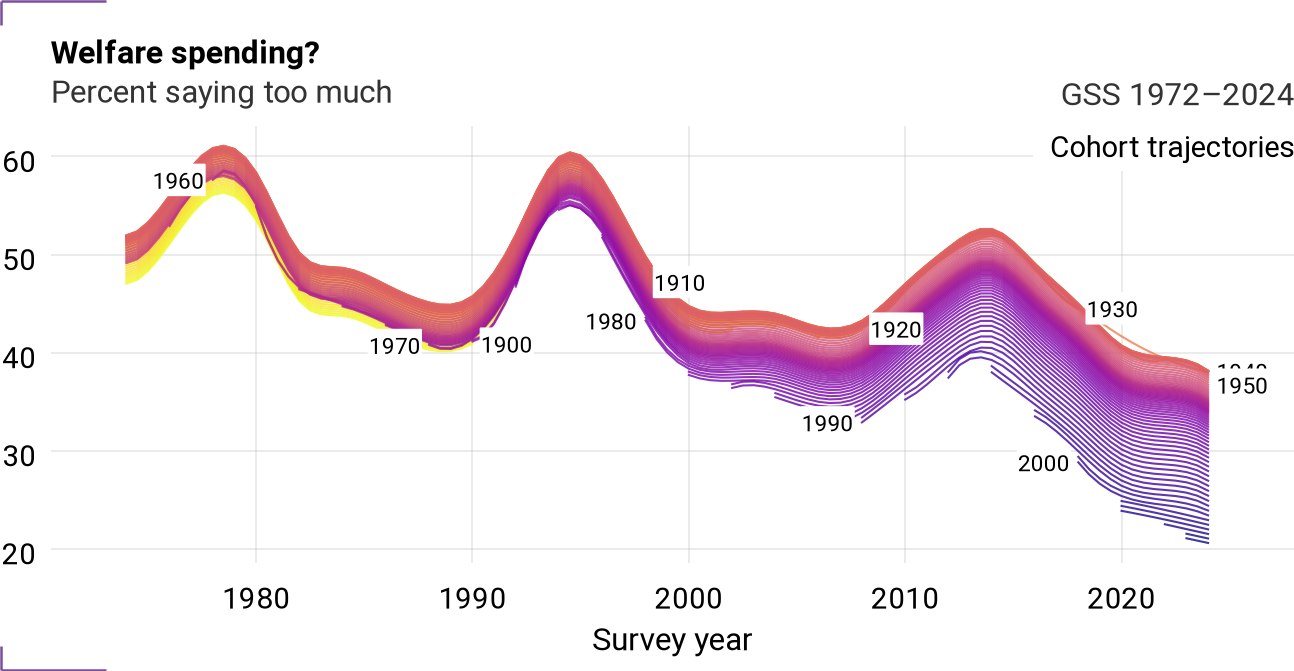
Figure 2:Cohort trajectories for natfare
Cohort component
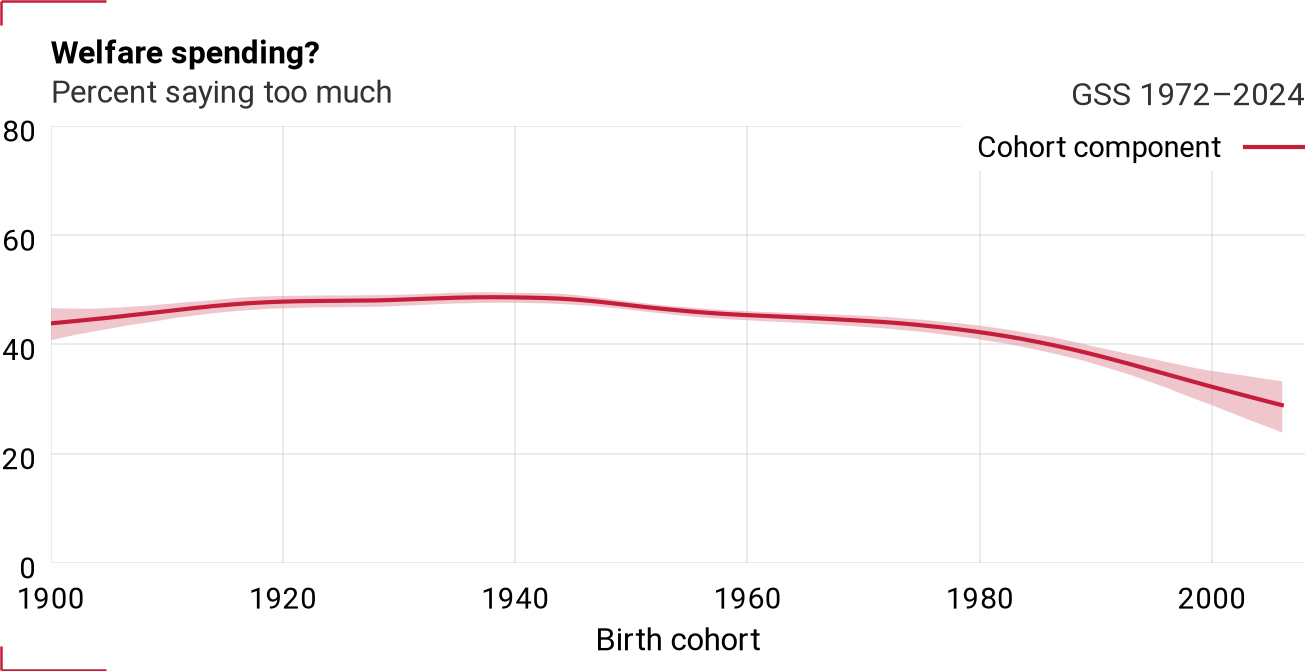
Figure 3:Cohort component for natfare
Period component (with time series)
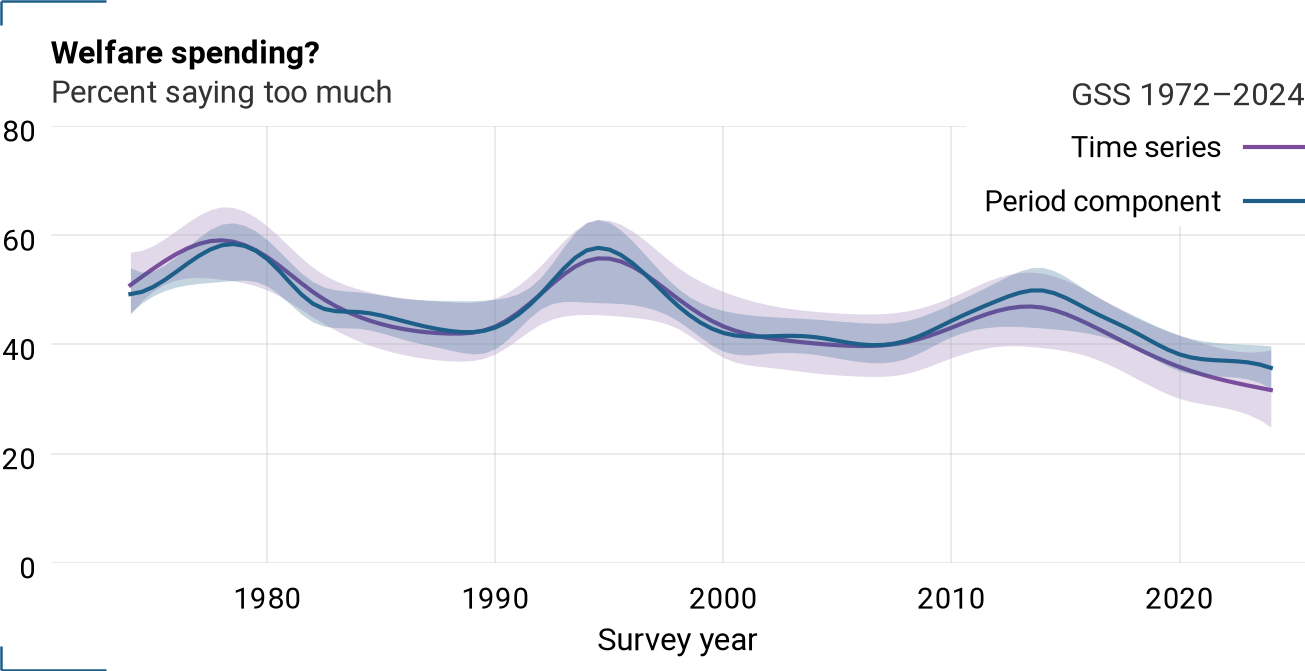
Figure 4:Period component and time series for natfare
natfarey — Assistance to the poor?
Selected (y=1): [3] — Percent saying too much
Question
Tell me whether you think we’re spending too much money on assistance to the poor, too little money, or about the right amount.
Time series
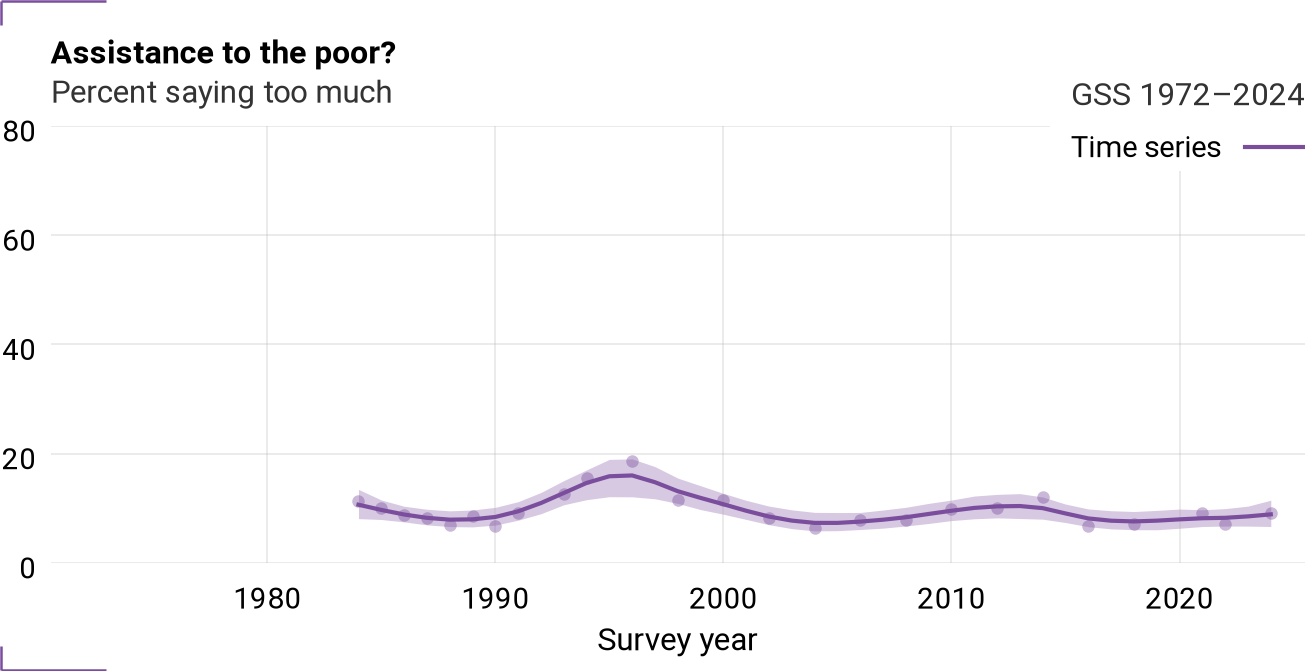
Figure 5:Time series for natfarey
Cohort trajectories
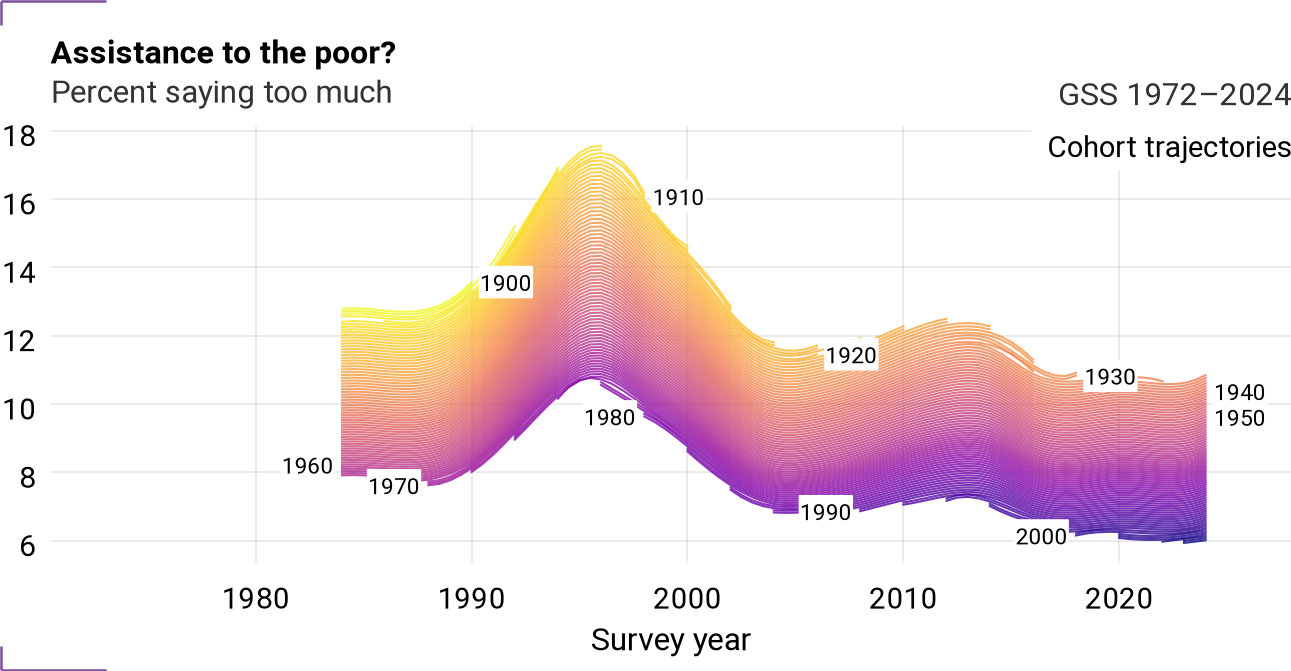
Figure 6:Cohort trajectories for natfarey
Cohort component
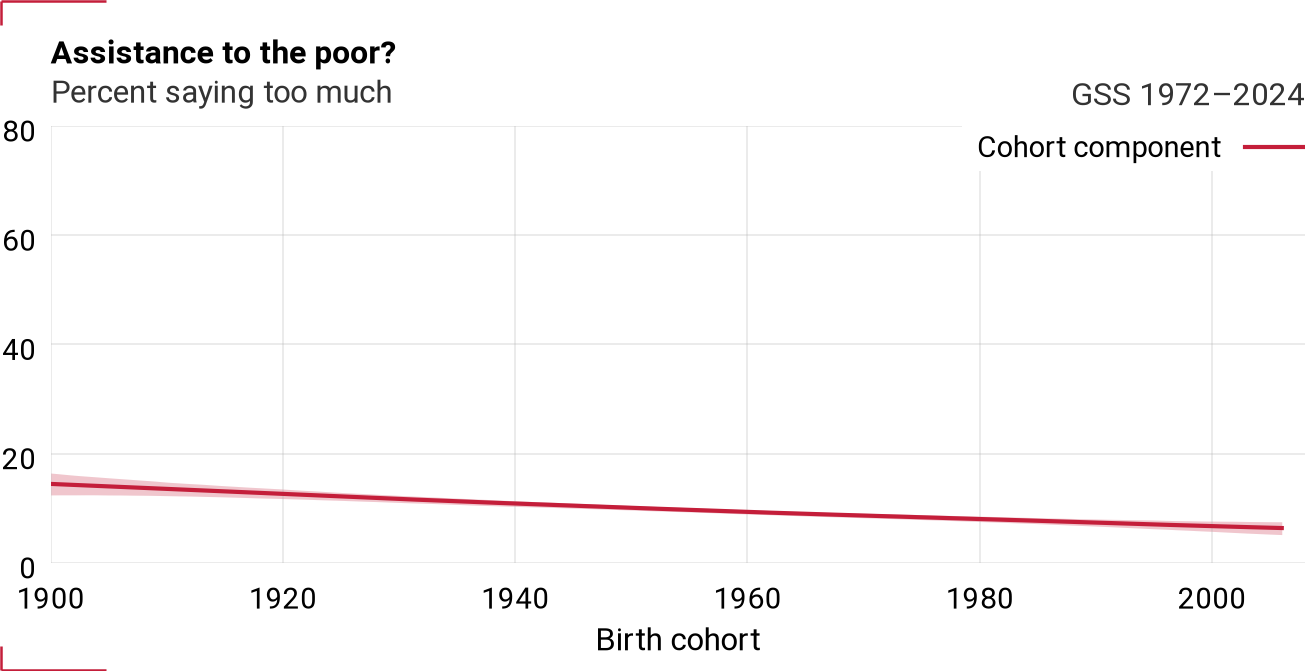
Figure 7:Cohort component for natfarey
Period component (with time series)
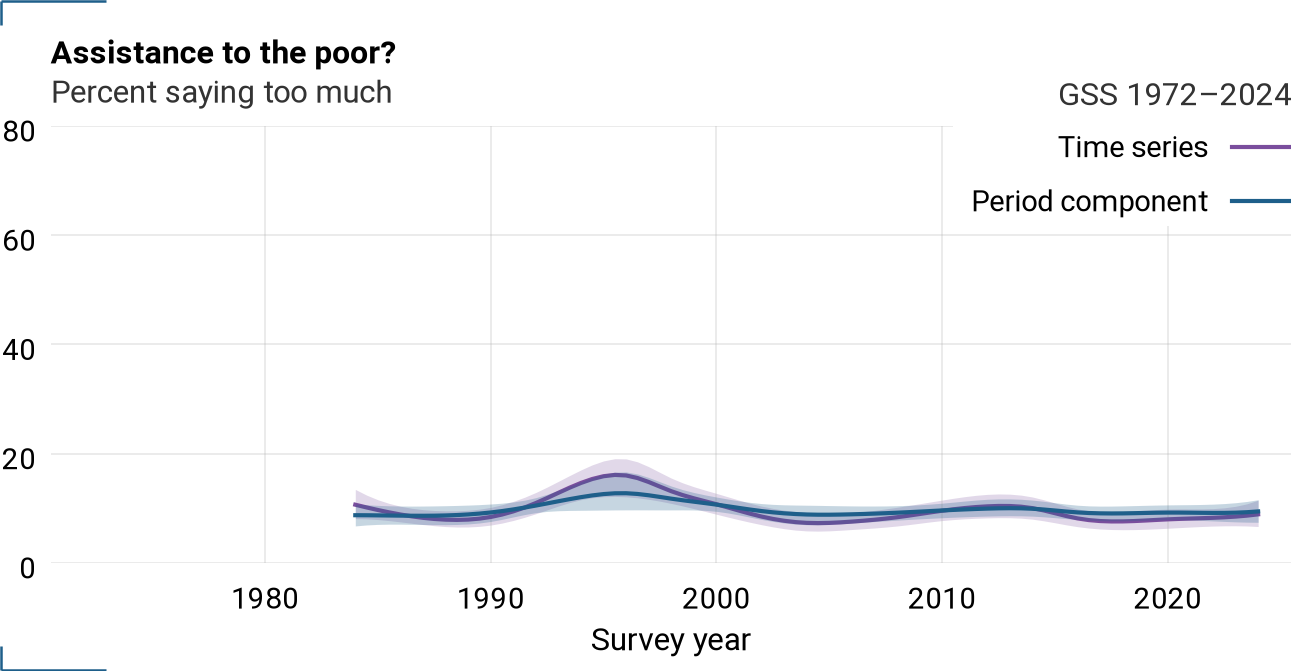
Figure 8:Period component and time series for natfarey
VCF0886 — Federal spending: aid to the poor?
Selected (y=1): [3] — Percent saying decrease aid to the poor
Question
Should federal spending on aid to the poor be increased, decreased, or kept about the same?
Time series
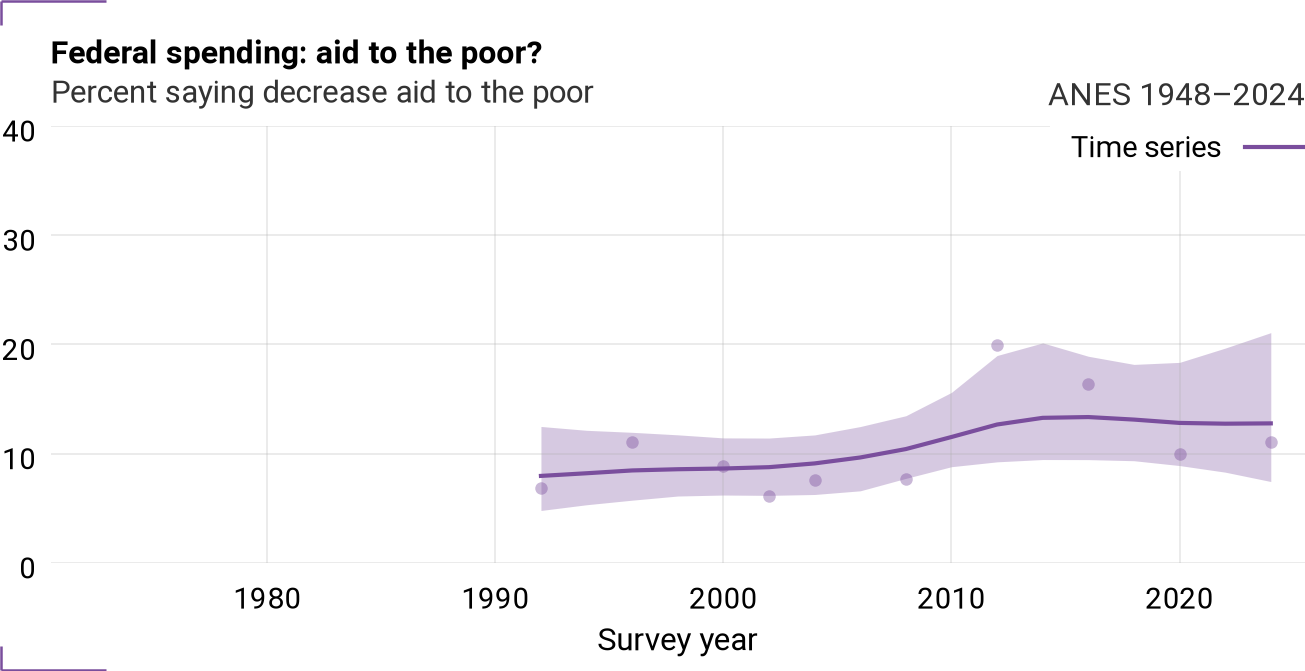
Figure 9:Time series for VCF0886
Cohort trajectories
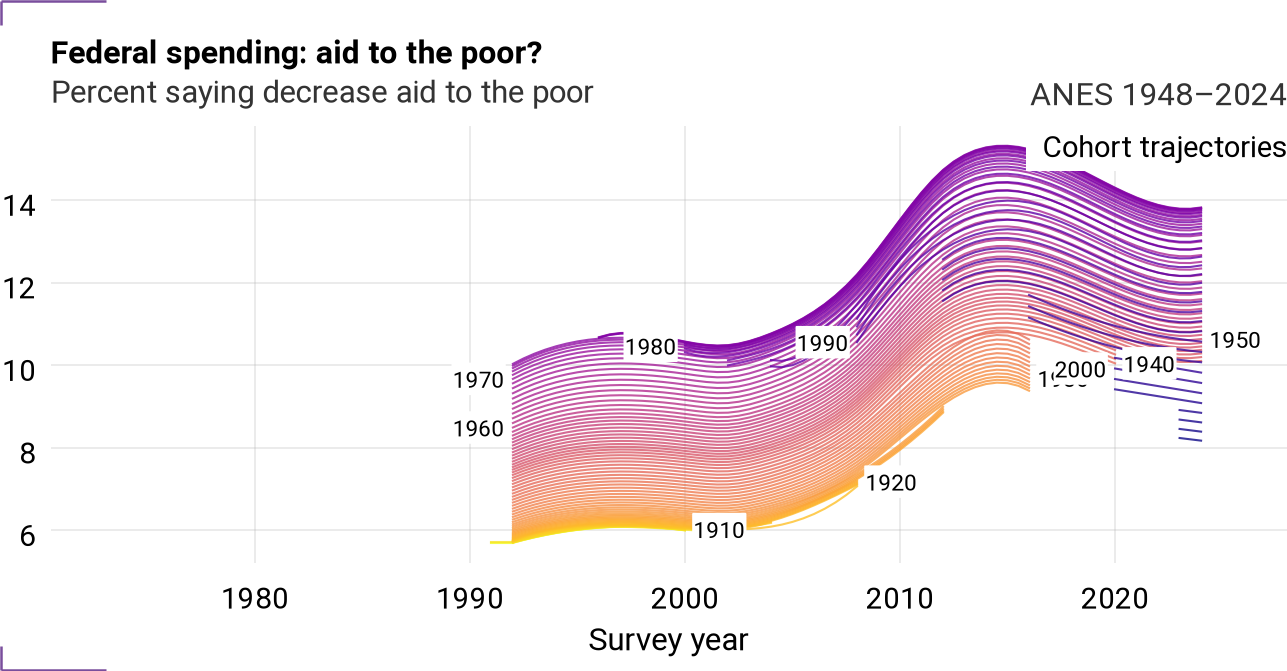
Figure 10:Cohort trajectories for VCF0886
Cohort component
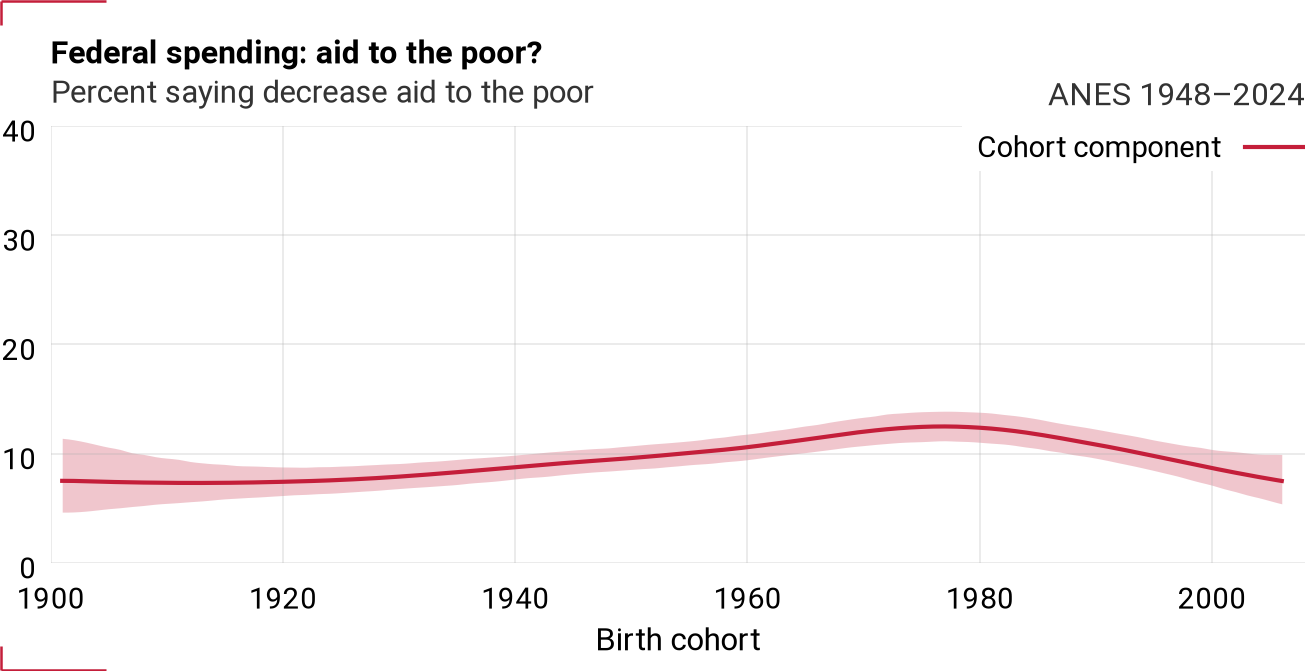
Figure 11:Cohort component for VCF0886
Period component (with time series)
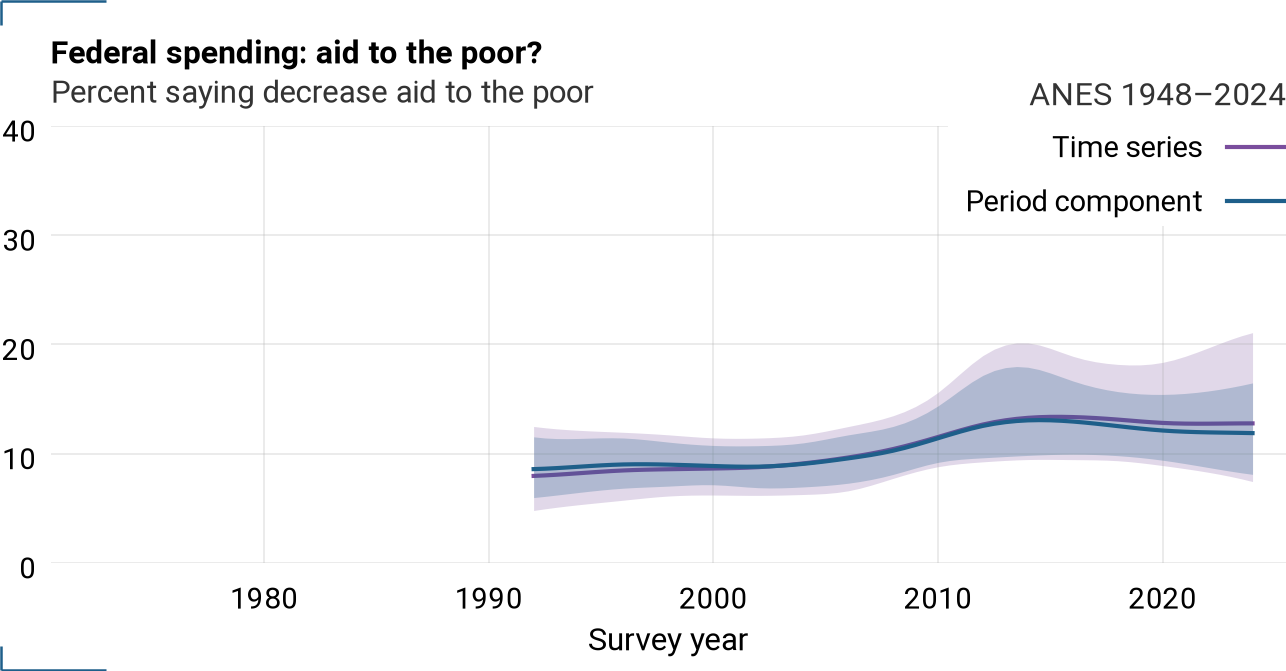
Figure 12:Period component and time series for VCF0886
VCF0220 — Feeling thermometer: people on welfare
Selected (y=1): [0–49] — Percent cold/dislike
Question
Feeling thermometer: people on welfare.
Time series
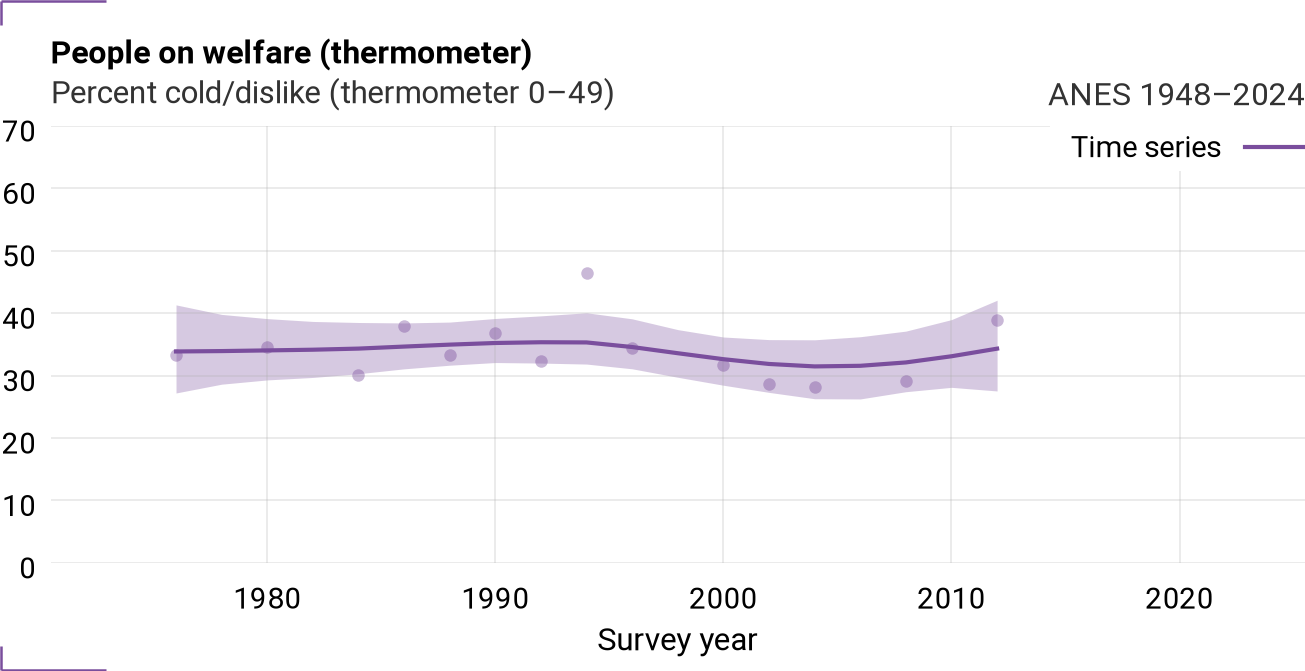
Figure 13:Time series for VCF0220
Cohort trajectories
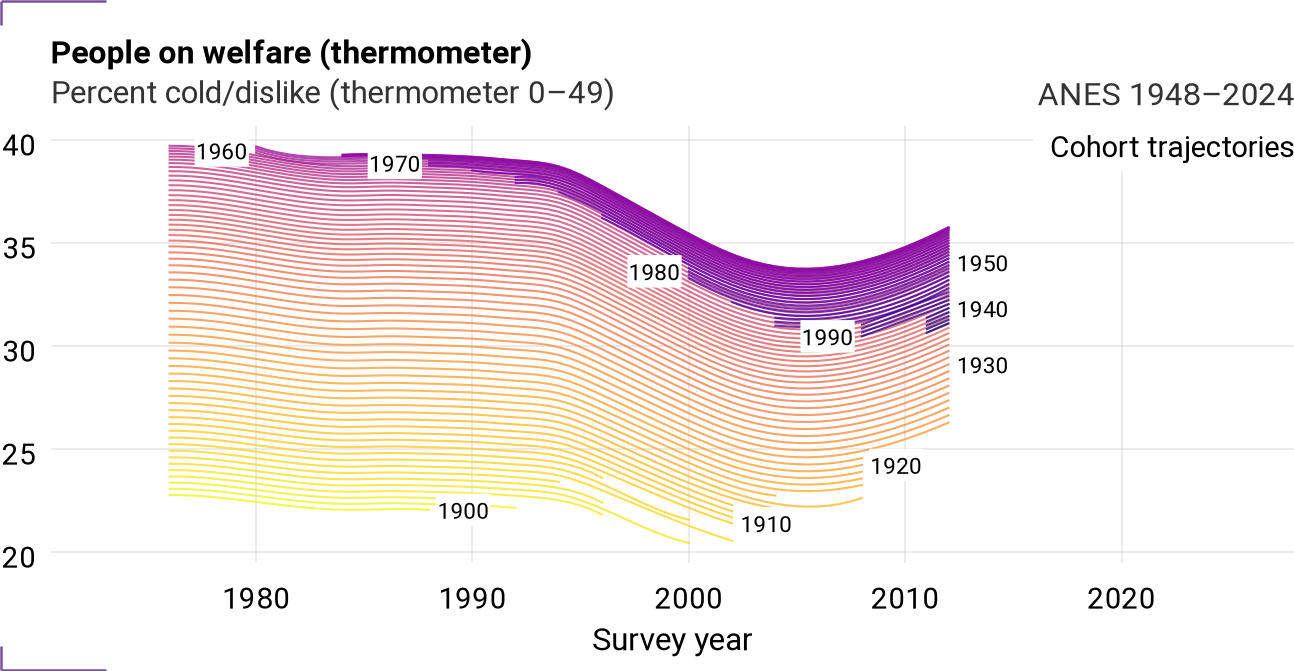
Figure 14:Cohort trajectories for VCF0220
Cohort component
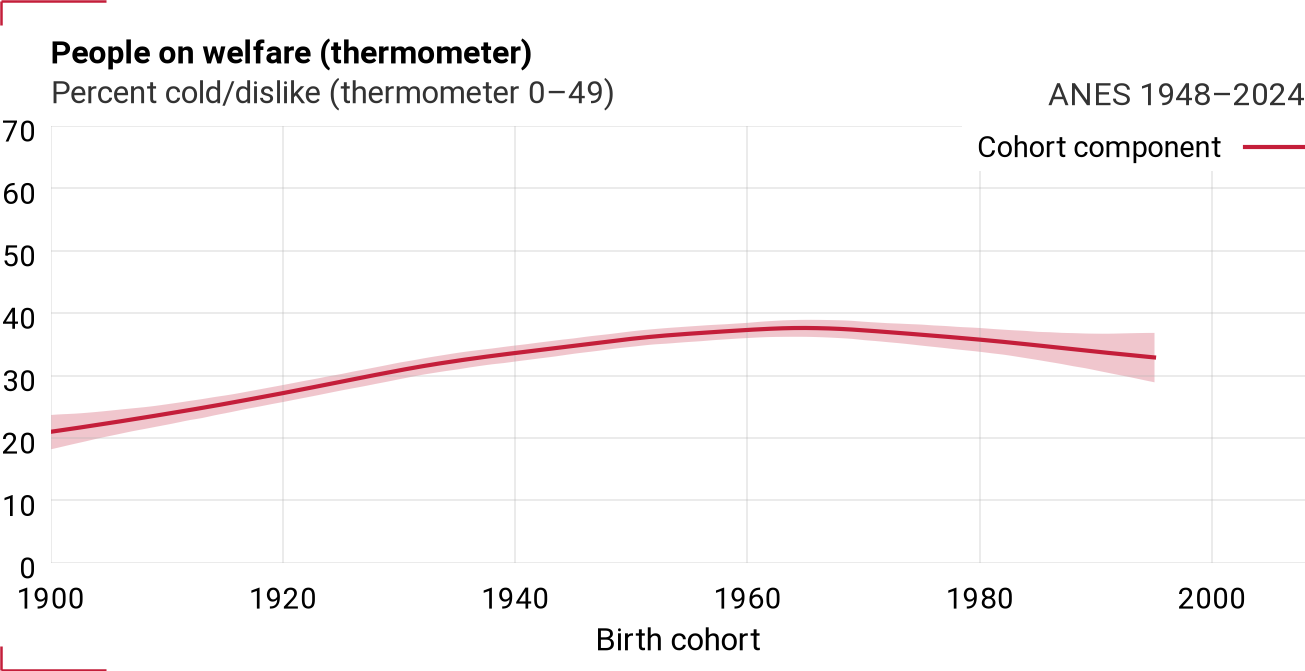
Figure 15:Cohort component for VCF0220
Period component (with time series)
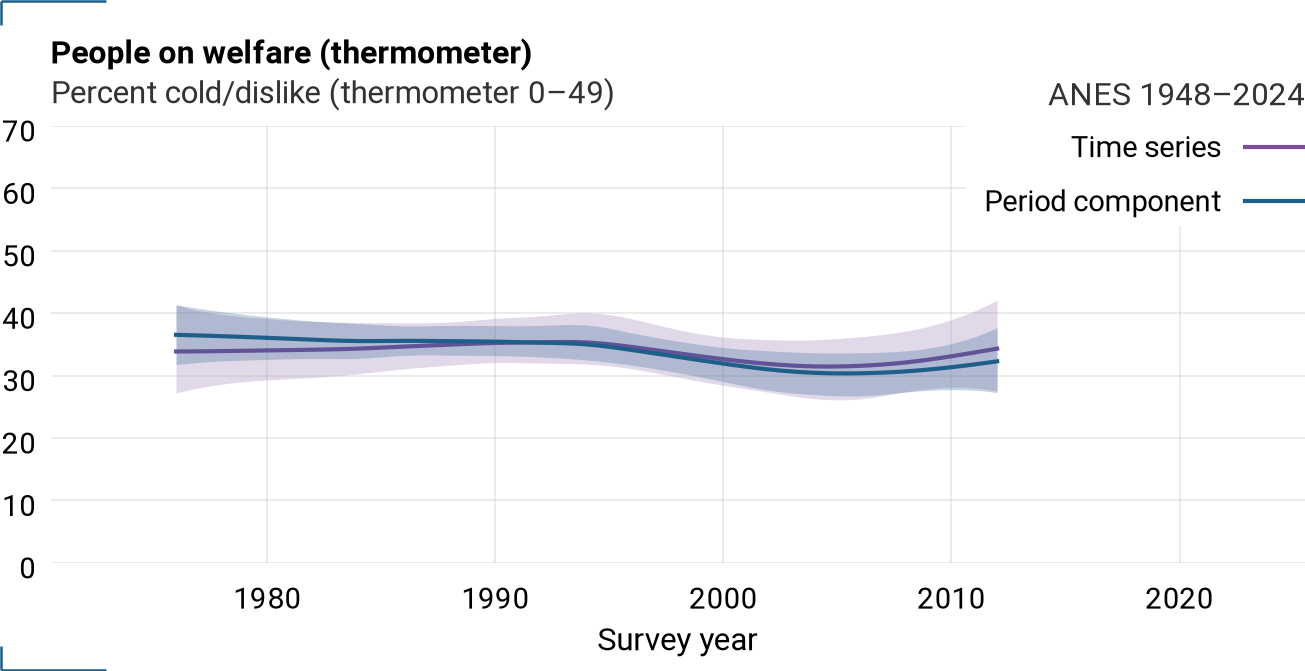
Figure 16:Period component and time series for VCF0220
Inequality & equal opportunity
eqwlth — Should govt reduce income differences?
Selected (y=1): [5, 6, 7] — Percent opposing reducing income differences (5–7)
Question
Some people think that the government in Washington ought to reduce the income differences between the rich and the poor, perhaps by raising the taxes of wealthy families or by giving income assistance to the poor. Others think that the government should not concern itself with reducing this income difference between the rich and the poor. Where would you place yourself on this scale (1 = government should reduce differences, 7 = government should not concern itself)?
Time series
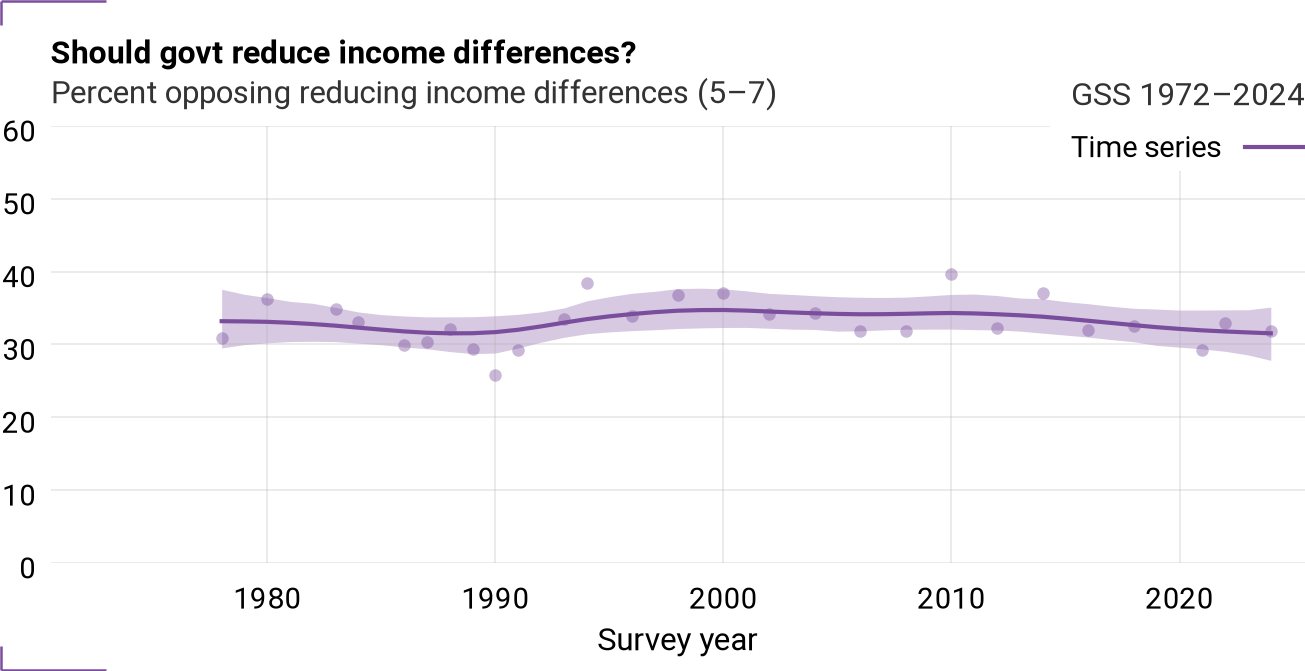
Figure 17:Time series for eqwlth
Cohort trajectories
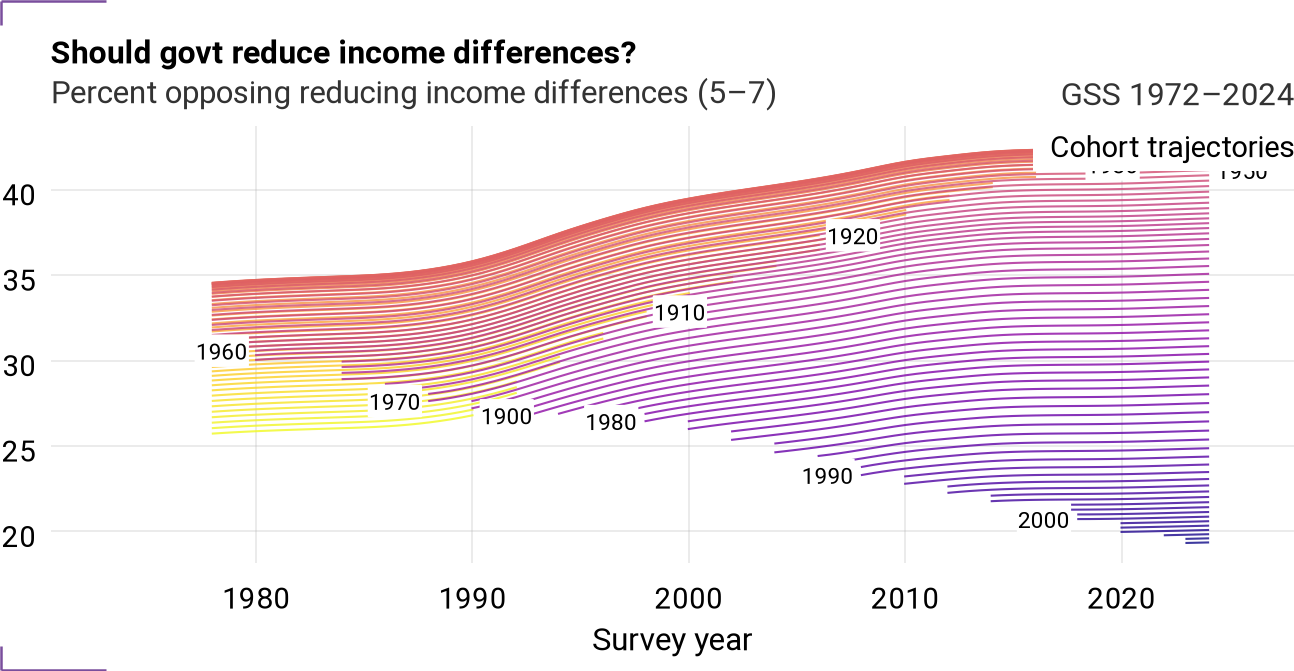
Figure 18:Cohort trajectories for eqwlth
Cohort component
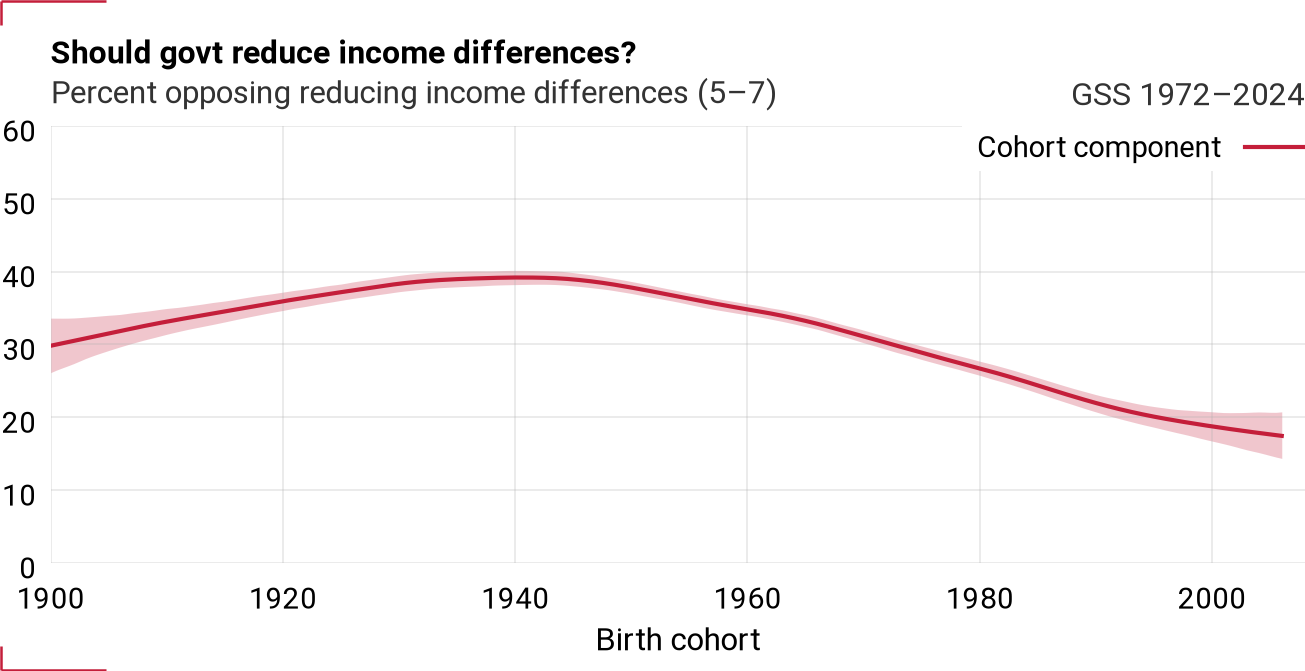
Figure 19:Cohort component for eqwlth
Period component (with time series)
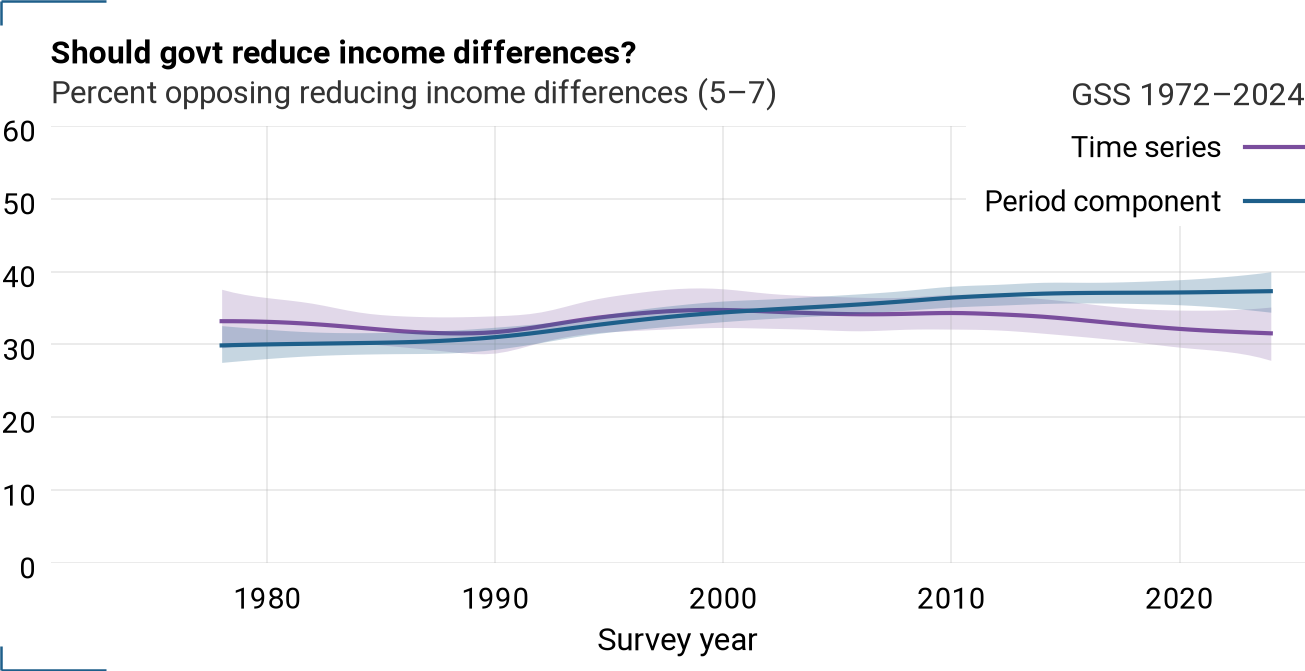
Figure 20:Period component and time series for eqwlth
VCF9013 — Society ensure equal opportunity?
Selected (y=1): [4, 5] — Percent disagreeing society should ensure equal opportunity
Question
Our society should do whatever is necessary to make sure that everyone has an equal opportunity to succeed. (Agree strongly … disagree strongly.)
Time series
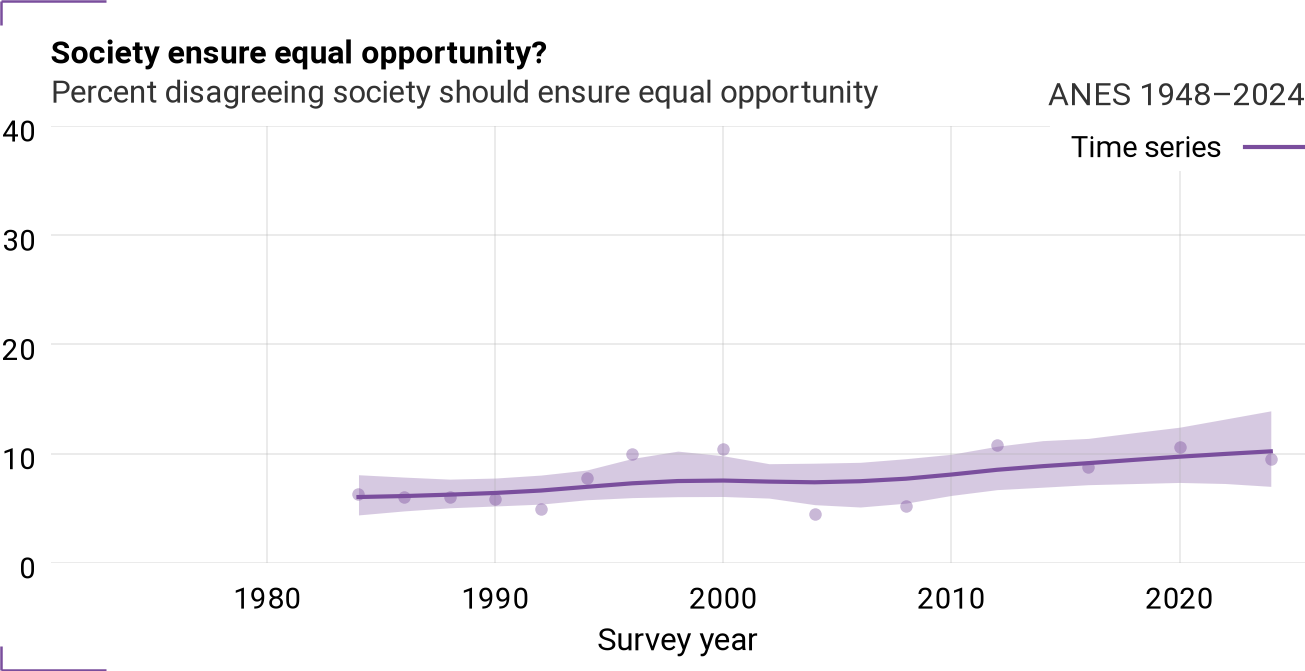
Figure 21:Time series for VCF9013
Cohort trajectories
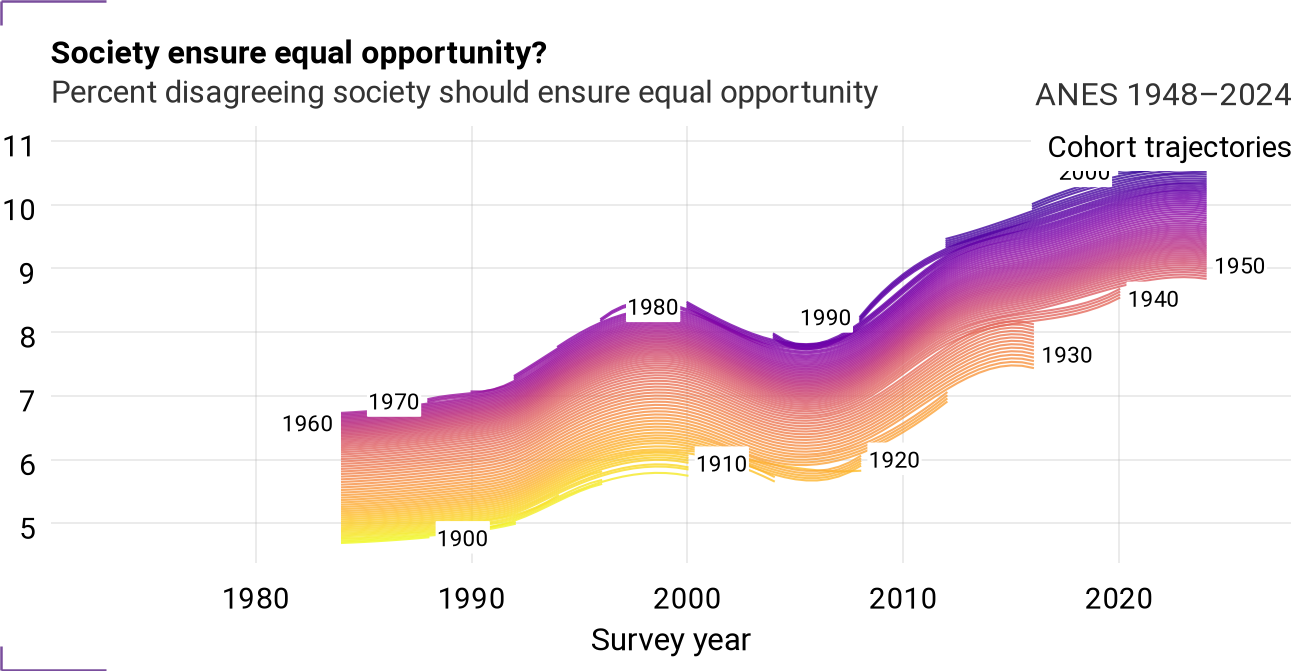
Figure 22:Cohort trajectories for VCF9013
Cohort component
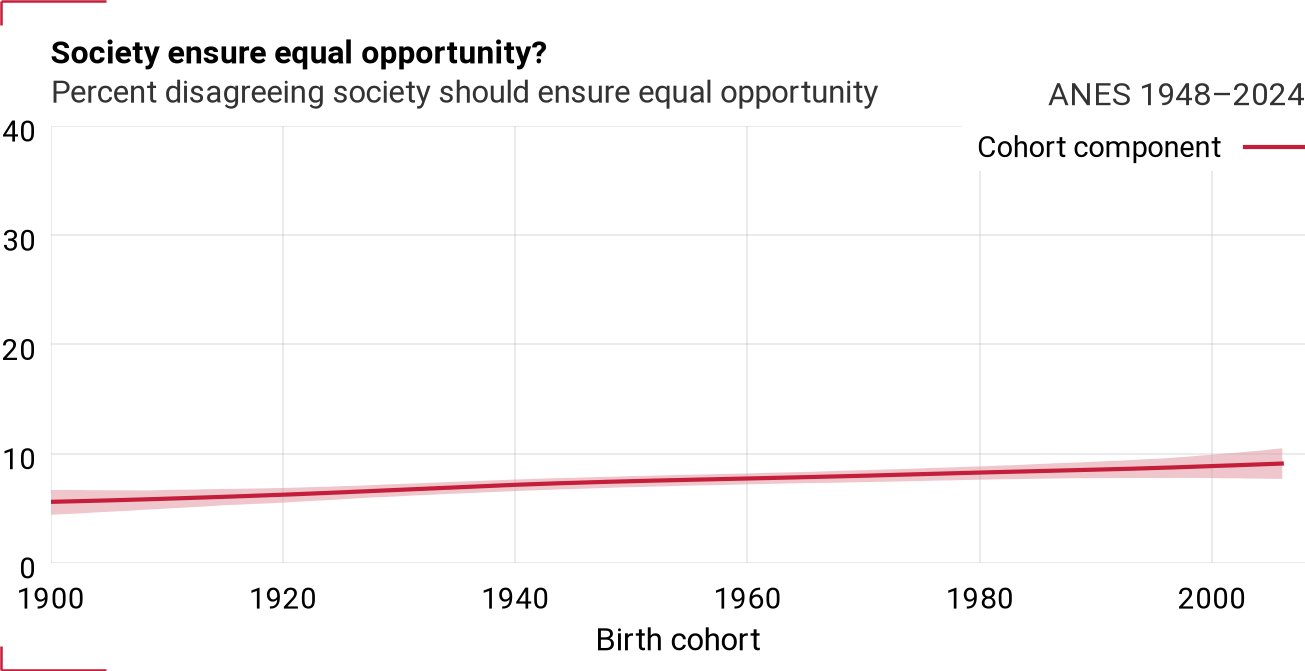
Figure 23:Cohort component for VCF9013
Period component (with time series)
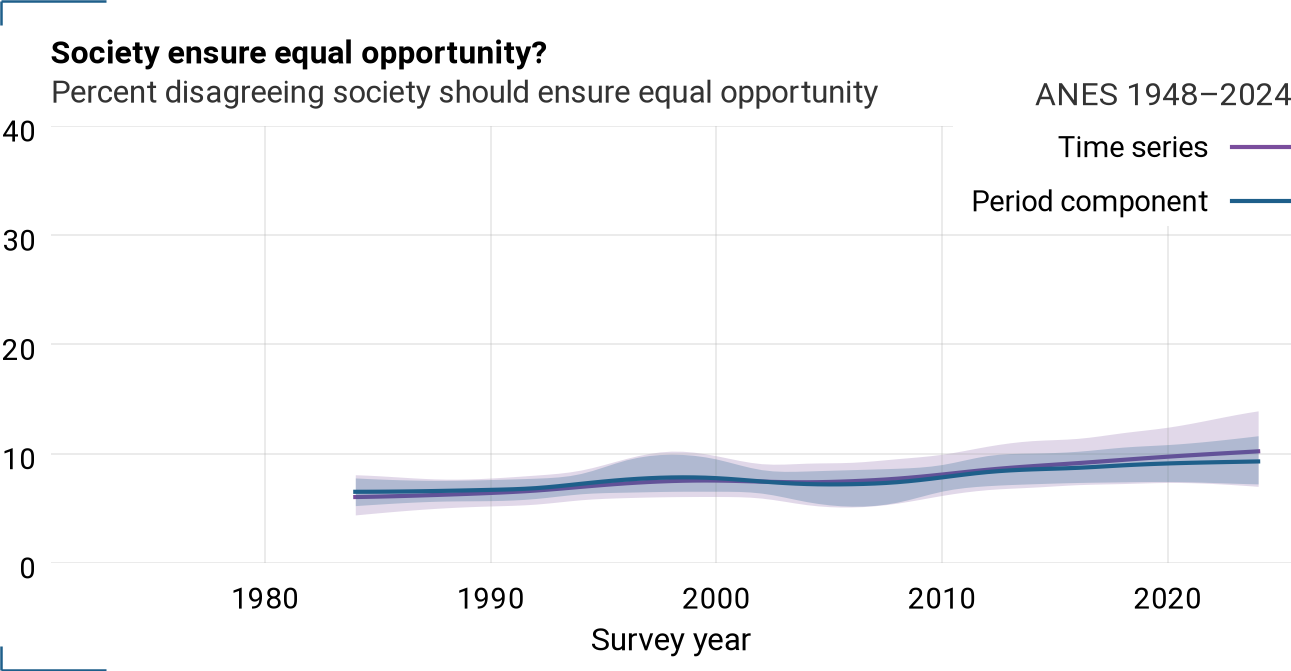
Figure 24:Period component and time series for VCF9013
VCF9015 — Unequal chance a big problem?
Selected (y=1): [4, 5] — Percent disagreeing unequal chance is a big problem
Question
One of the big problems in this country is that we don’t give everyone an equal chance. (Agree strongly … disagree strongly.)
Time series
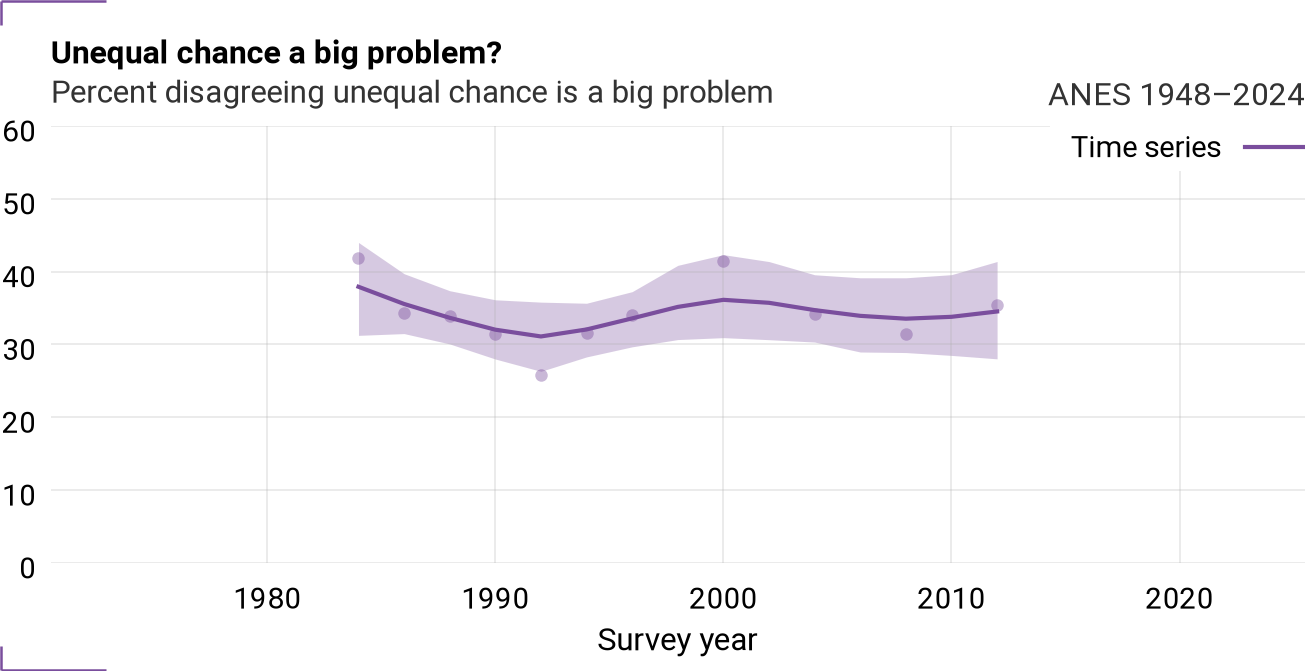
Figure 25:Time series for VCF9015
Cohort trajectories
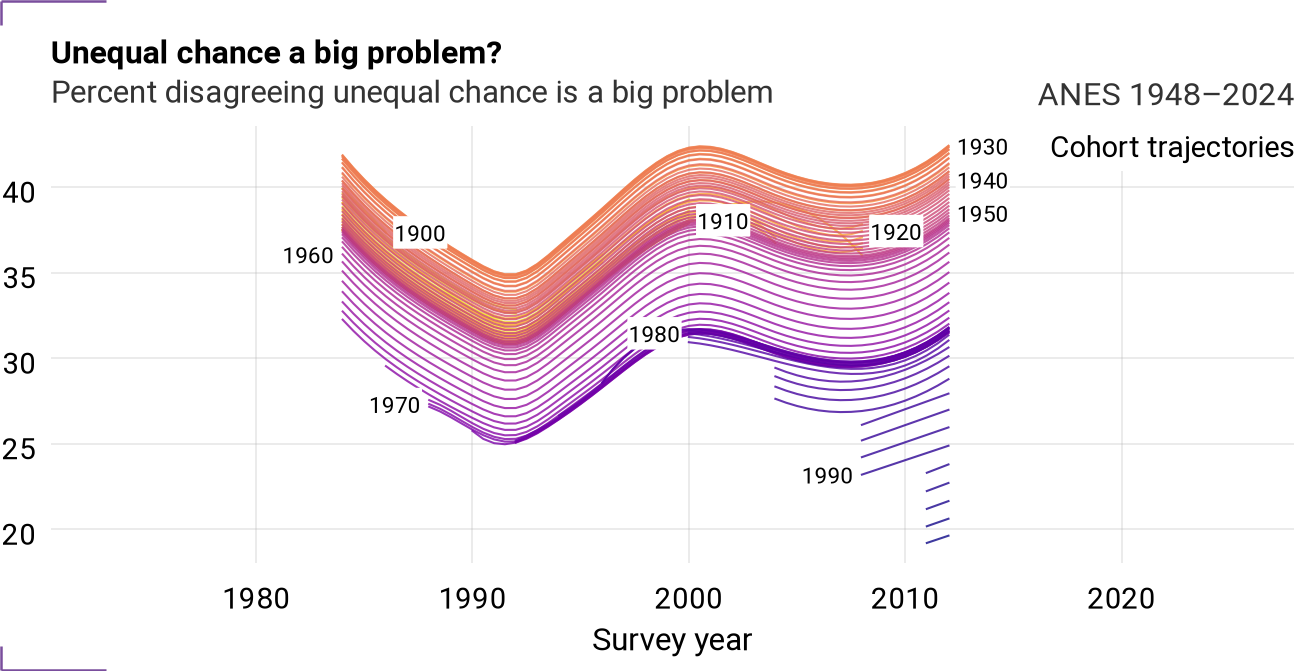
Figure 26:Cohort trajectories for VCF9015
Cohort component
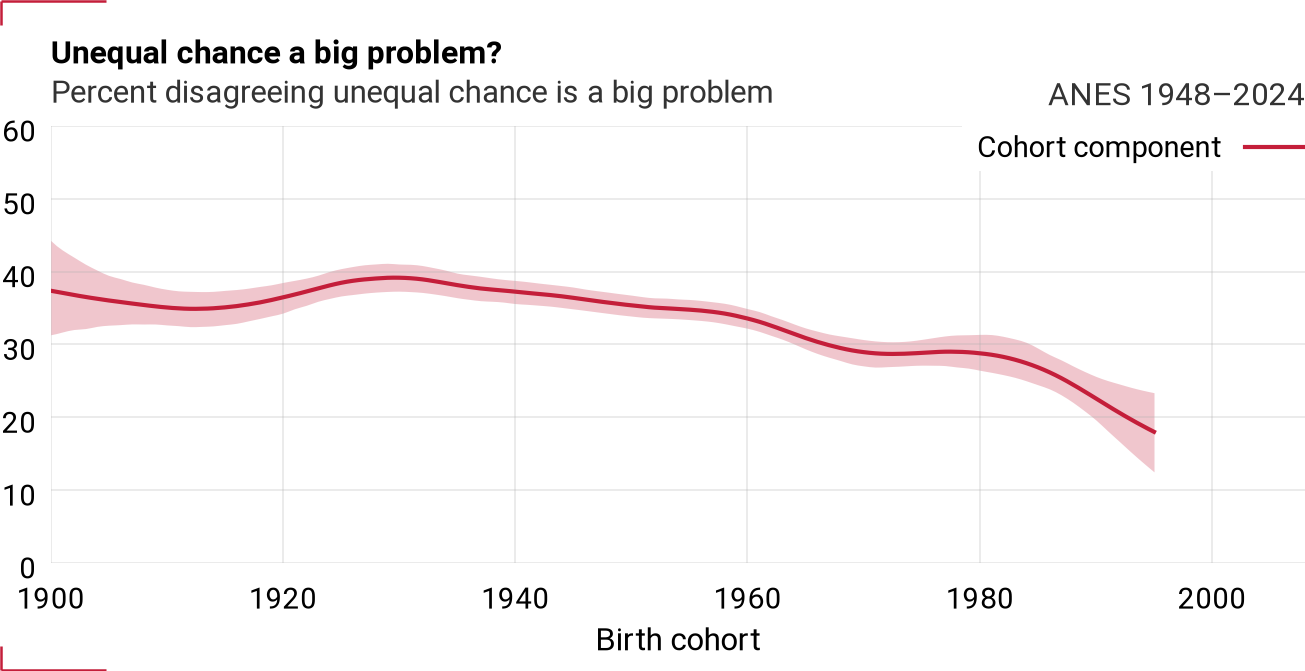
Figure 27:Cohort component for VCF9015
Period component (with time series)
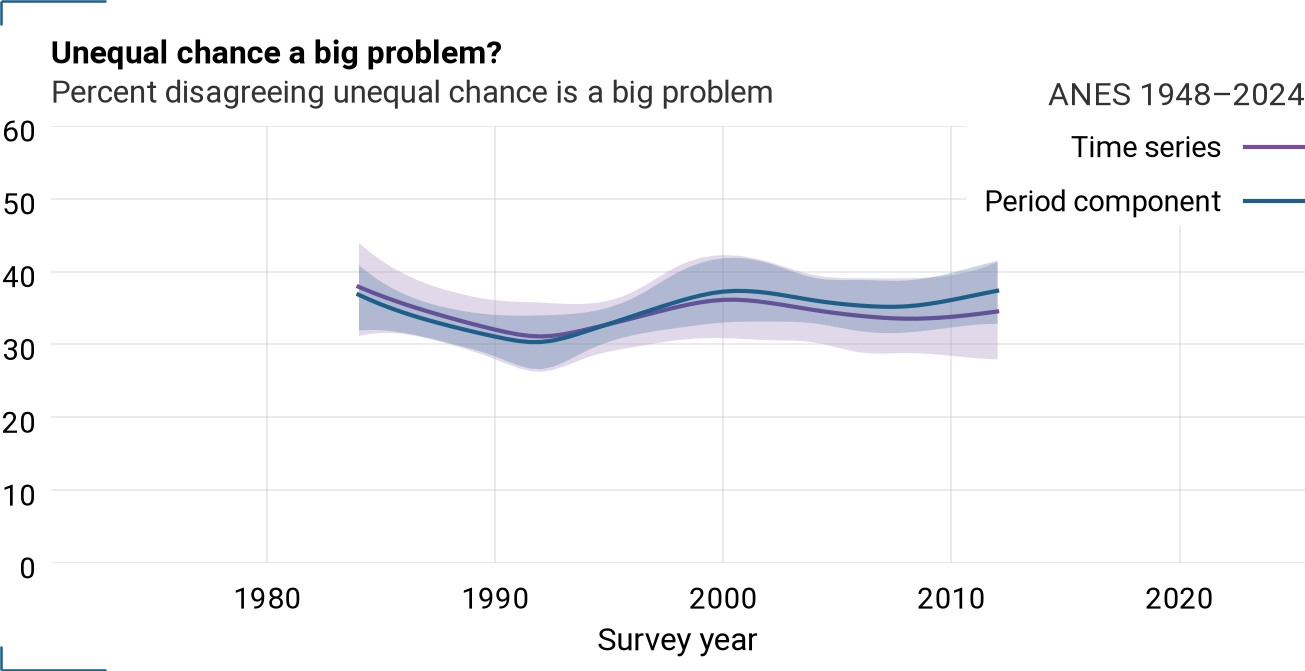
Figure 28:Period component and time series for VCF9015
VCF9016 — OK if some have more chance?
Selected (y=1): [1, 2] — Percent agreeing unequal chance is not a big problem
Question
It is not really that big a problem if some people have more of a chance in life than others. (Agree strongly … disagree strongly.)
Time series
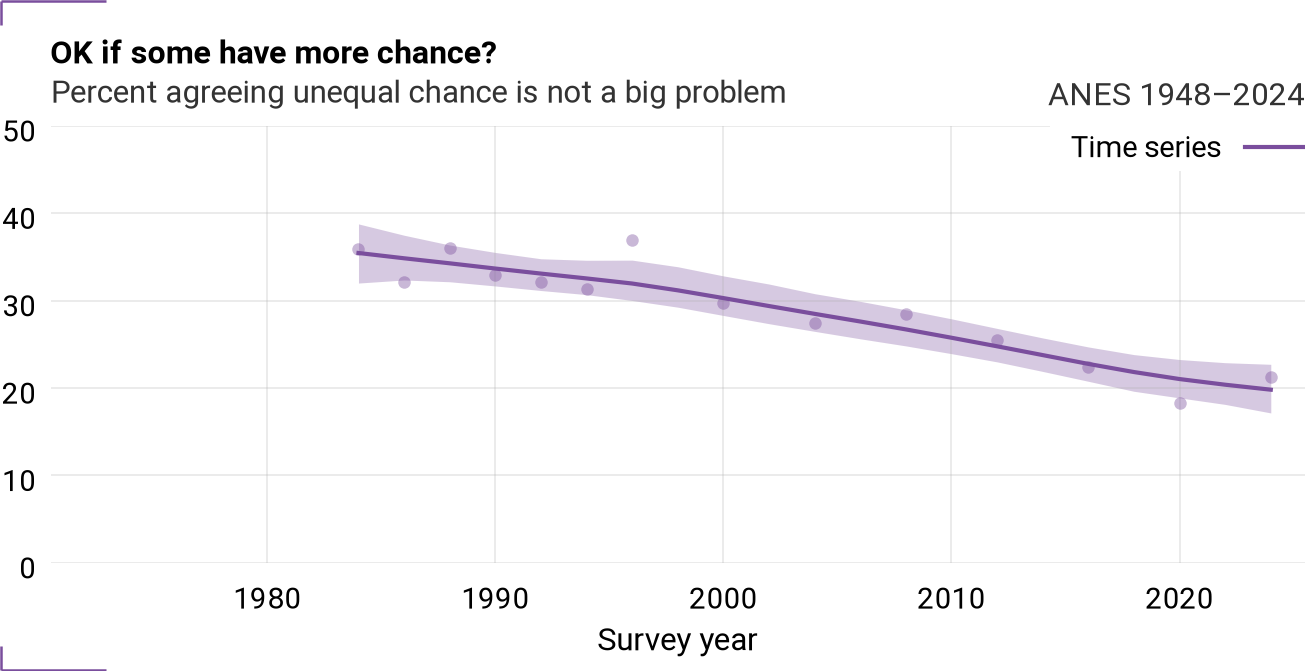
Figure 29:Time series for VCF9016
Cohort trajectories
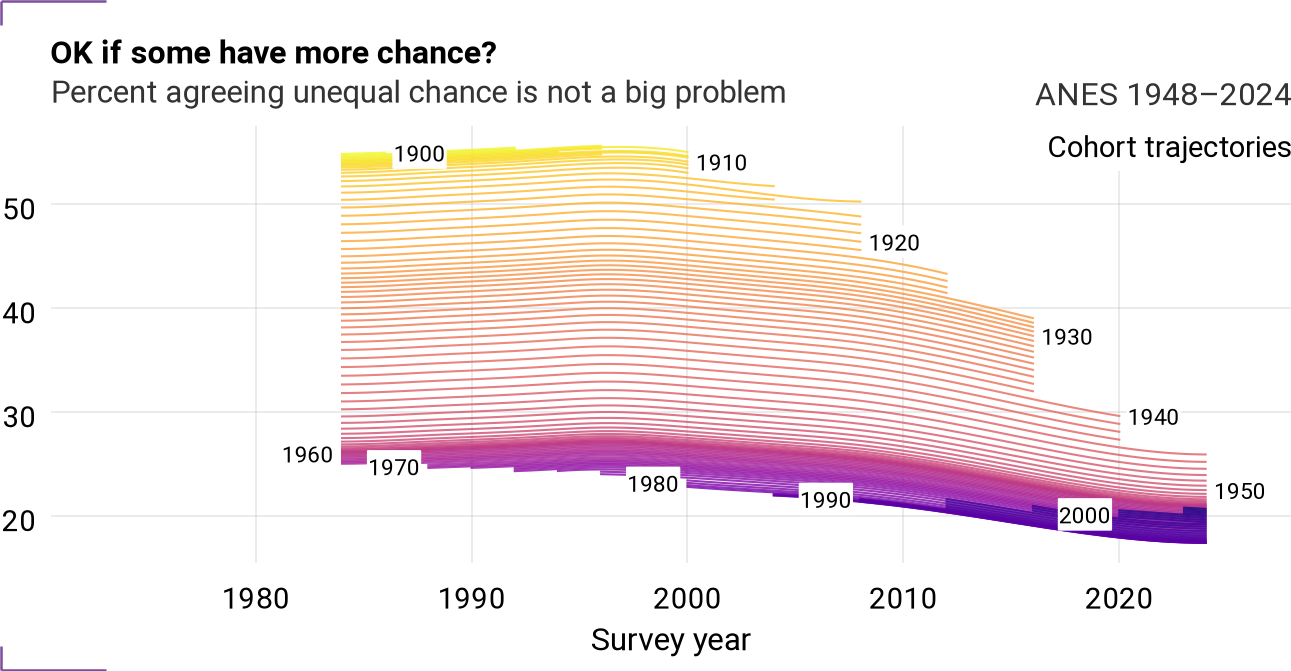
Figure 30:Cohort trajectories for VCF9016
Cohort component
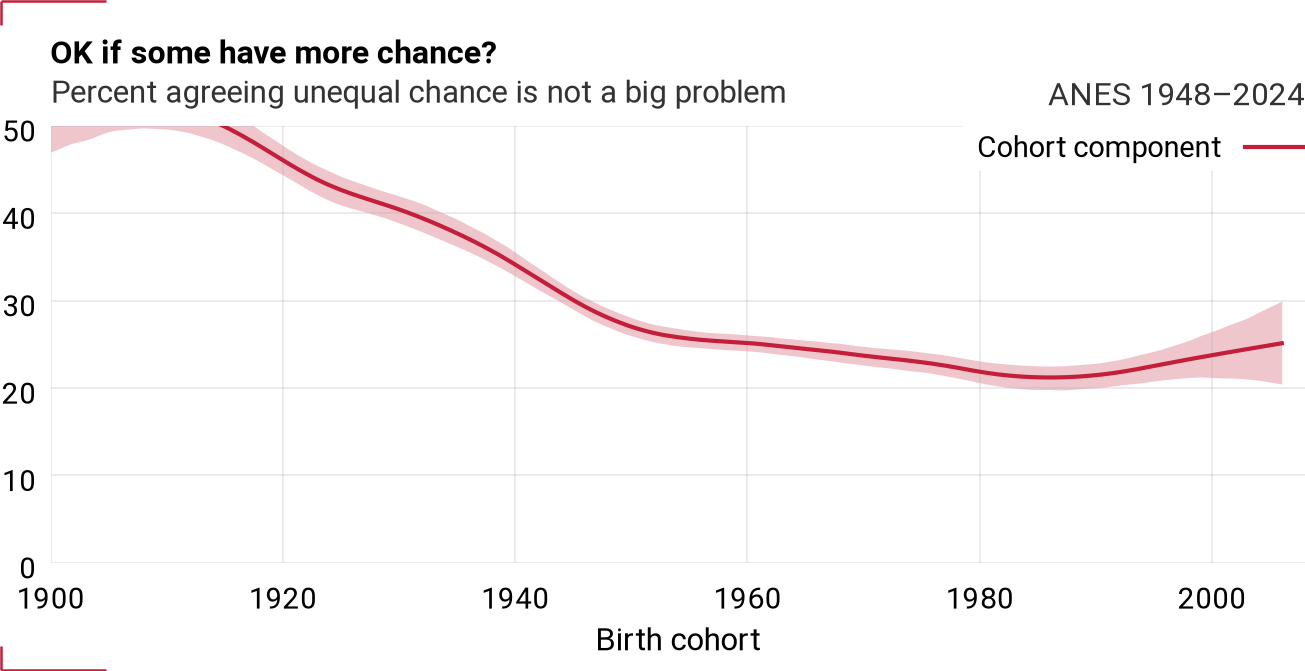
Figure 31:Cohort component for VCF9016
Period component (with time series)
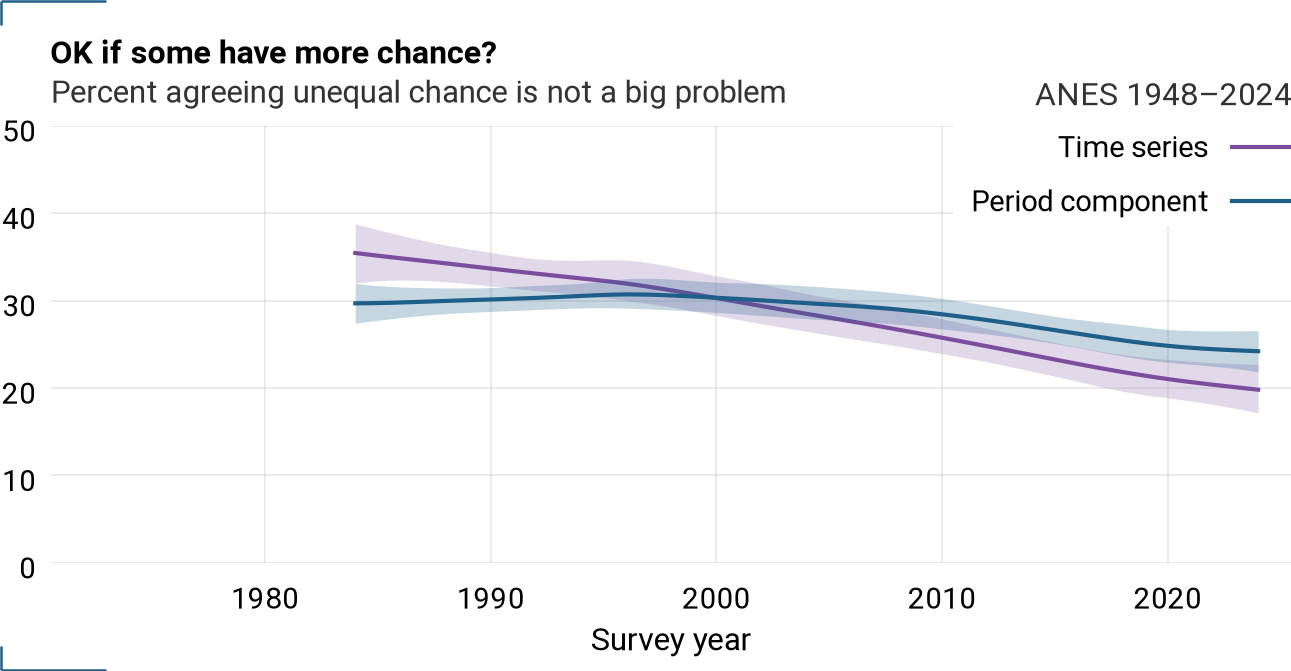
Figure 32:Period component and time series for VCF9016
VCF9017 — Worry less about equality?
Selected (y=1): [1, 2] — Percent agreeing we should worry less about equality
Question
This country would be better off if we worried less about how equal people are. (Agree strongly … disagree strongly.)
Time series
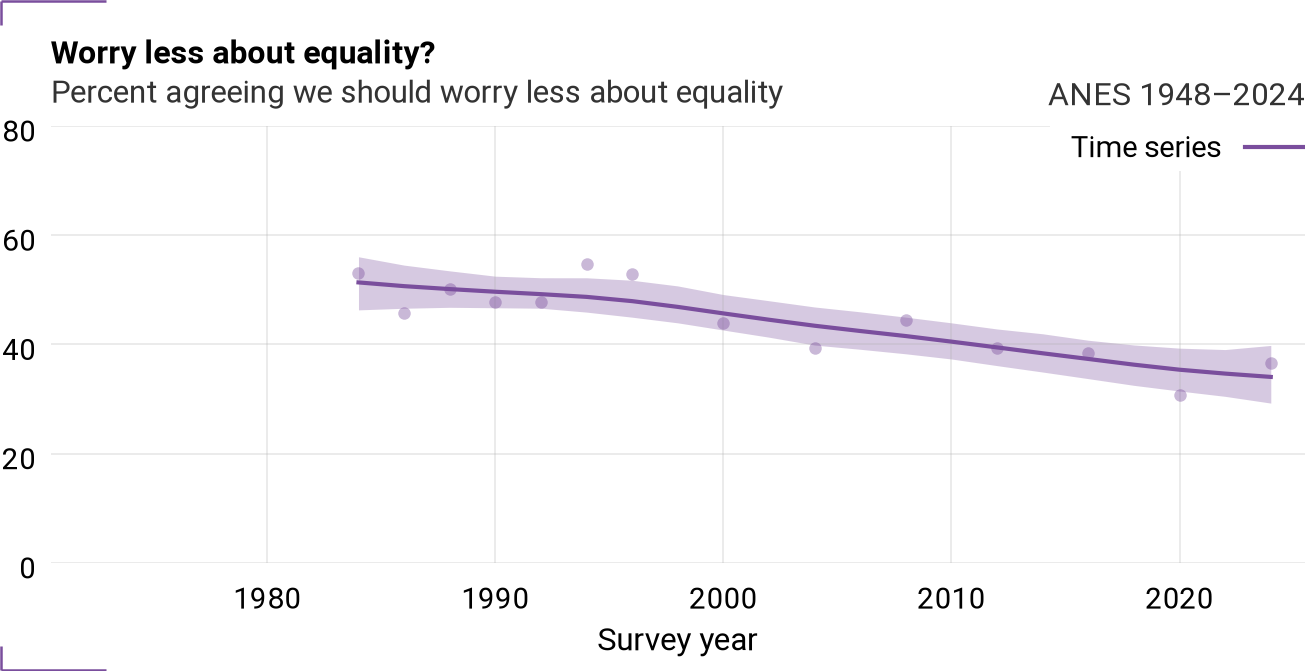
Figure 33:Time series for VCF9017
Cohort trajectories
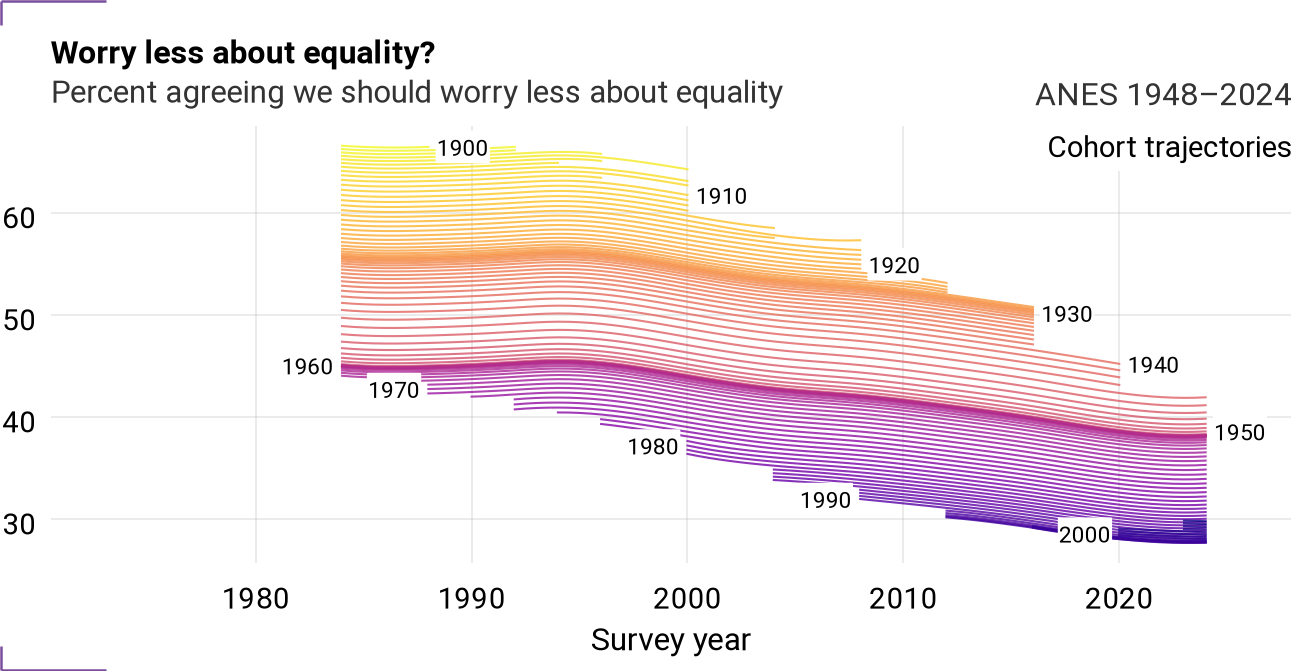
Figure 34:Cohort trajectories for VCF9017
Cohort component
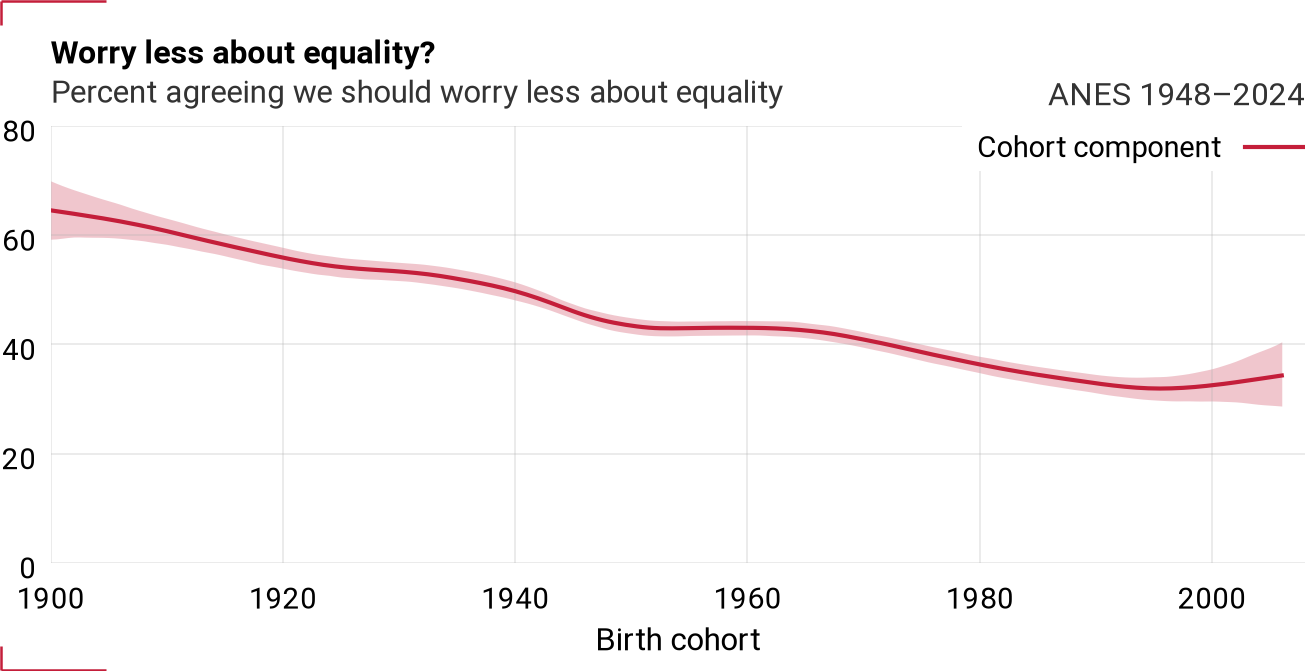
Figure 35:Cohort component for VCF9017
Period component (with time series)
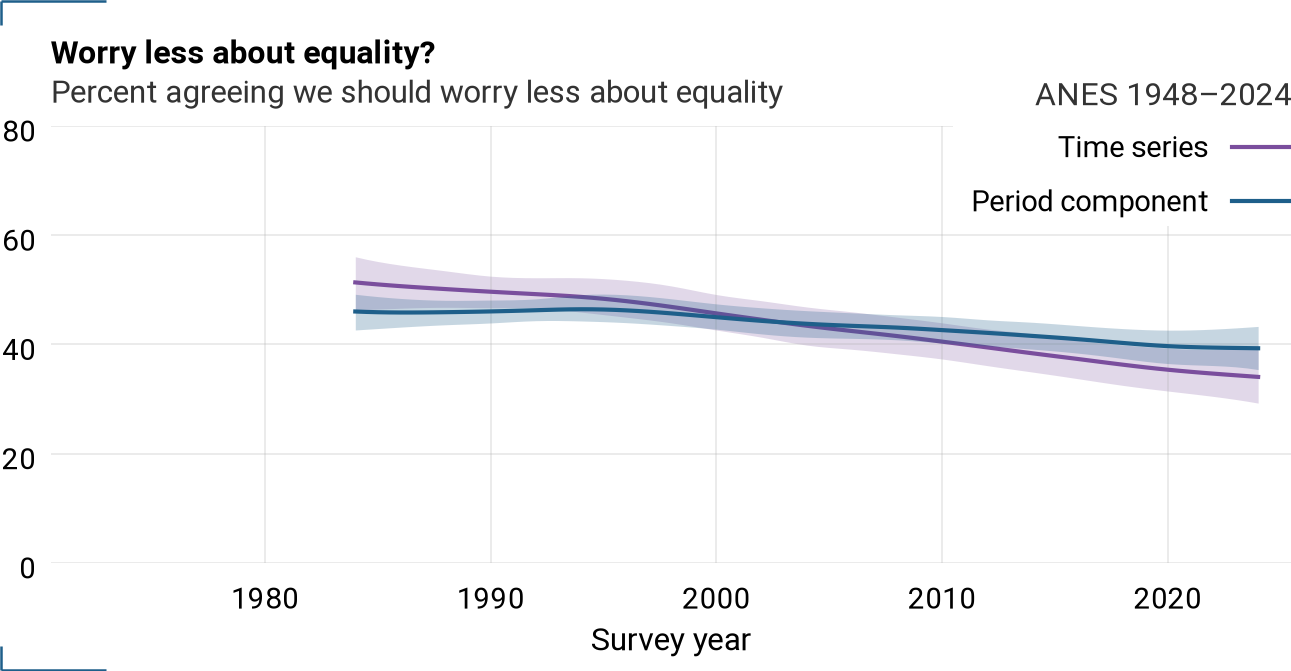
Figure 36:Period component and time series for VCF9017
Government economic role
VCF0809 — Guaranteed jobs and income?
Selected (y=1): [5, 6, 7] — Percent favoring let each person get ahead (5–7)
Question
Some people feel that the government in Washington should see to it that every person has a job and a good standard of living. Others think the government should just let each person get ahead on their own. Where would you place yourself on this scale (1 = government see to job and good standard of living, 7 = let each person get ahead on their own)?
Time series
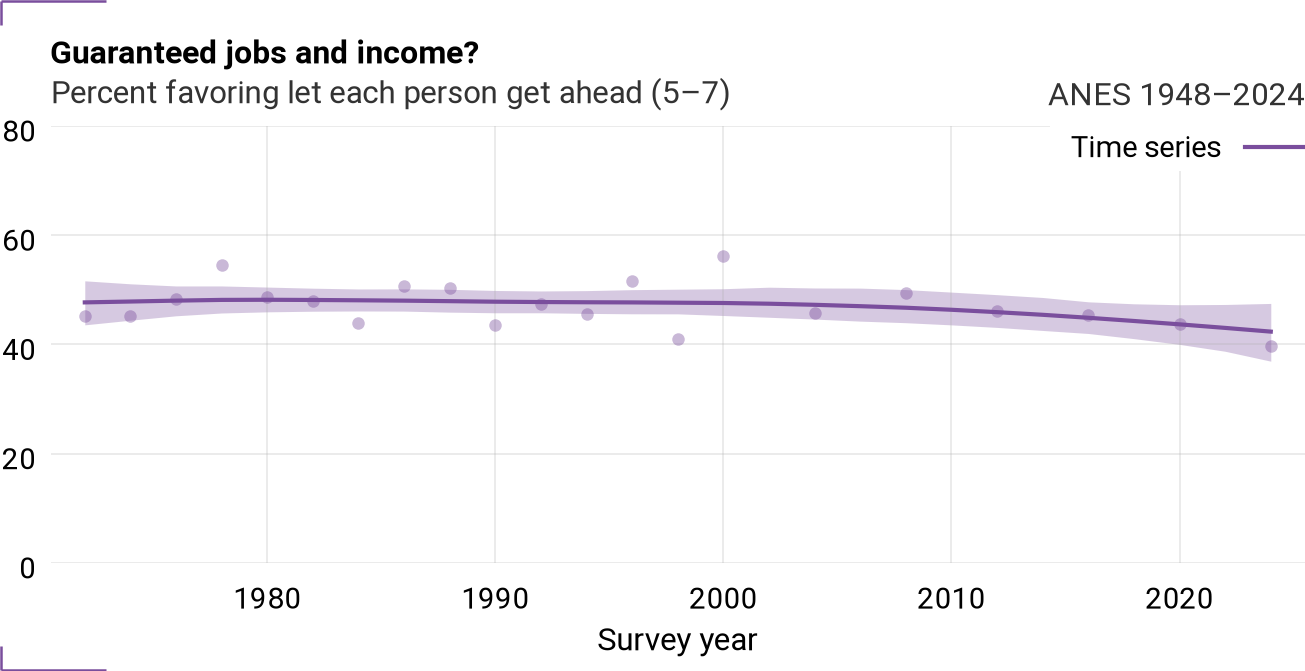
Figure 37:Time series for VCF0809
Cohort trajectories
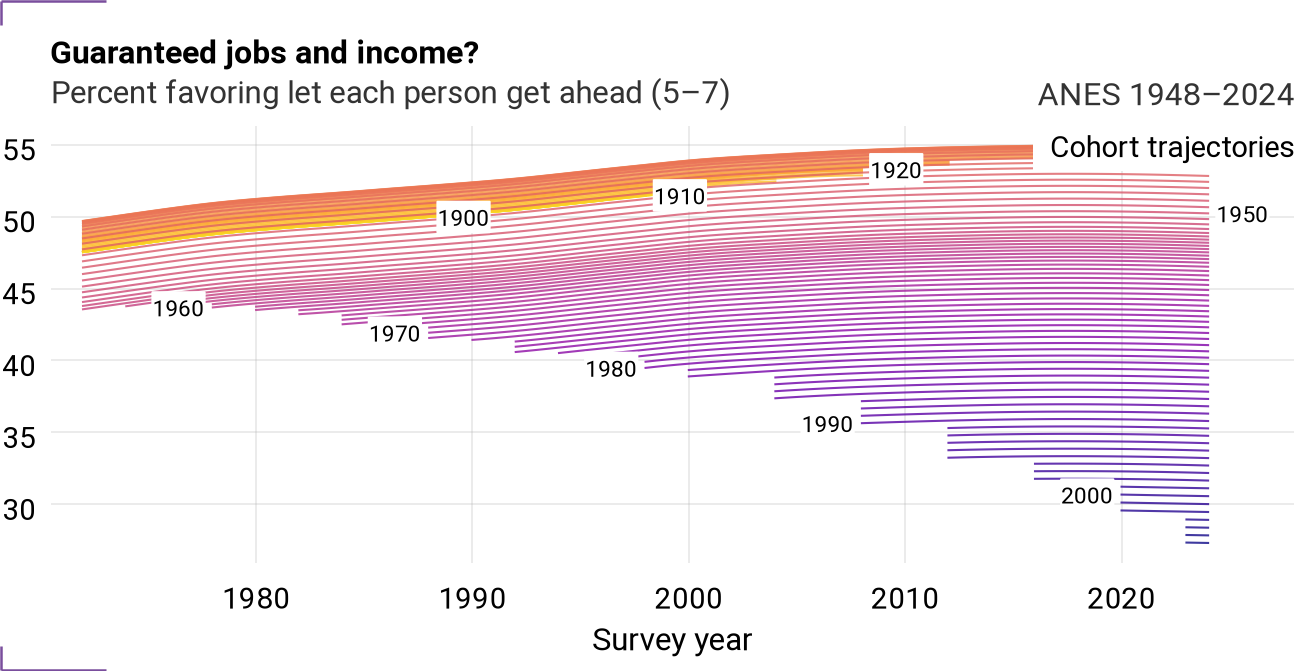
Figure 38:Cohort trajectories for VCF0809
Cohort component
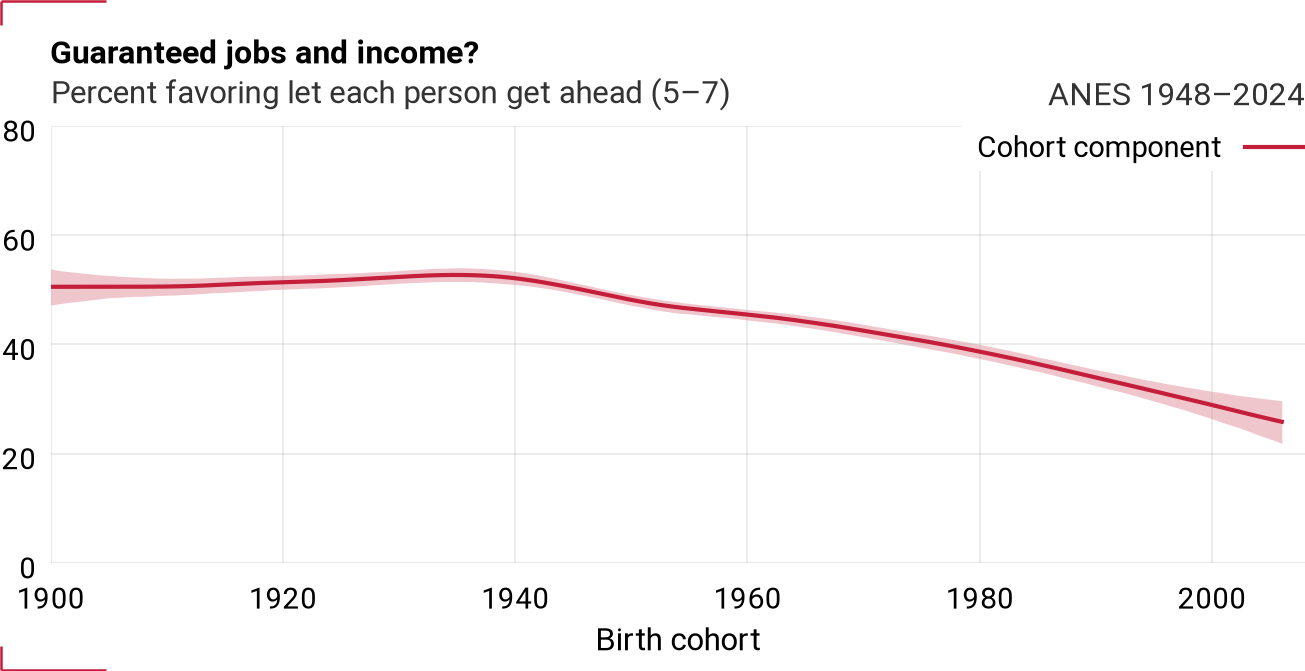
Figure 39:Cohort component for VCF0809
Period component (with time series)
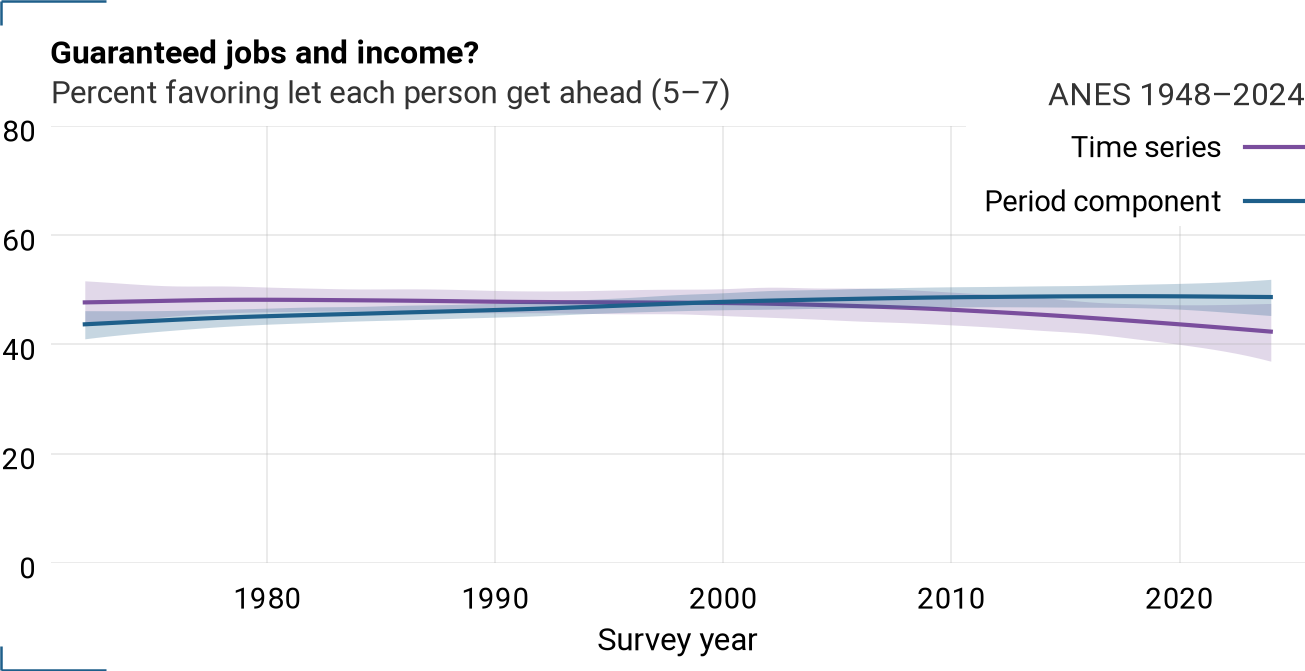
Figure 40:Period component and time series for VCF0809
VCF0839 — Government services vs spending?
Selected (y=1): [1, 2, 3] — Percent favoring fewer government services (1–3)
Question
Some people think the government should provide fewer services, even in areas such as health and education, in order to reduce spending. Other people feel it is important for the government to provide many more services even if it means an increase in spending. Where would you place yourself on this scale (1 = many fewer services, 7 = many more services)?
Time series
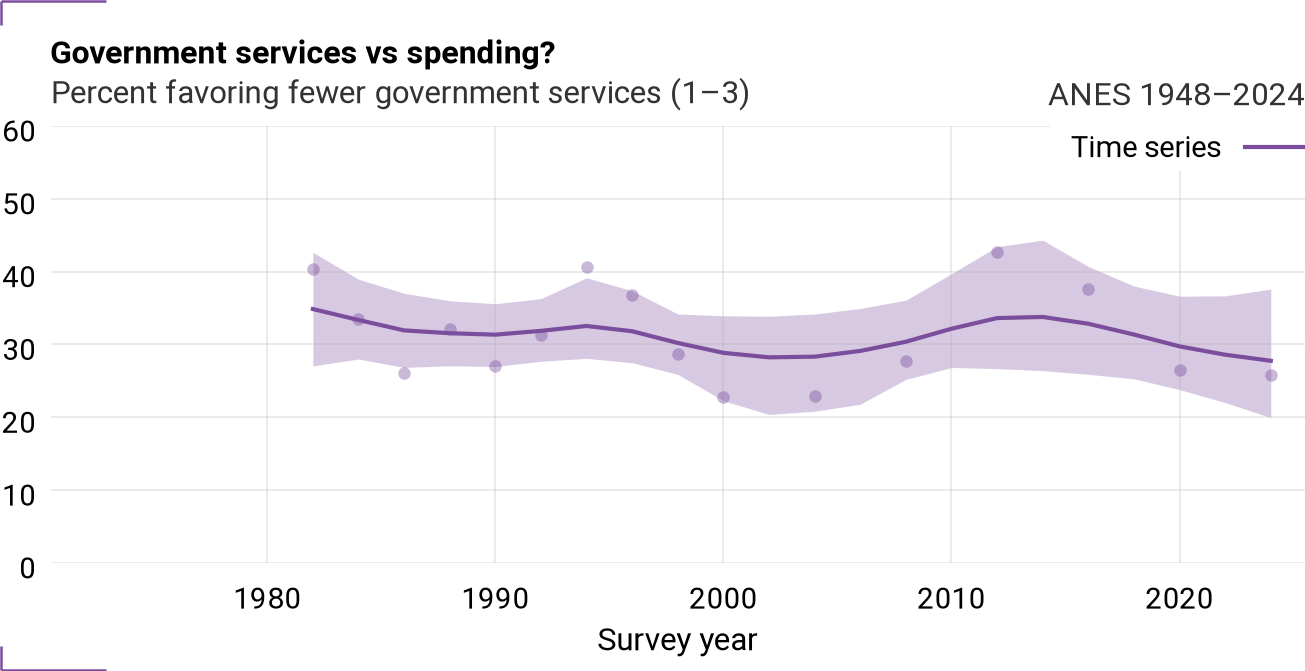
Figure 41:Time series for VCF0839
Cohort trajectories
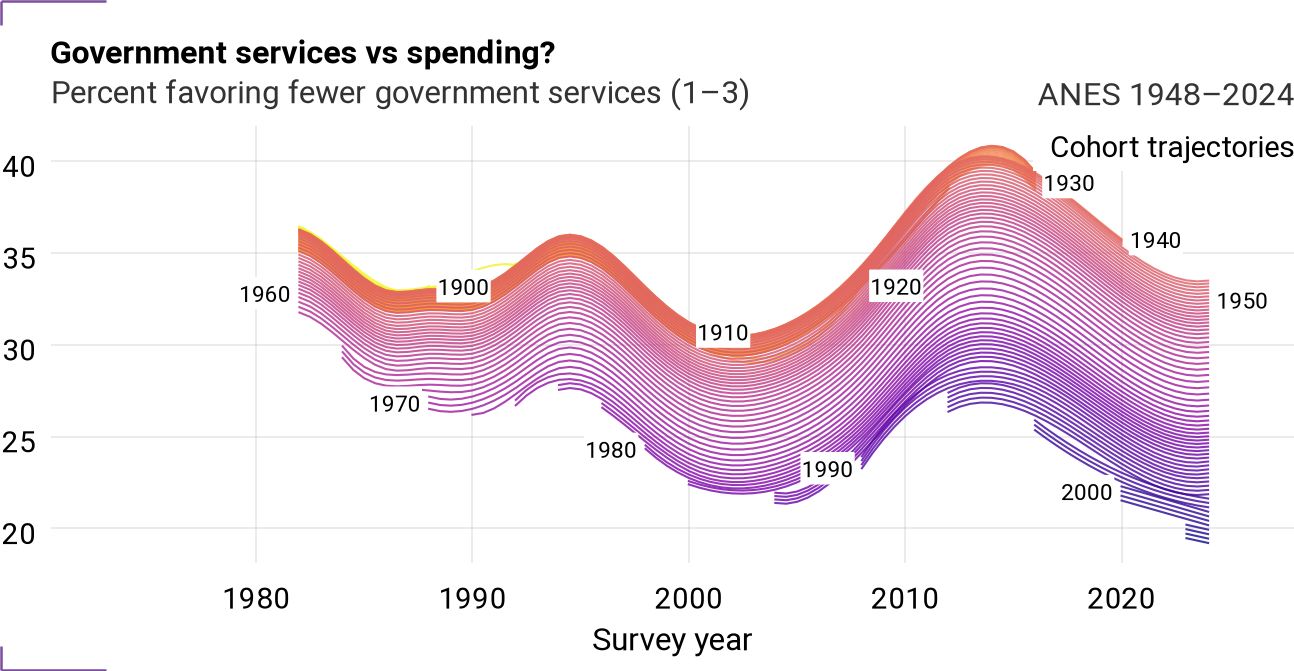
Figure 42:Cohort trajectories for VCF0839
Cohort component
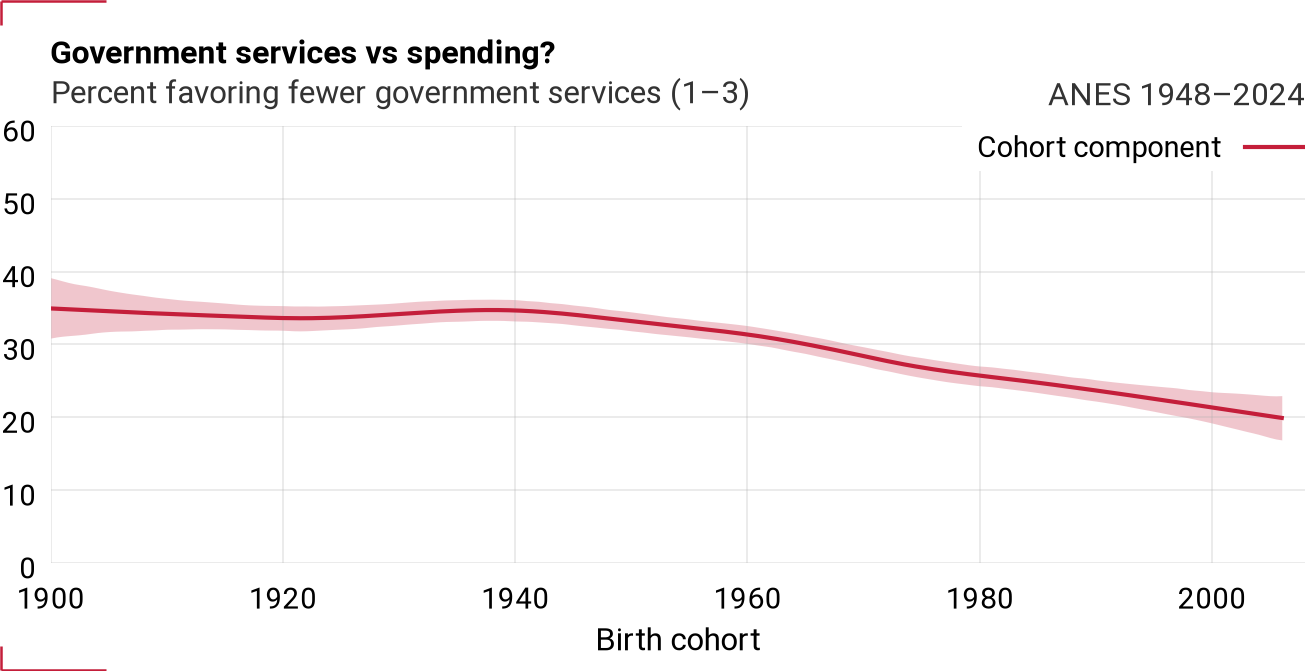
Figure 43:Cohort component for VCF0839
Period component (with time series)
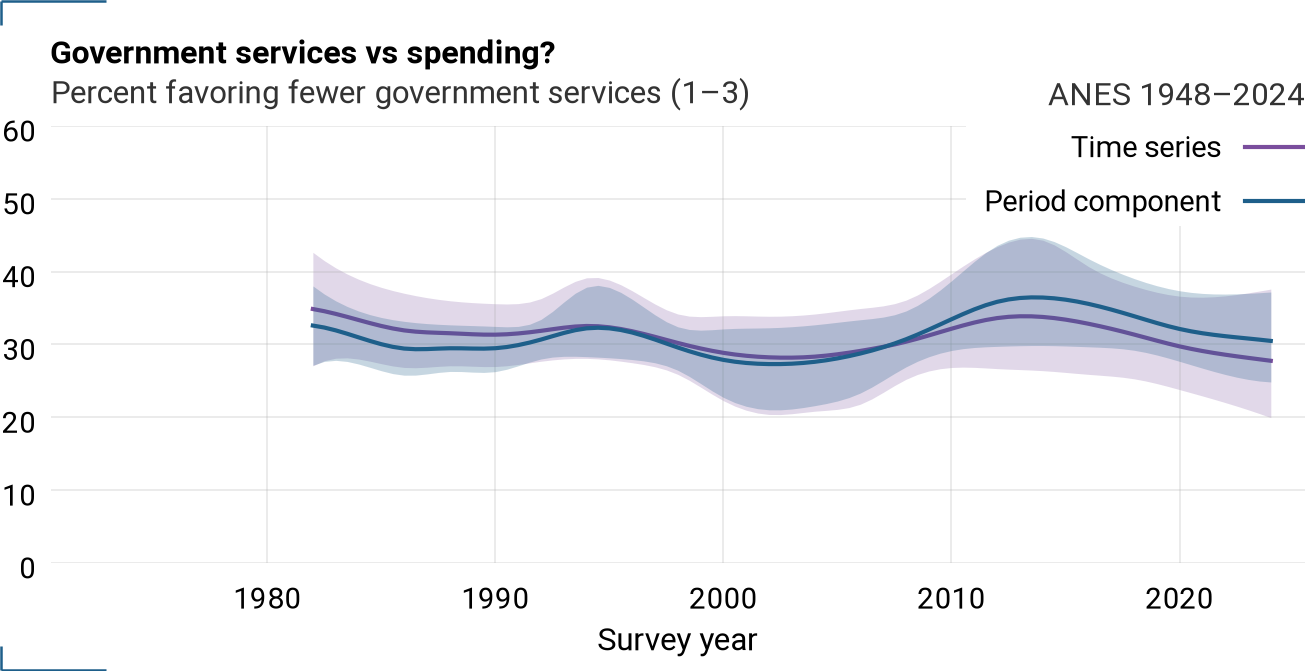
Figure 44:Period component and time series for VCF0839
VCF0806 — Government health insurance?
Selected (y=1): [5, 6, 7] — Percent favoring private health insurance (5–7)
Question
There is much concern about the rapid rise in medical and hospital costs. Some feel there should be a government insurance plan which would cover all medical and hospital expenses. Others feel that medical expenses should be paid by individuals and through private insurance. Where would you place yourself on this scale (1 = government insurance plan, 7 = private insurance plan)?
Time series
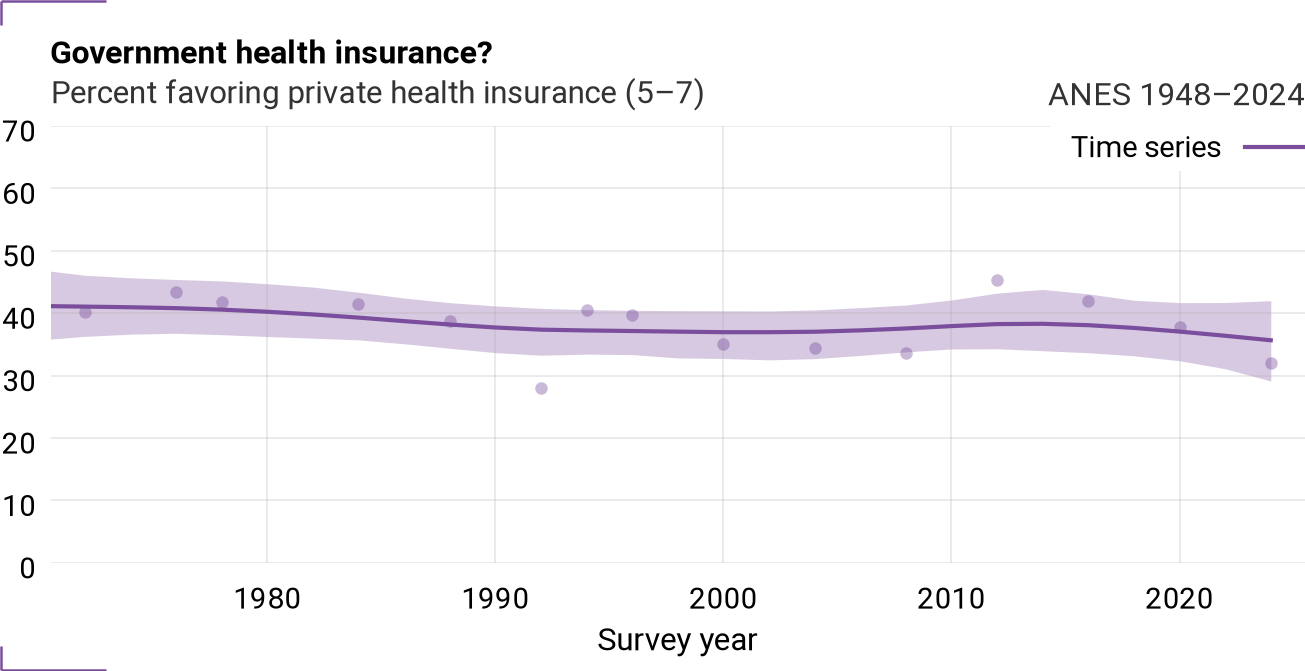
Figure 45:Time series for VCF0806
Cohort trajectories
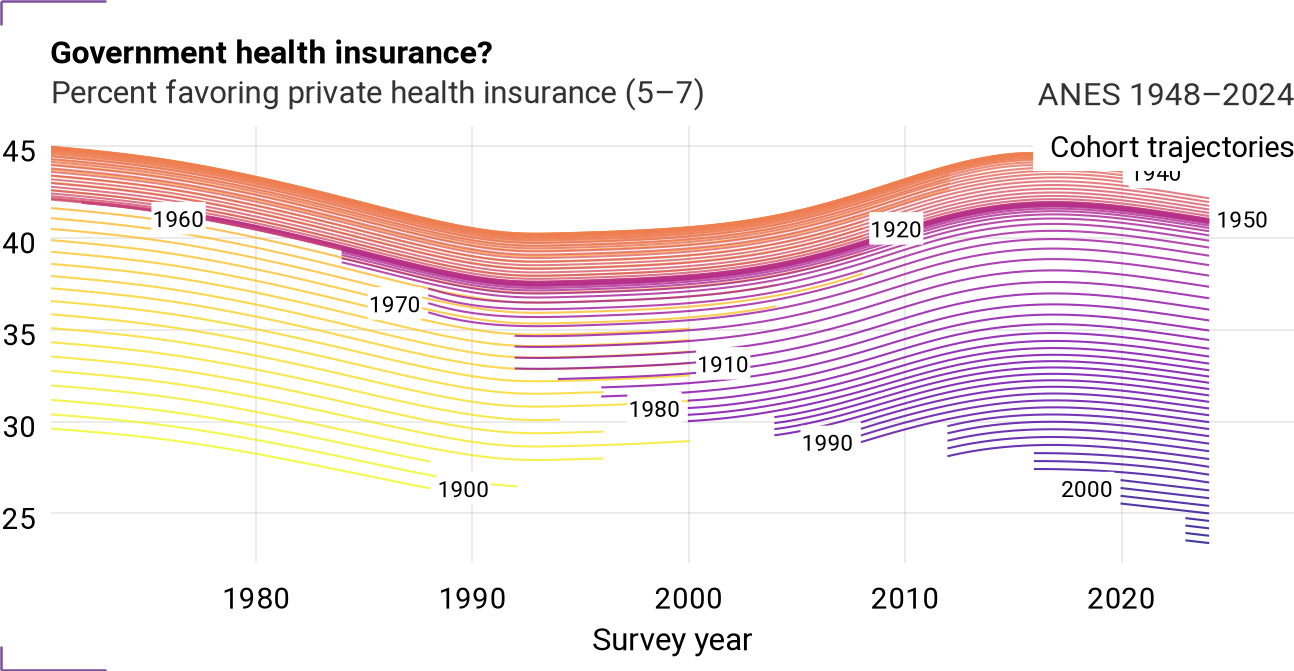
Figure 46:Cohort trajectories for VCF0806
Cohort component
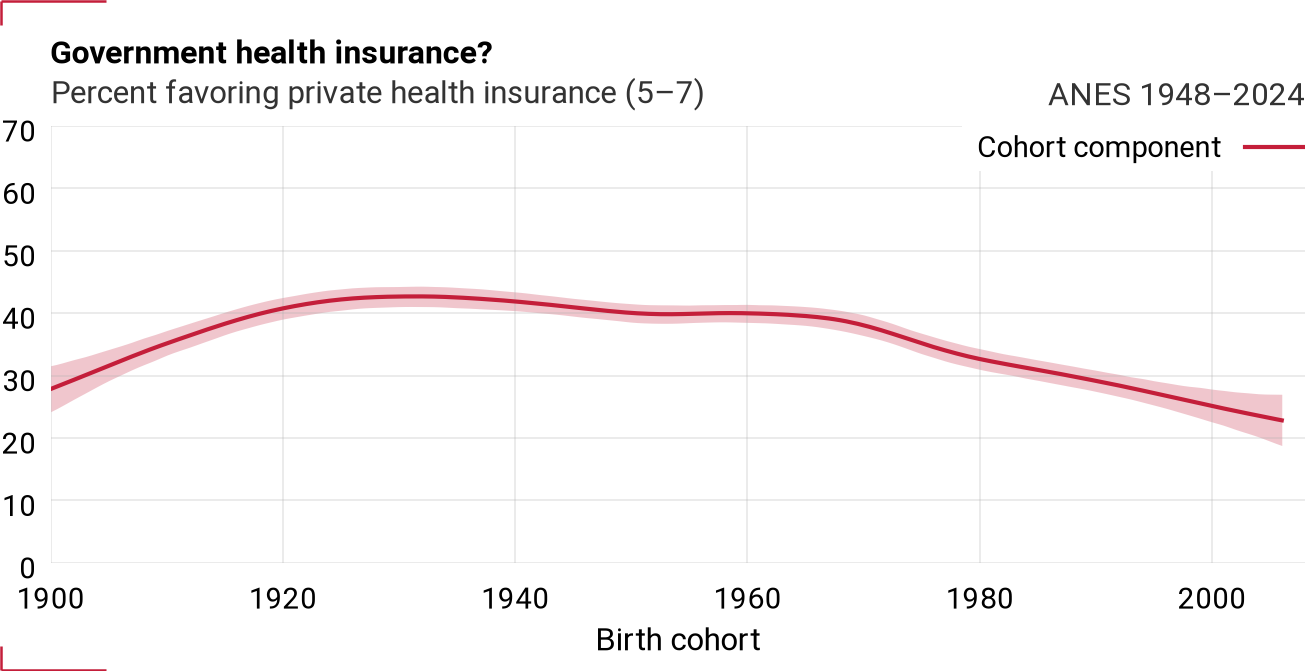
Figure 47:Cohort component for VCF0806
Period component (with time series)
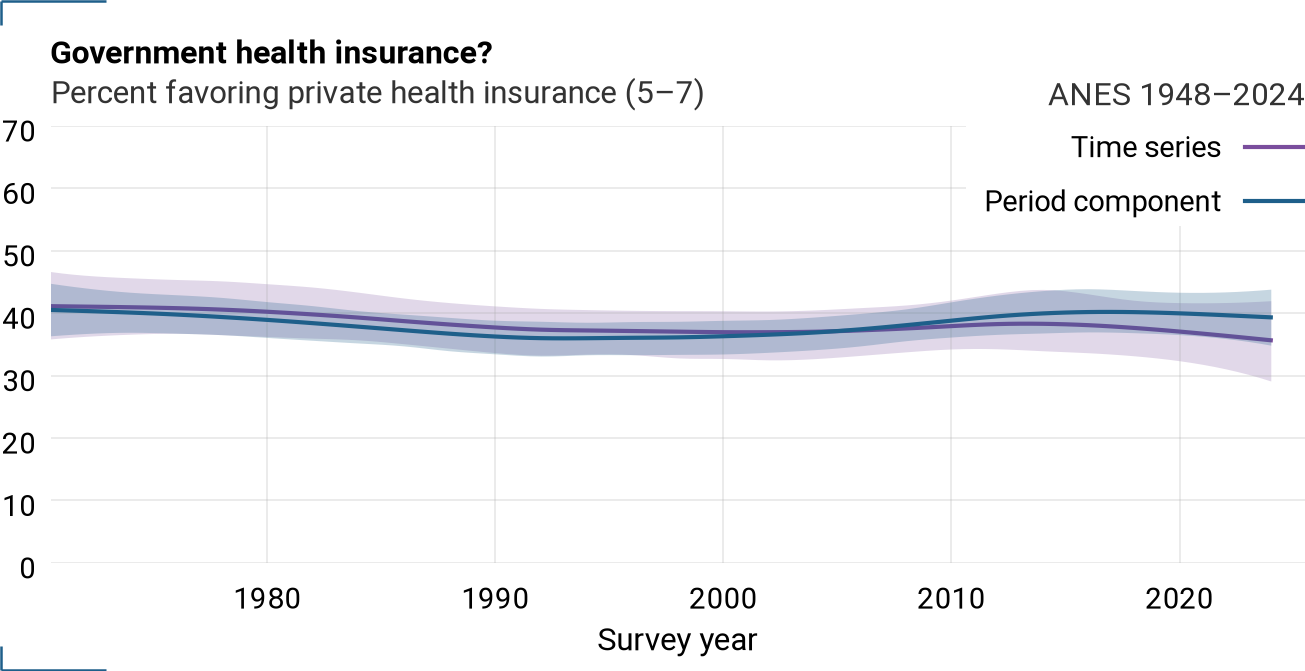
Figure 48:Period component and time series for VCF0806
Mobility & merit
getahead — Get ahead by hard work?
Selected (y=1): [1] — Percent saying hard work most important
Question
Some people say that people get ahead by their own hard work; others say that lucky breaks or help from other people are more important. Which do you think is most important?
Time series
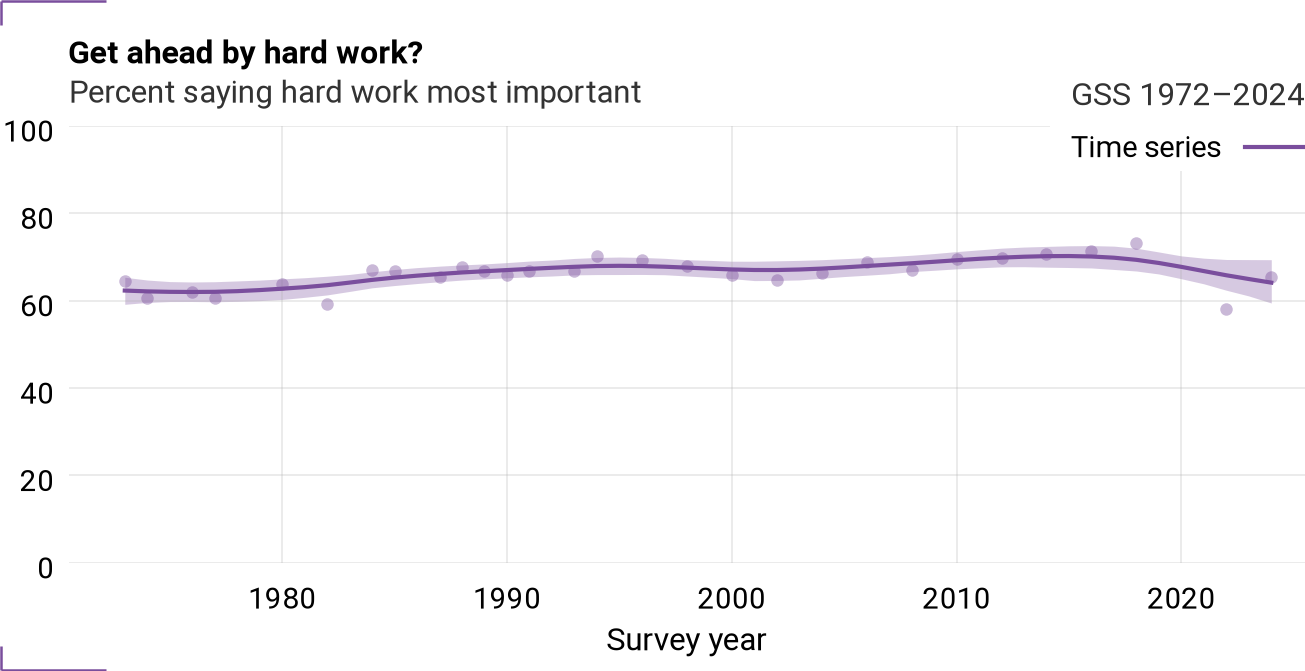
Figure 49:Time series for getahead
Cohort trajectories
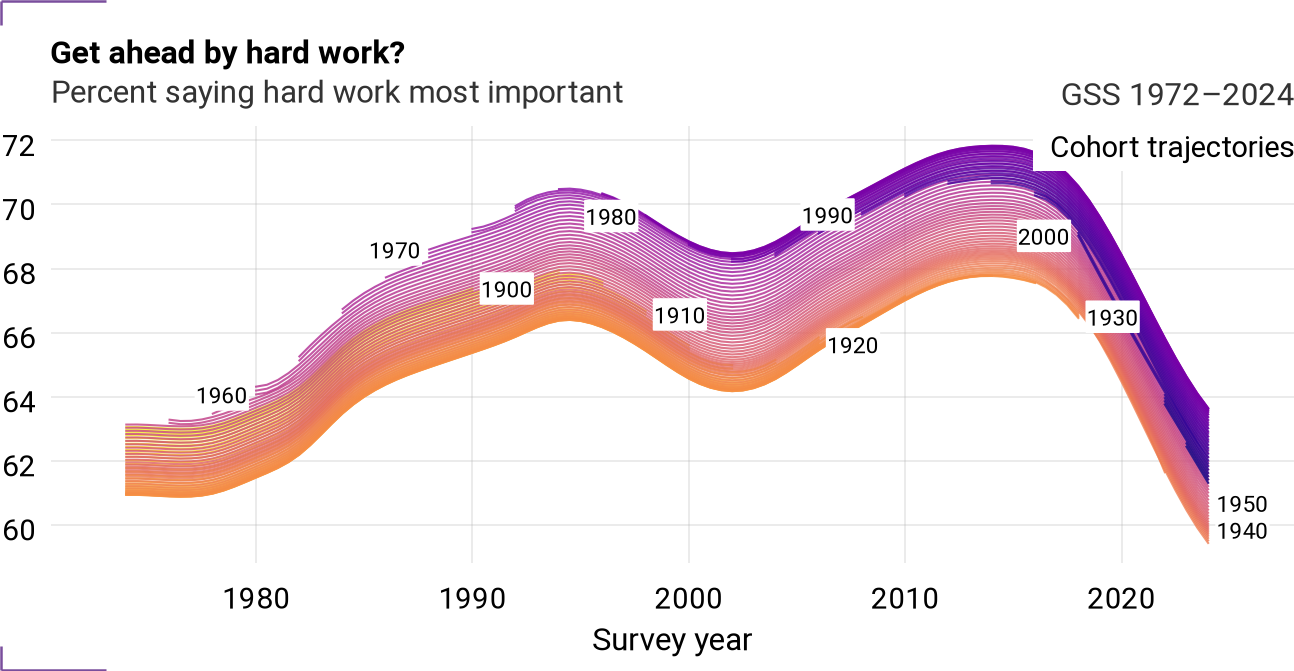
Figure 50:Cohort trajectories for getahead
Cohort component
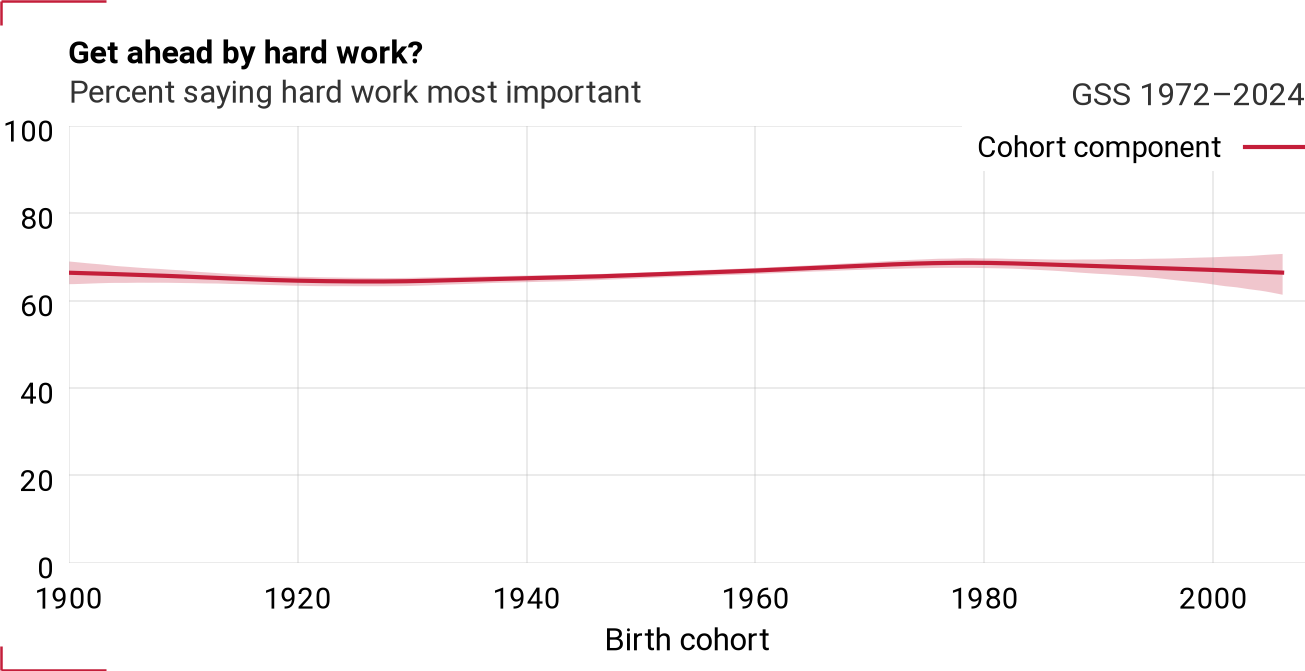
Figure 51:Cohort component for getahead
Period component (with time series)
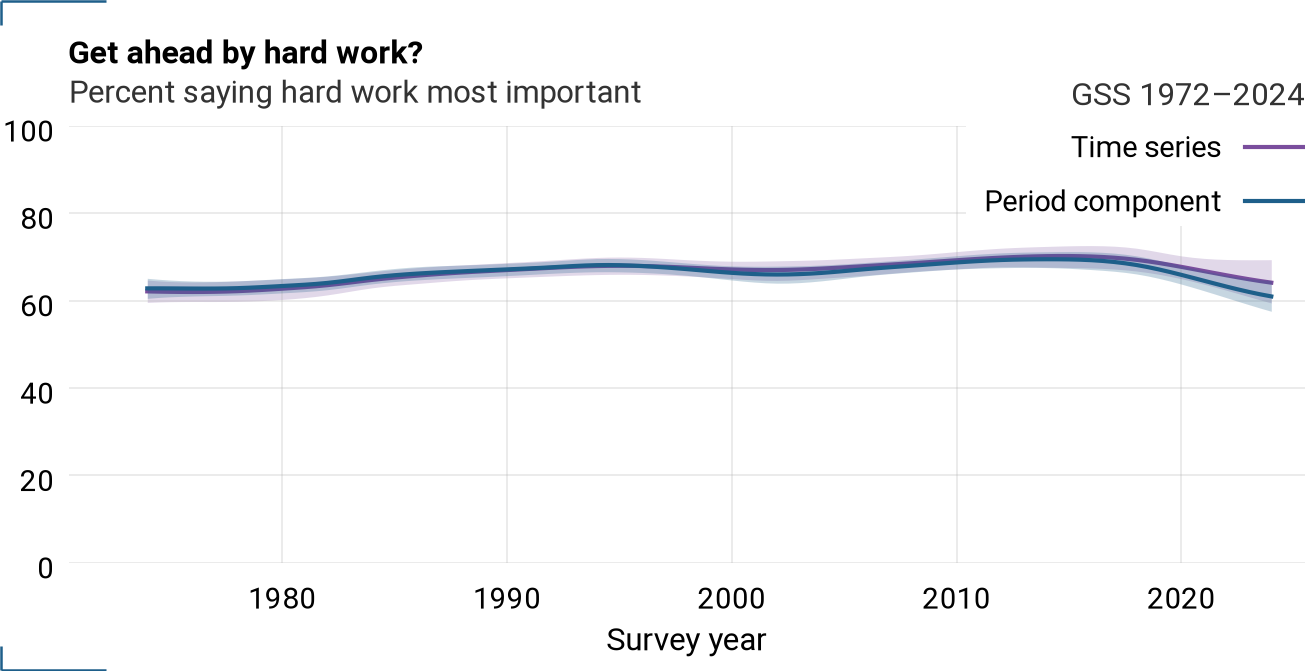
Figure 52:Period component and time series for getahead
goodlife — Good chance of improving living standard?
Selected (y=1): [1, 2] — Percent agreeing living standard can improve
Question
The way things are in America, people like me and my family have a good chance of improving our standard of living — do you agree or disagree?
Time series
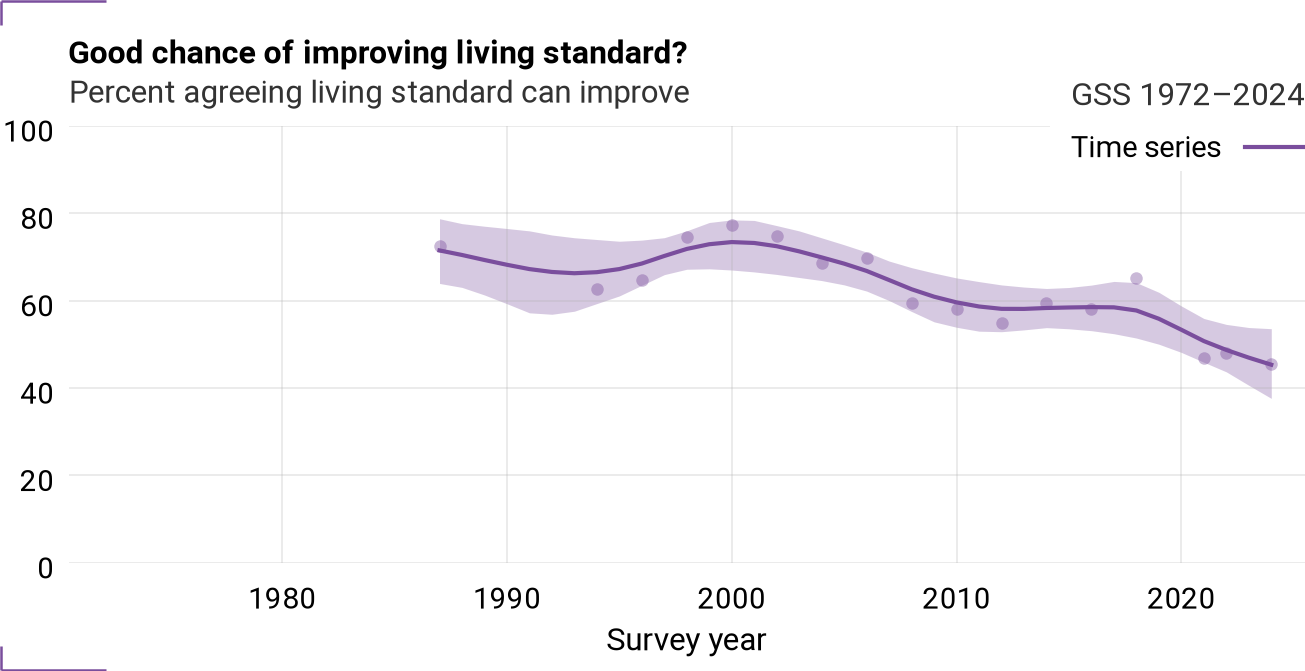
Figure 53:Time series for goodlife
Cohort trajectories
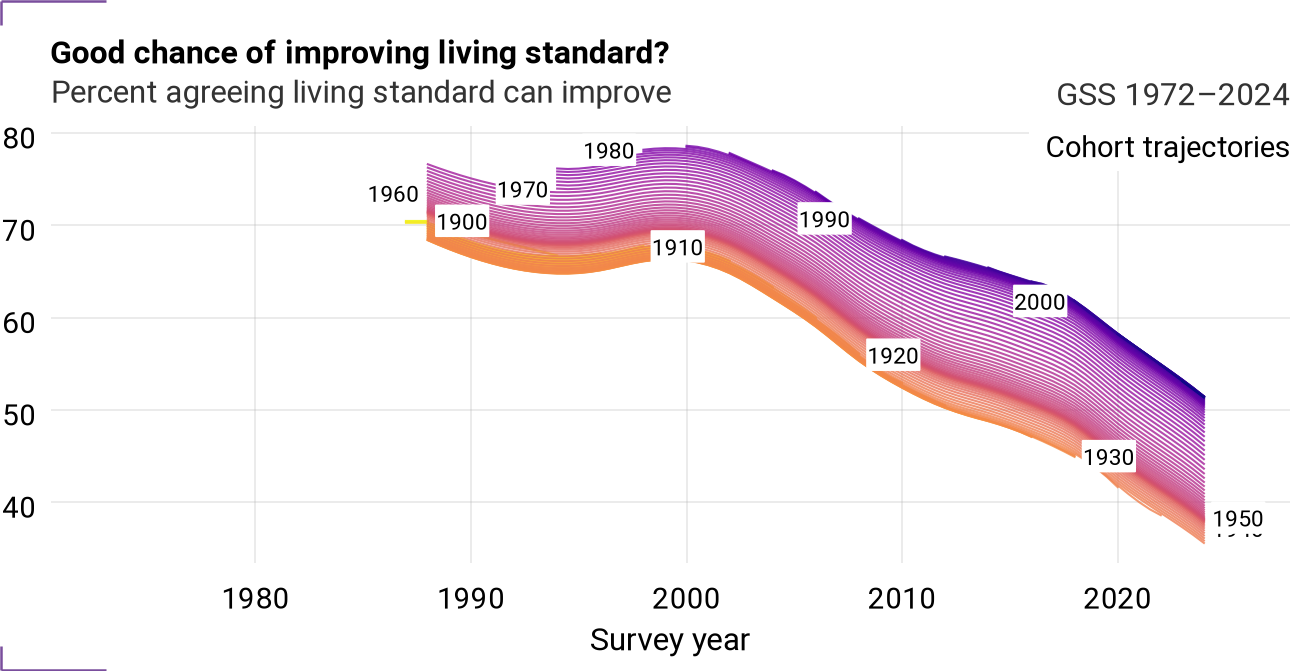
Figure 54:Cohort trajectories for goodlife
Cohort component
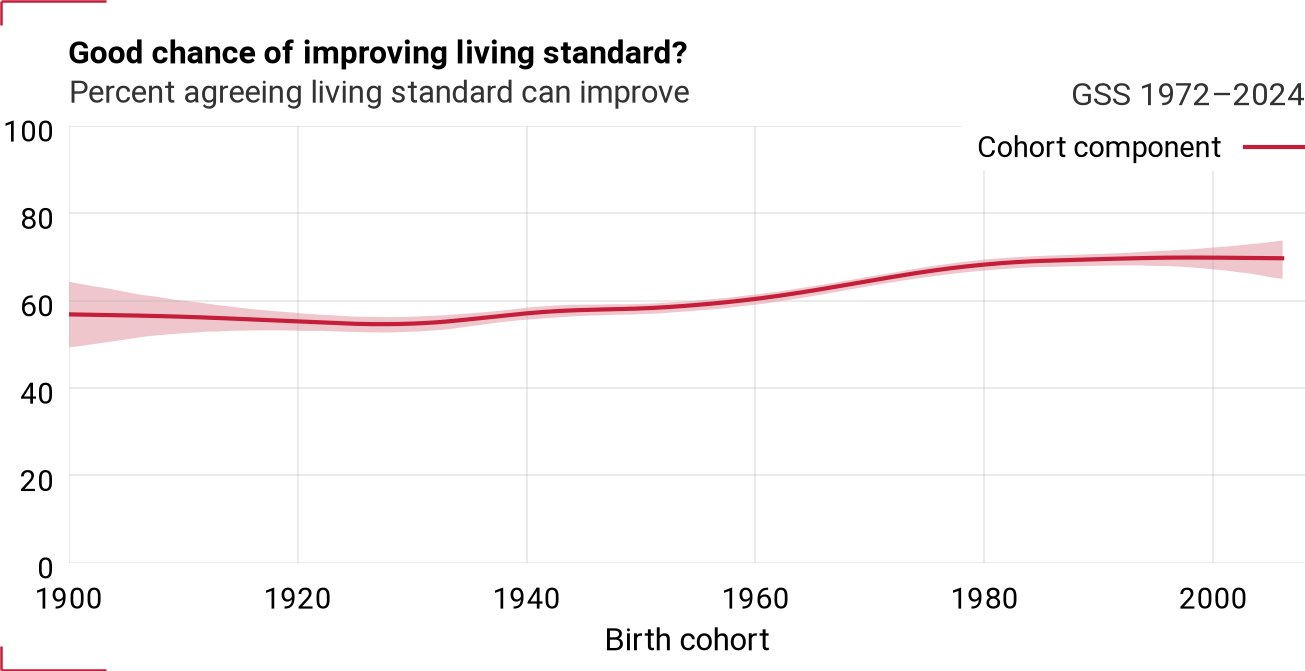
Figure 55:Cohort component for goodlife
Period component (with time series)
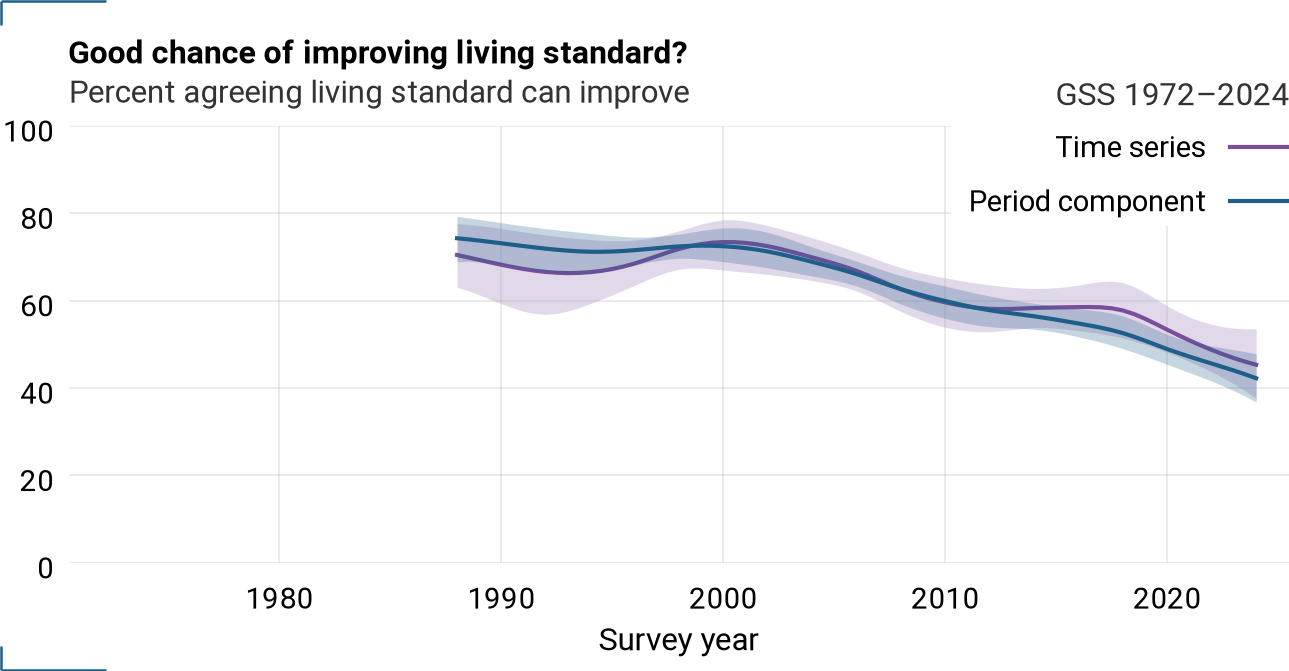
Figure 56:Period component and time series for goodlife
parsol — Living standard vs parents?
Selected (y=1): [1, 2] — Percent saying better than parents
Question
Compared to your parents when they were the age you are now, do you think your own standard of living now is much better, somewhat better, about the same, somewhat worse, or much worse than theirs was?
Time series
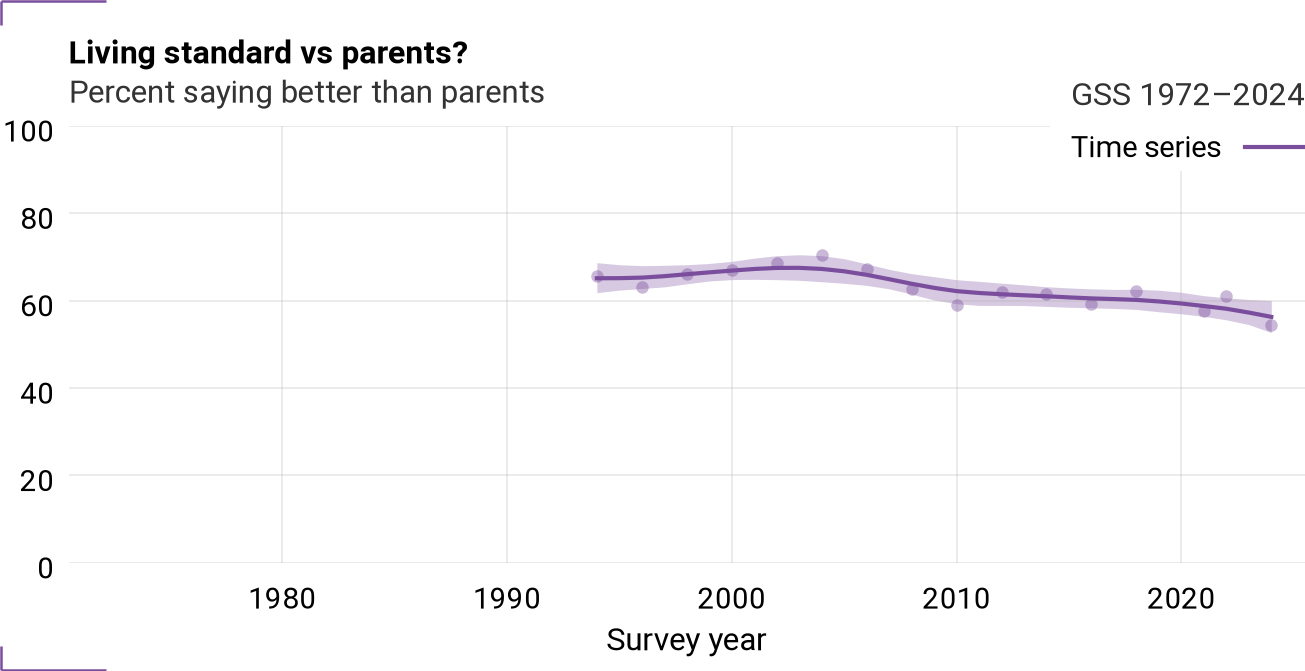
Figure 57:Time series for parsol
Cohort trajectories
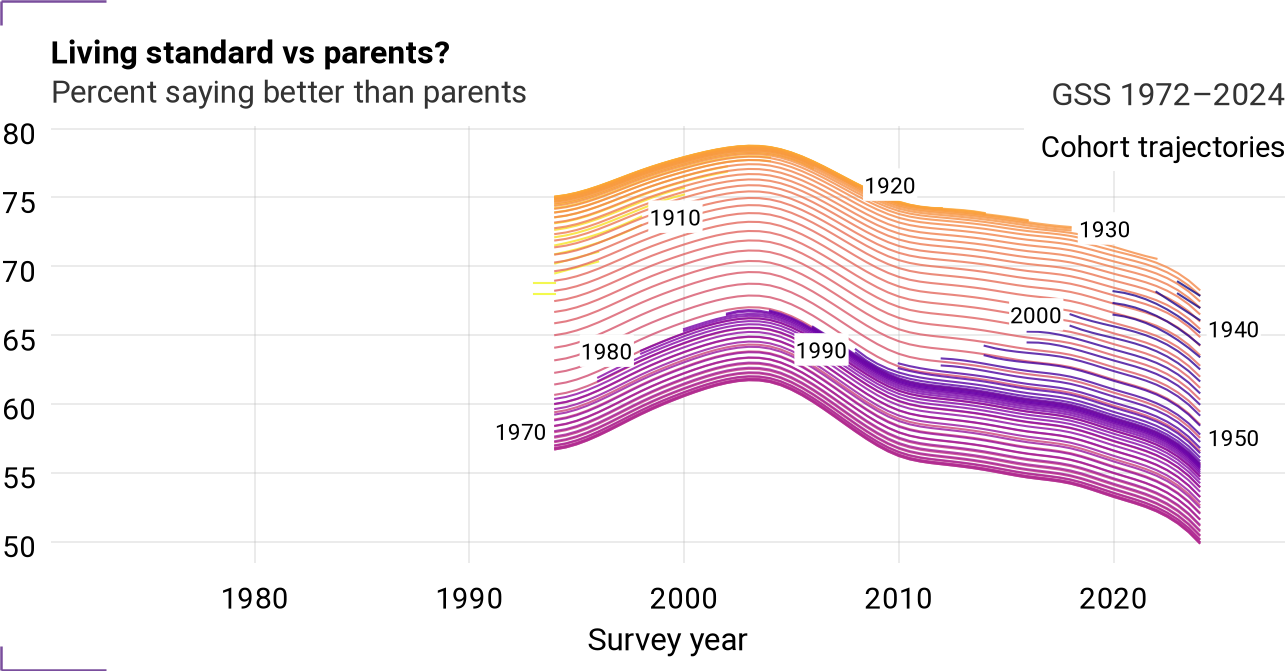
Figure 58:Cohort trajectories for parsol
Cohort component
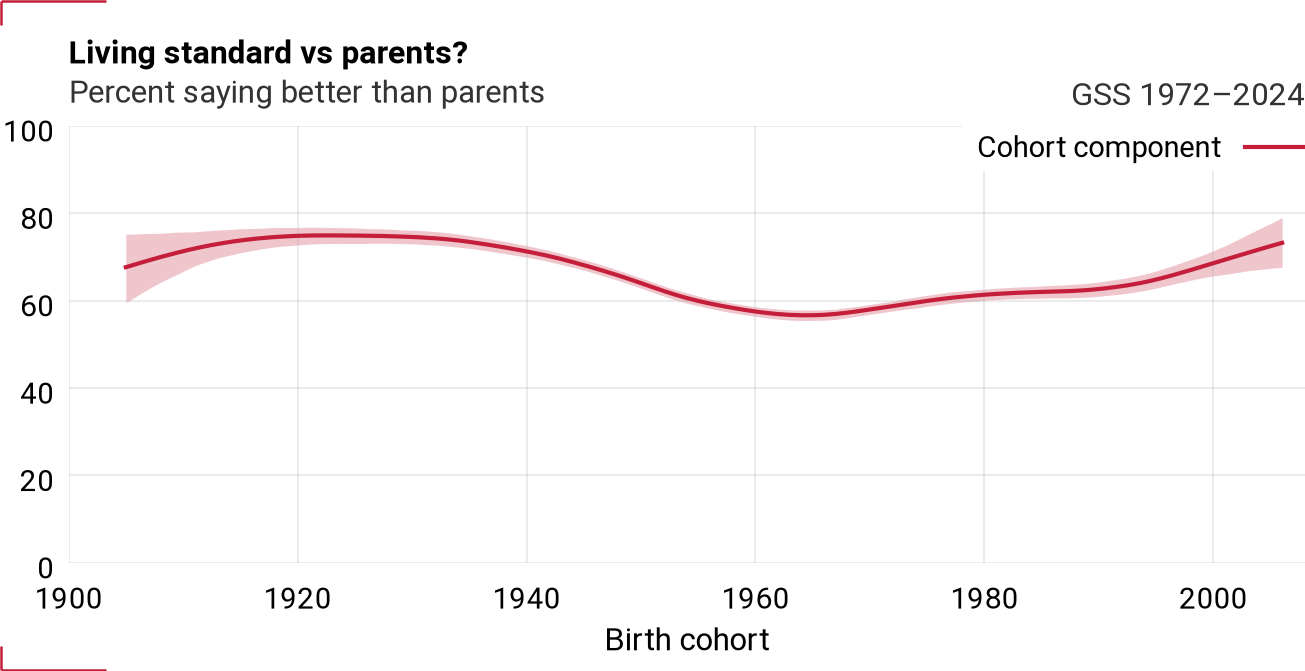
Figure 59:Cohort component for parsol
Period component (with time series)
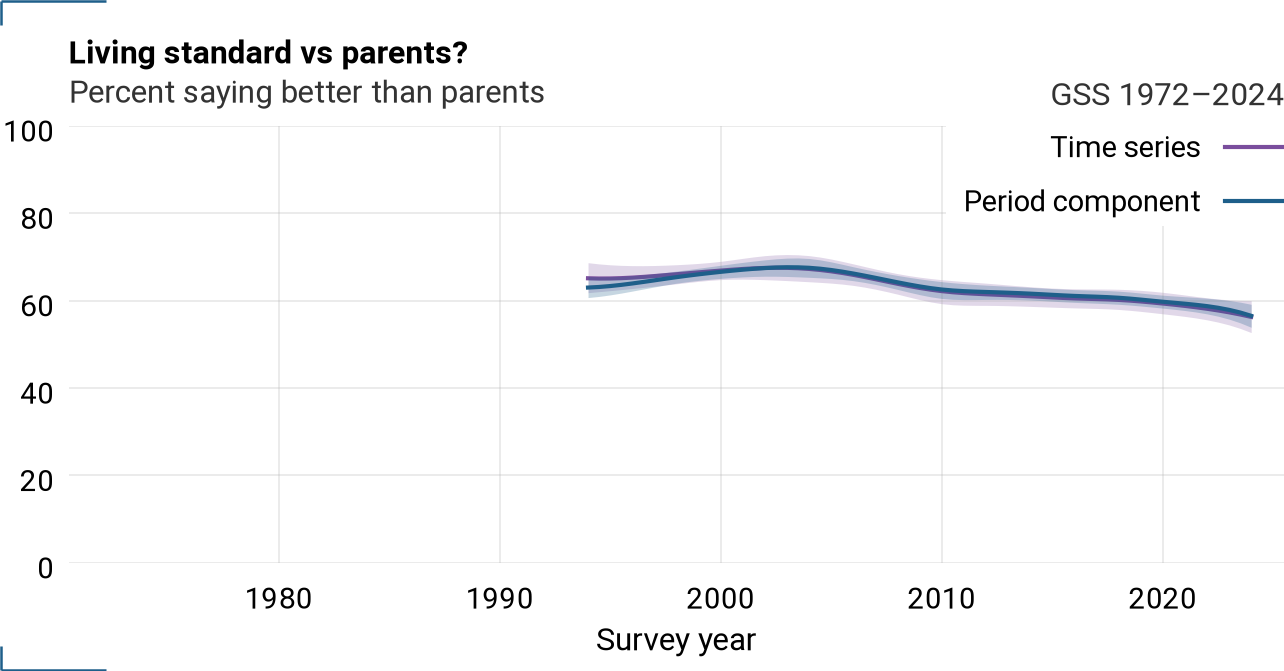
Figure 60:Period component and time series for parsol
Class, finances & housing
class — Subjective social class?
Selected (y=1): [2] — Percent identifying as working class
Question
If you were asked to use one of four names for your social class, which would you say you belong in: the lower class, the working class, the middle class, or the upper class?
Time series
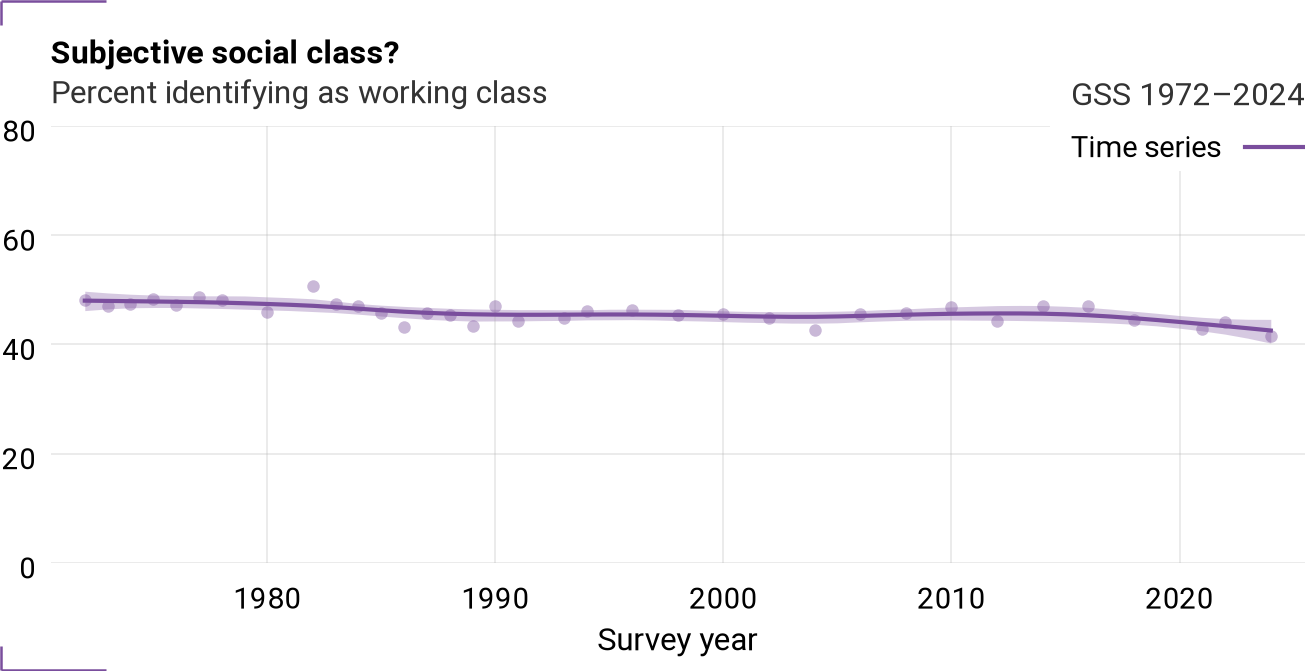
Figure 61:Time series for class
Cohort trajectories
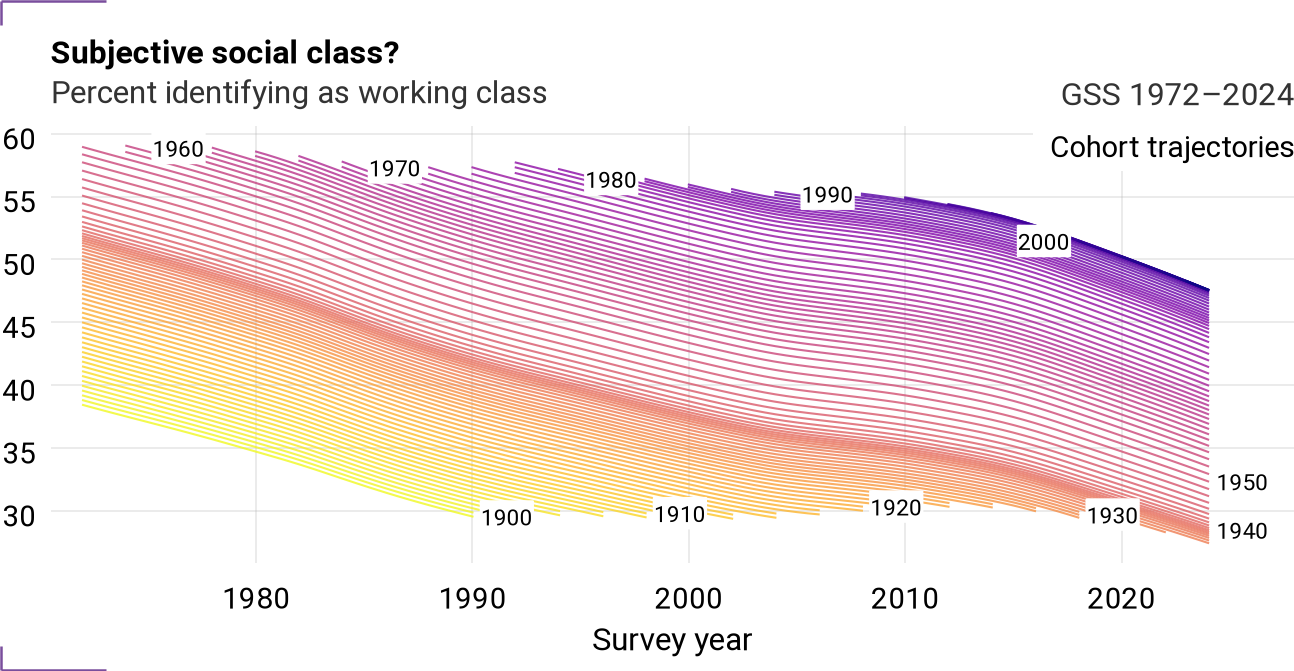
Figure 62:Cohort trajectories for class
Cohort component
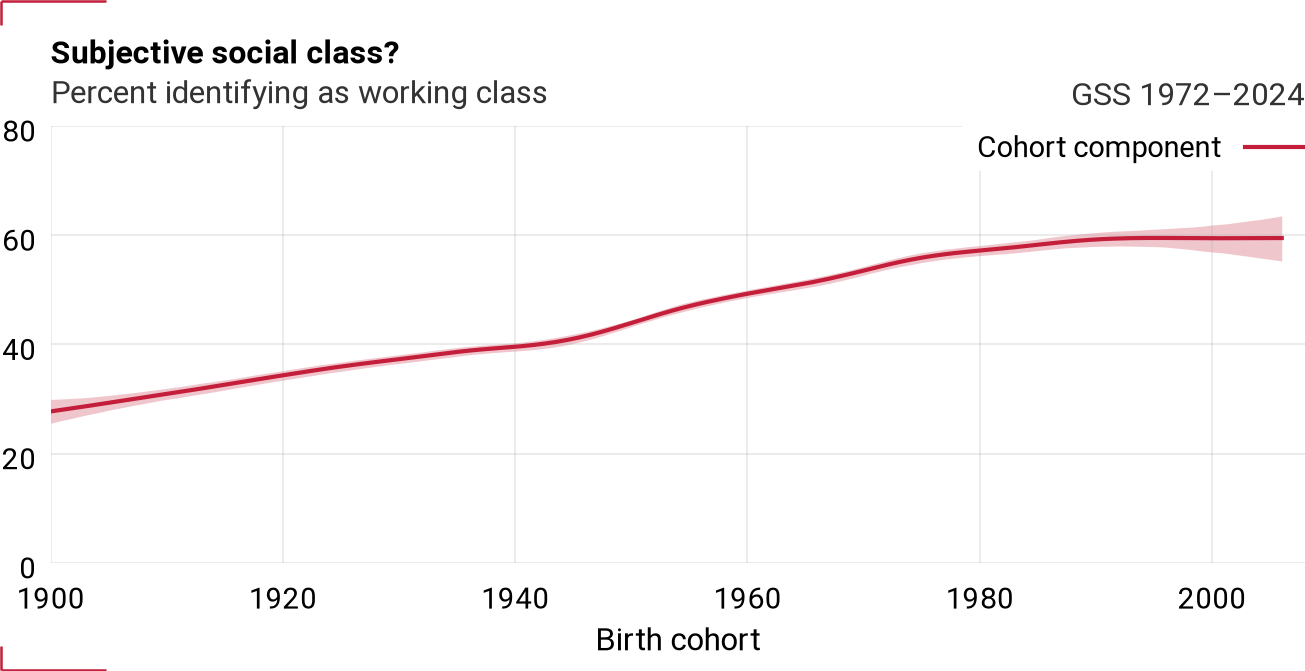
Figure 63:Cohort component for class
Period component (with time series)
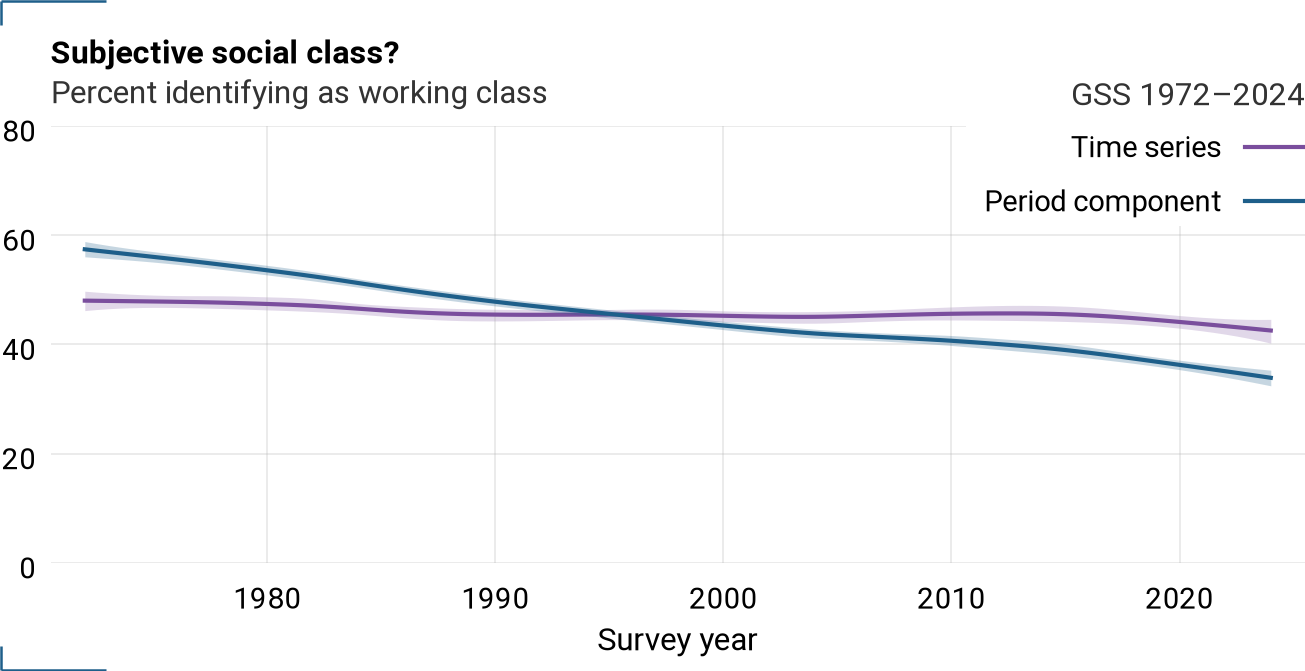
Figure 64:Period component and time series for class
VCF0148 — Subjective social class?
Selected (y=1): [0, 1, 2, 3] — Percent lower or working class
Question
There’s been some talk these days about different social classes. Most people say they belong either to the middle class or the working class. Do you ever think of yourself as belonging in one of these classes? Which one?
Time series
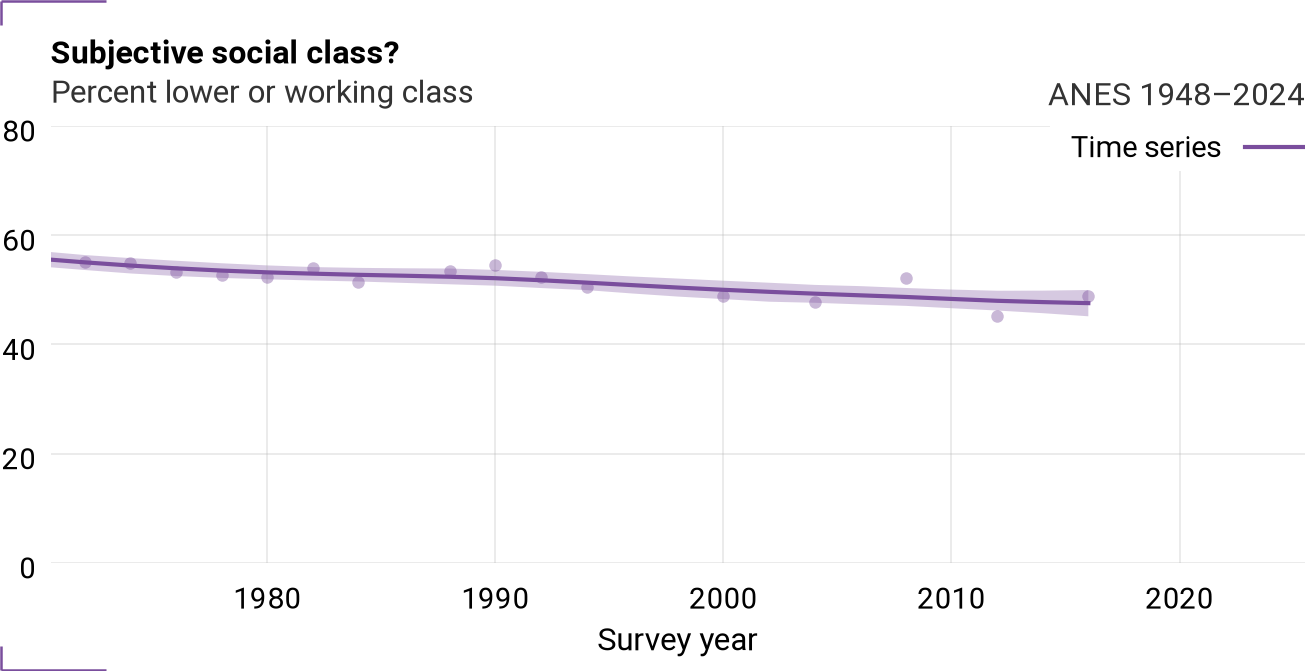
Figure 65:Time series for VCF0148
Cohort trajectories
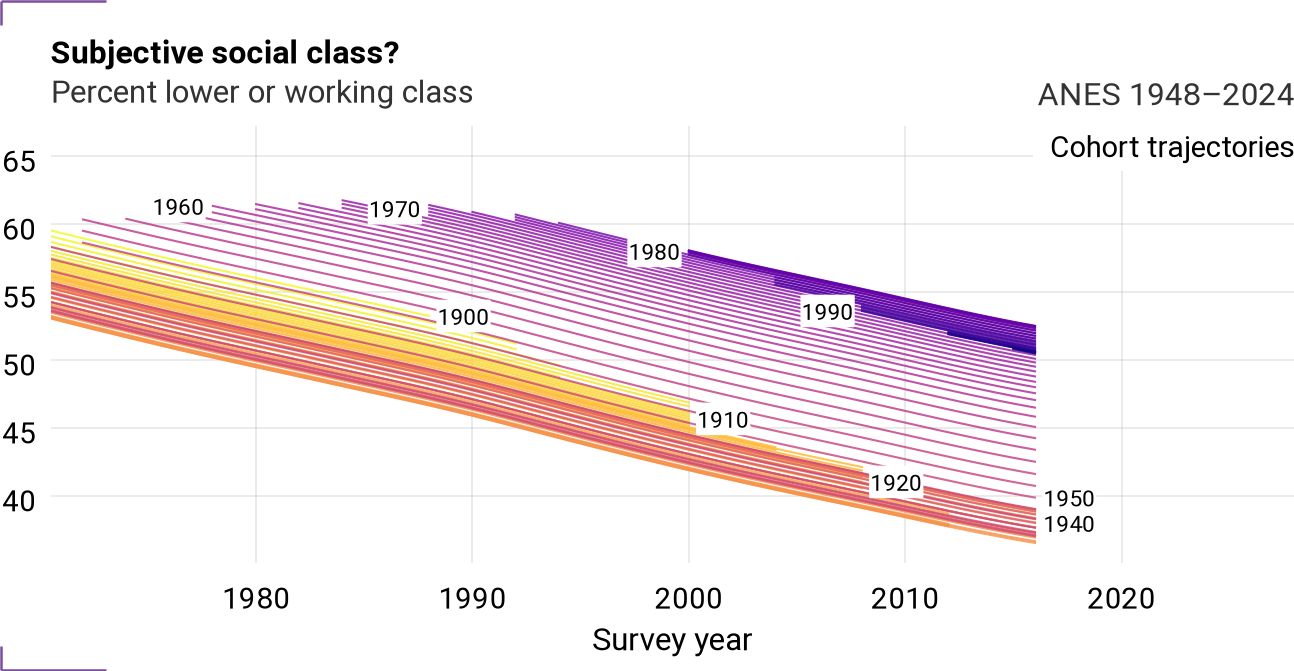
Figure 66:Cohort trajectories for VCF0148
Cohort component
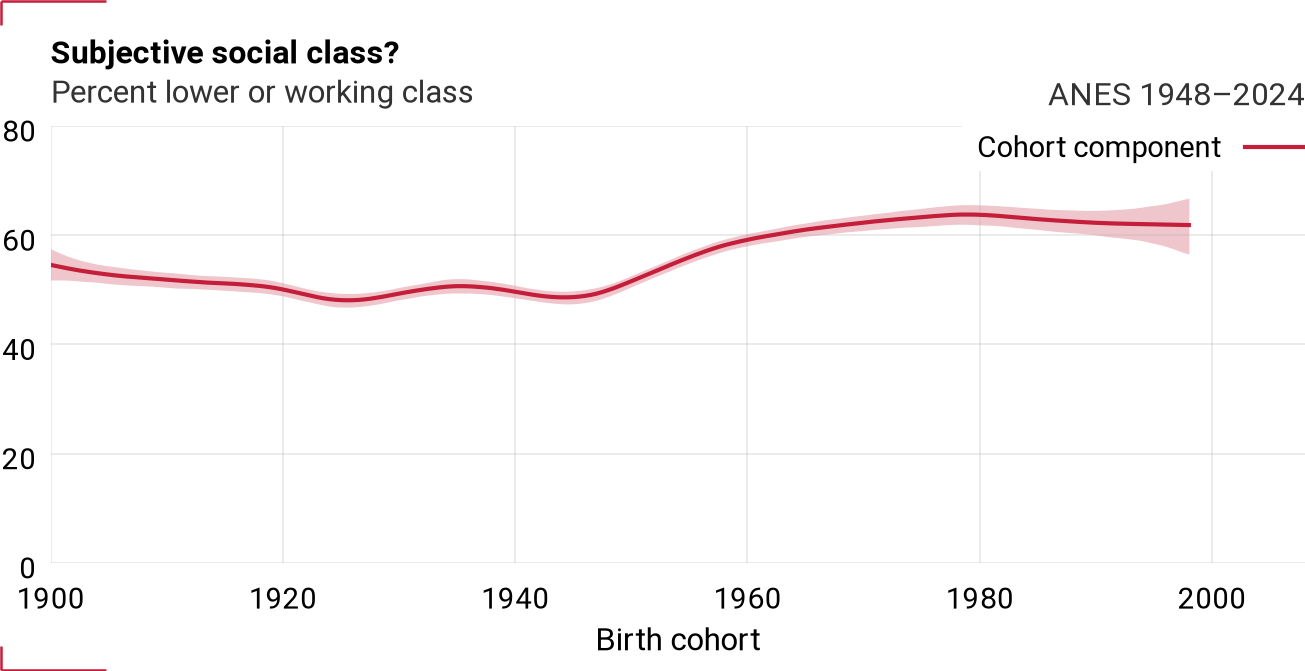
Figure 67:Cohort component for VCF0148
Period component (with time series)
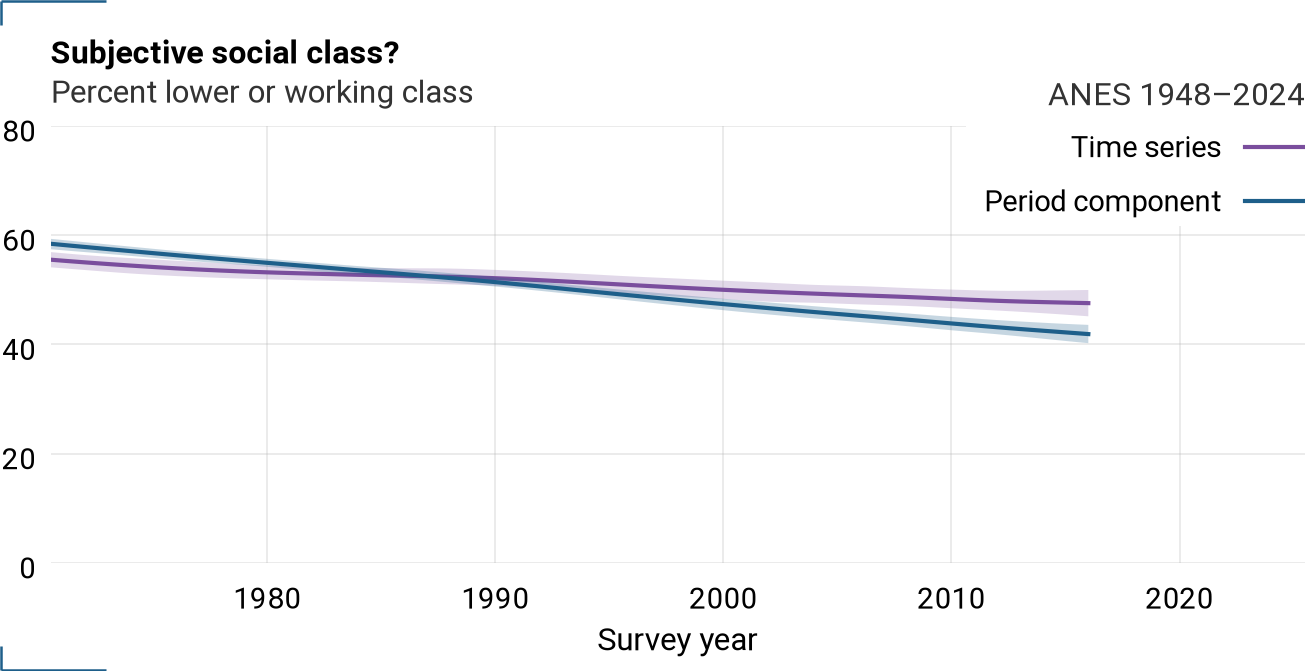
Figure 68:Period component and time series for VCF0148
finrela — Family income vs American families?
Selected (y=1): [1, 2] — Percent saying below or far below average
Question
Compared with American families in general, would you say your family income is far below average, below average, average, above average, or far above average?
Time series
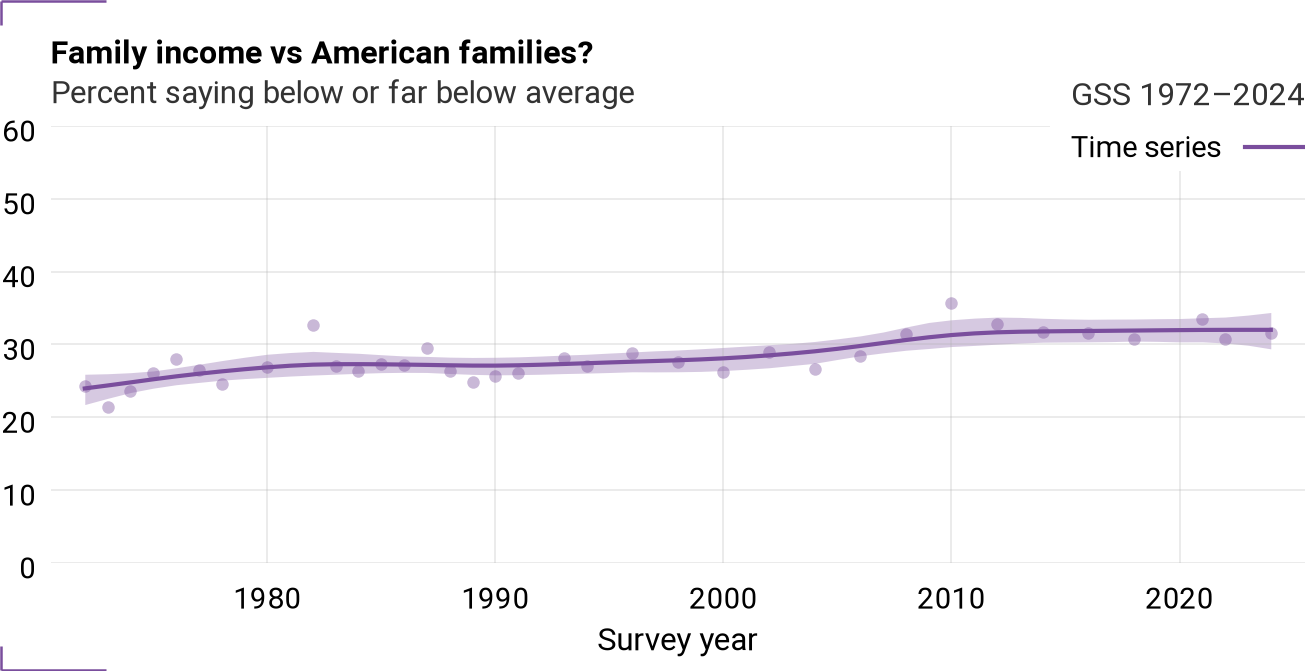
Figure 69:Time series for finrela
Cohort trajectories
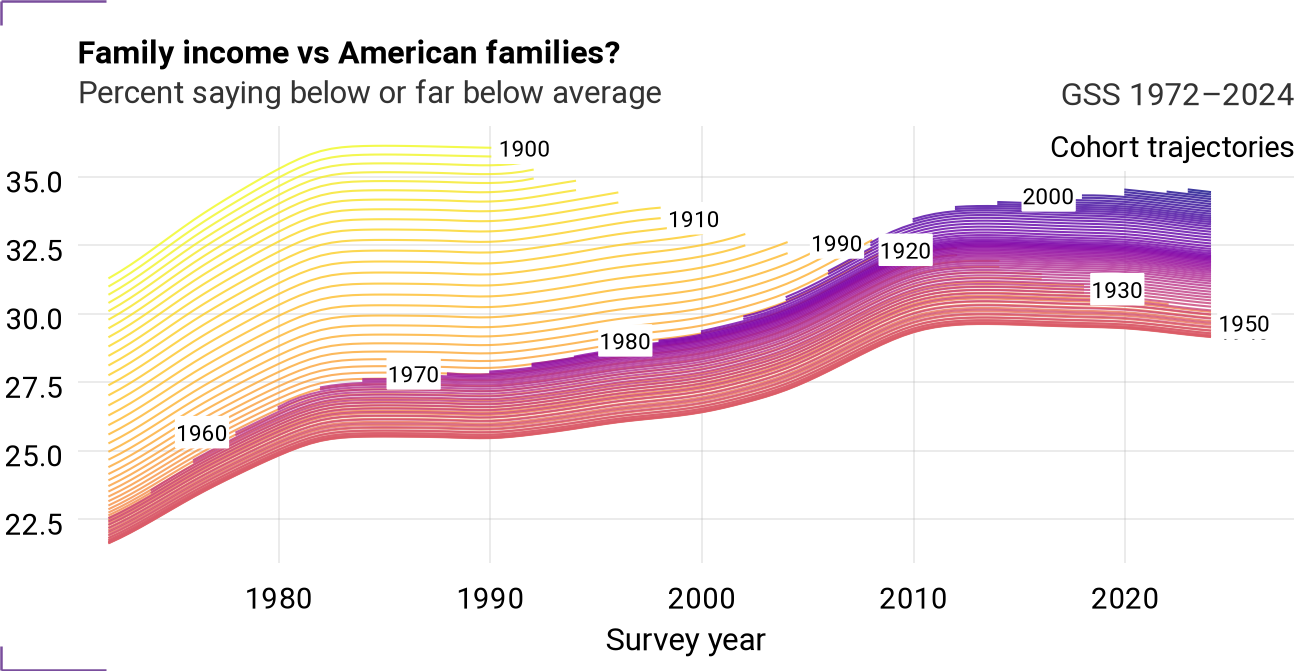
Figure 70:Cohort trajectories for finrela
Cohort component
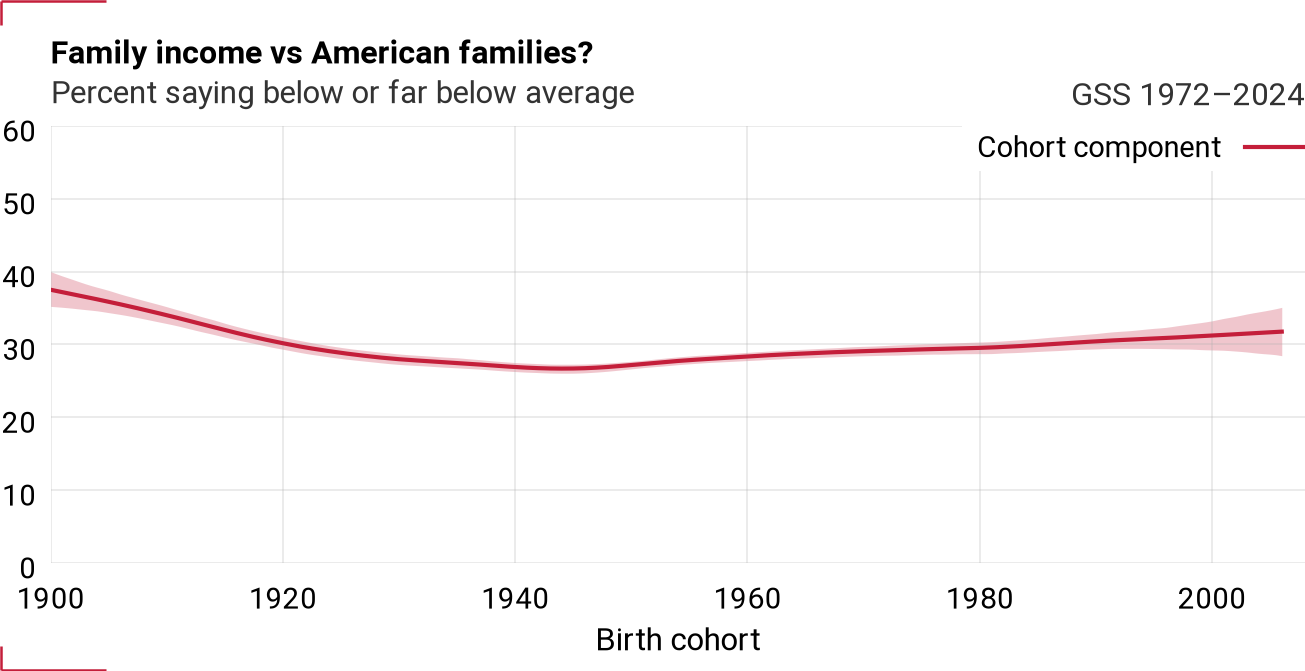
Figure 71:Cohort component for finrela
Period component (with time series)
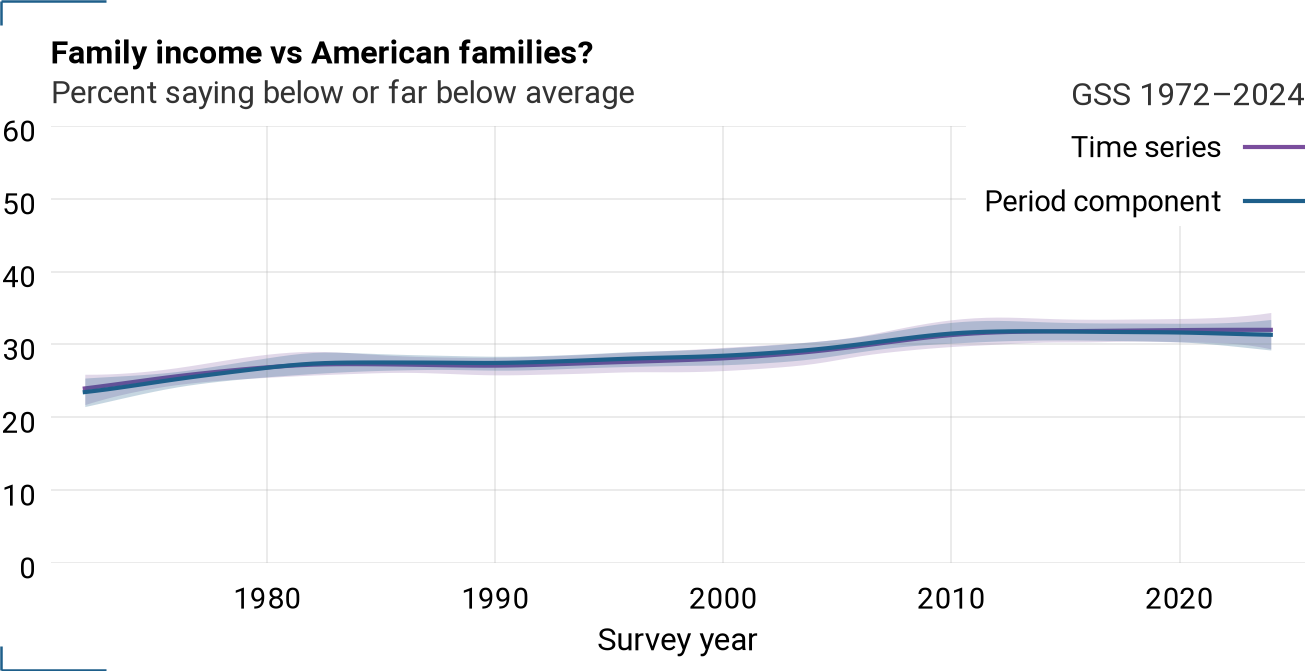
Figure 72:Period component and time series for finrela
satfin — Satisfied with financial situation?
Selected (y=1): [1] — Percent pretty well satisfied
Question
We are interested in how people are getting along financially these days. So far as you and your family are concerned, would you say that you are pretty well satisfied with your present financial situation, more or less satisfied, or not satisfied at all?
Time series
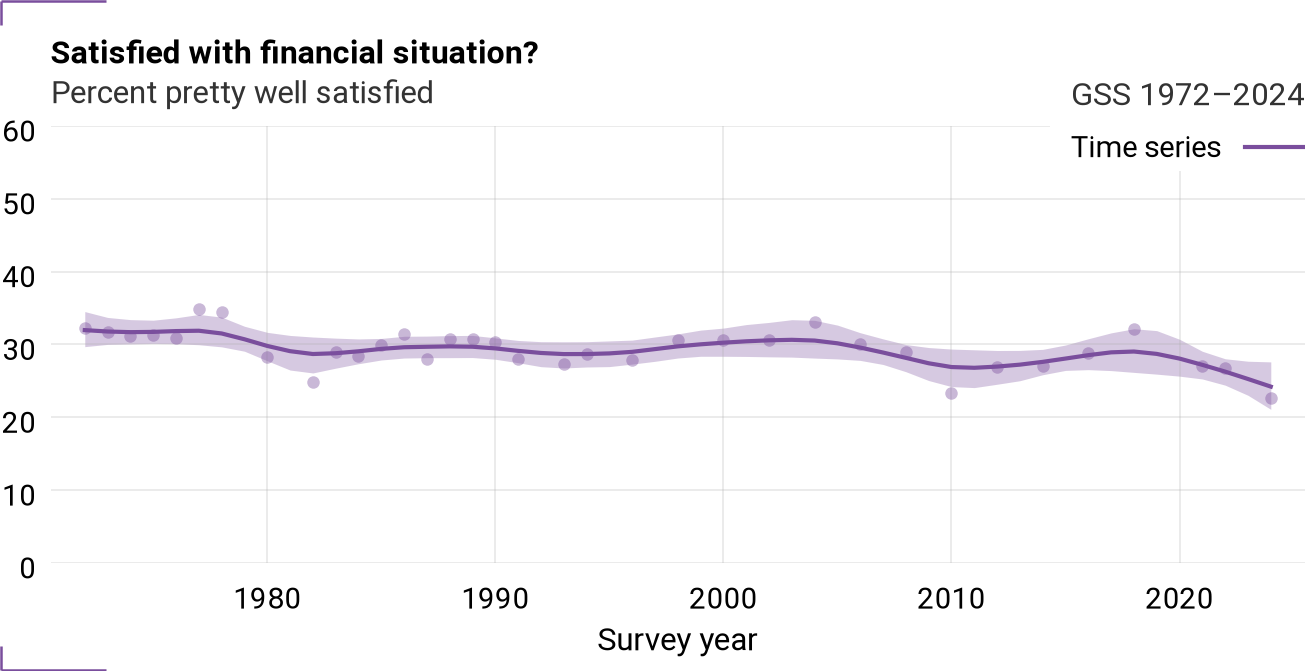
Figure 73:Time series for satfin
Cohort trajectories
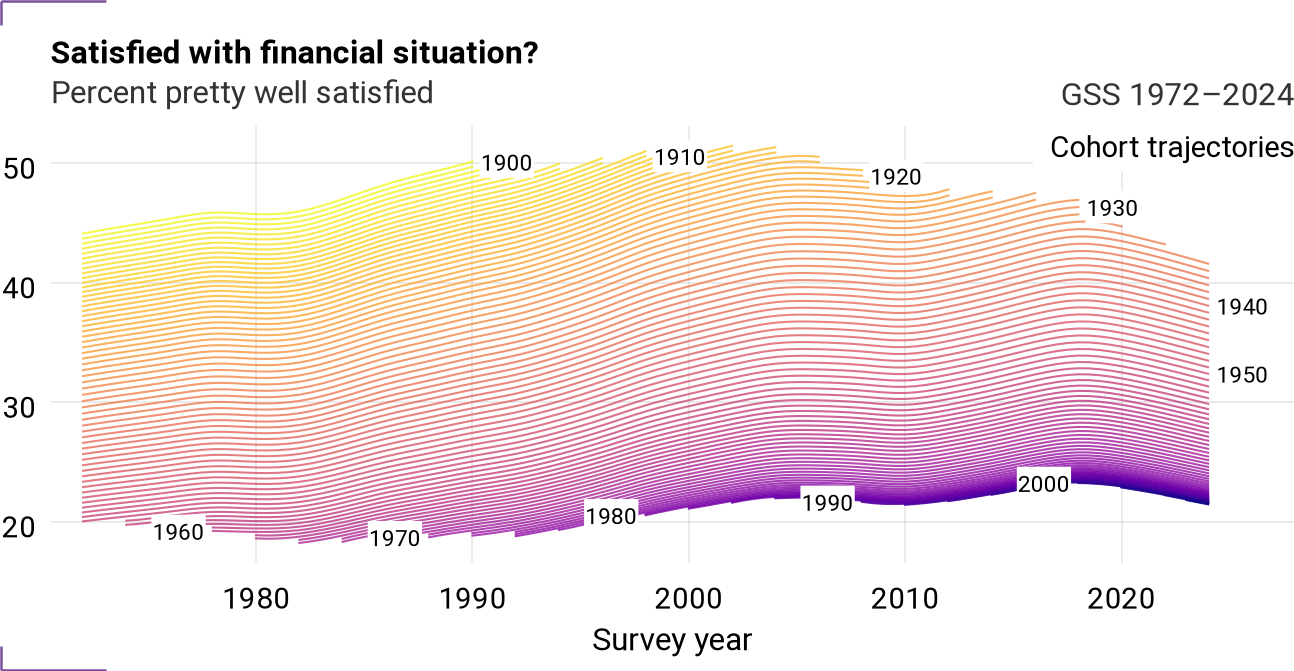
Figure 74:Cohort trajectories for satfin
Cohort component
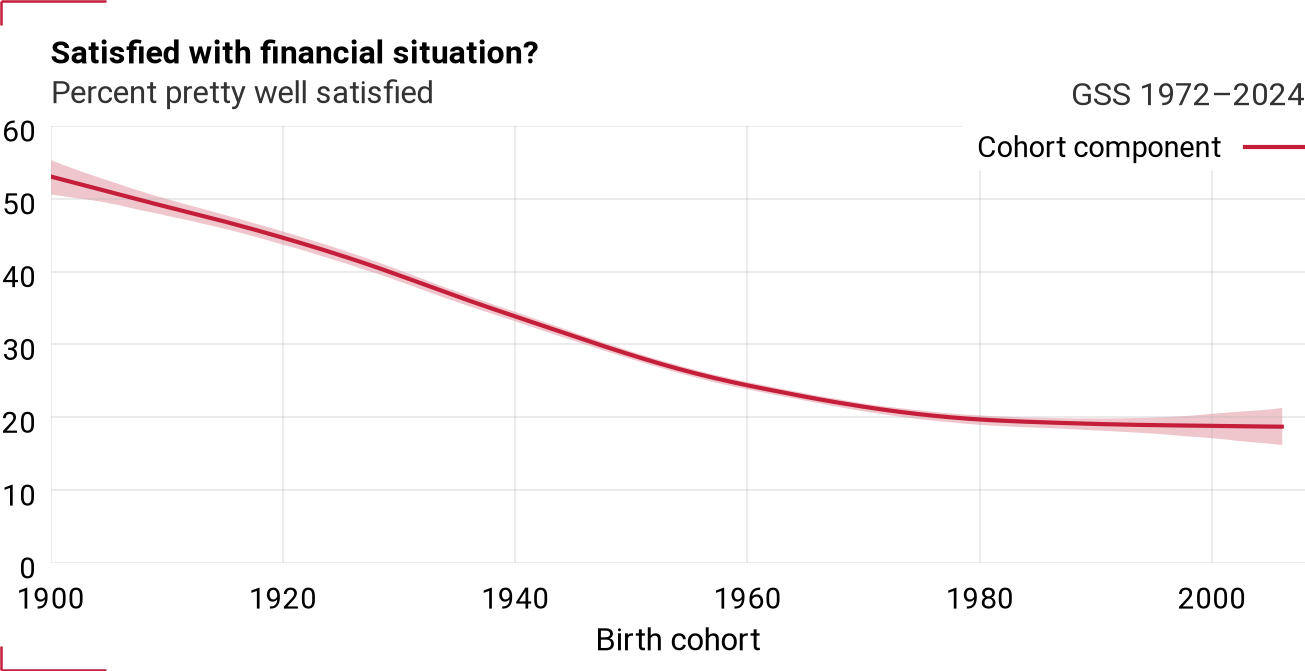
Figure 75:Cohort component for satfin
Period component (with time series)
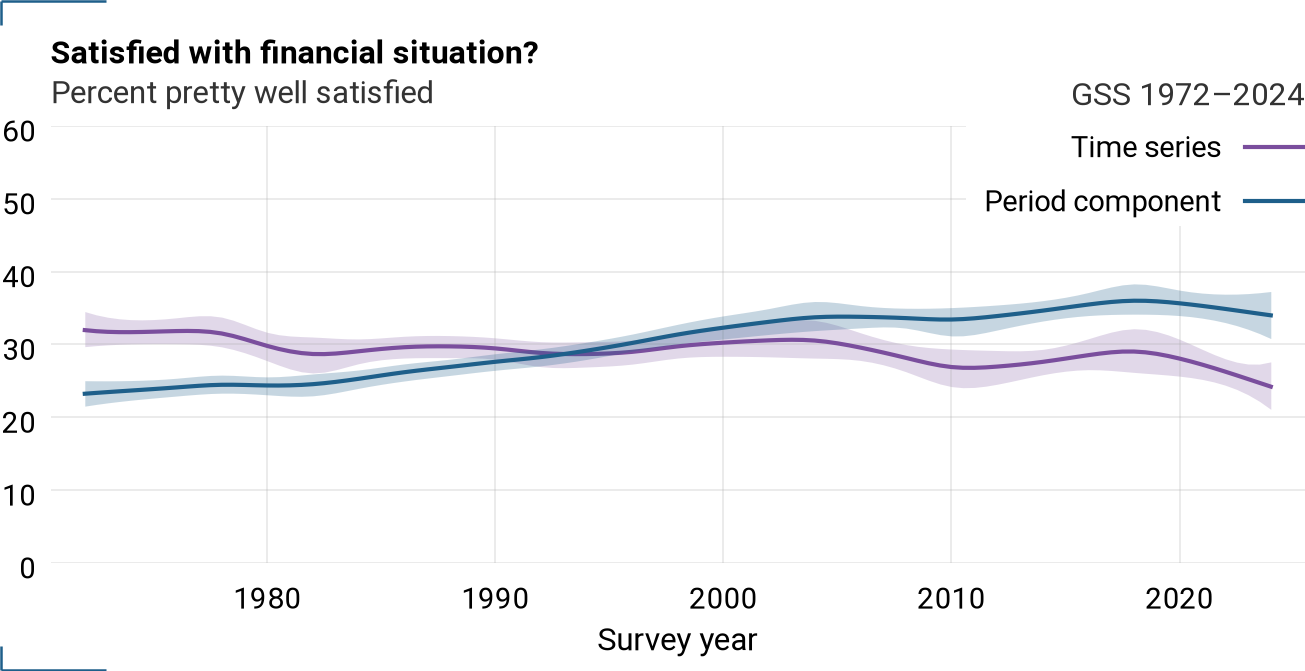
Figure 76:Period component and time series for satfin
dwelown — Own or rent home?
Selected (y=1): [1] — Percent who own or are buying
Question
(Do you/Does your family) own your (home/apartment), pay rent, or what?
Time series
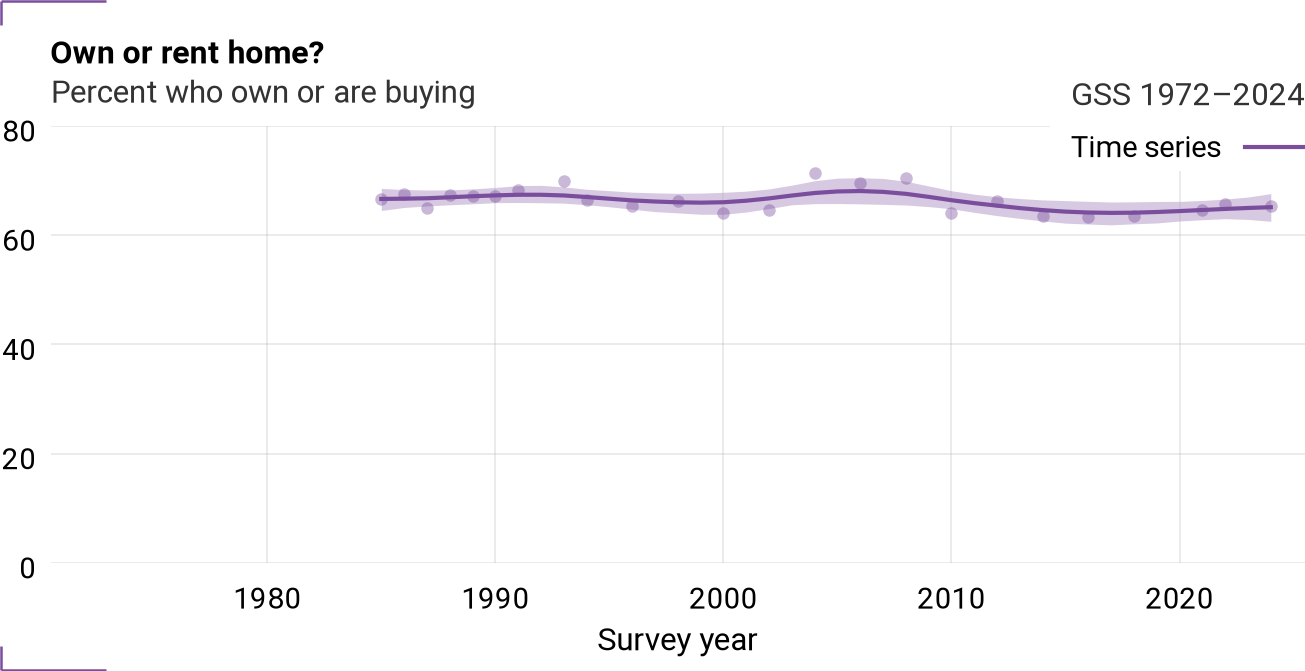
Figure 77:Time series for dwelown
Cohort trajectories
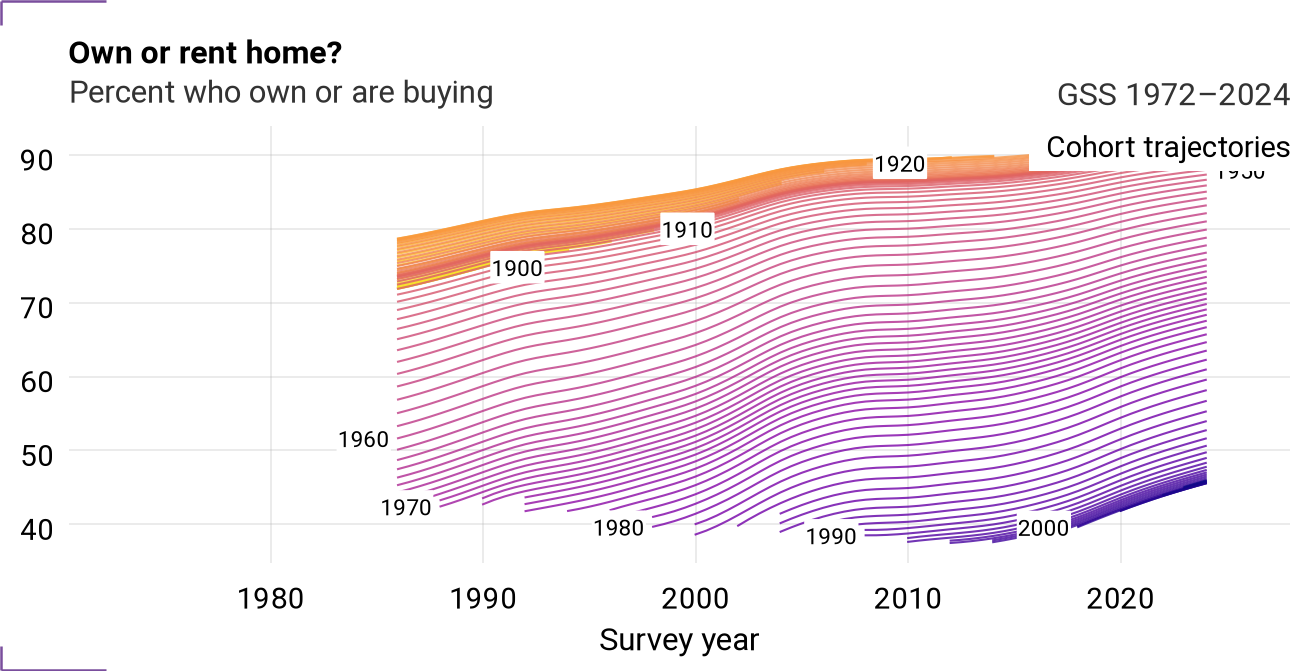
Figure 78:Cohort trajectories for dwelown
Cohort component
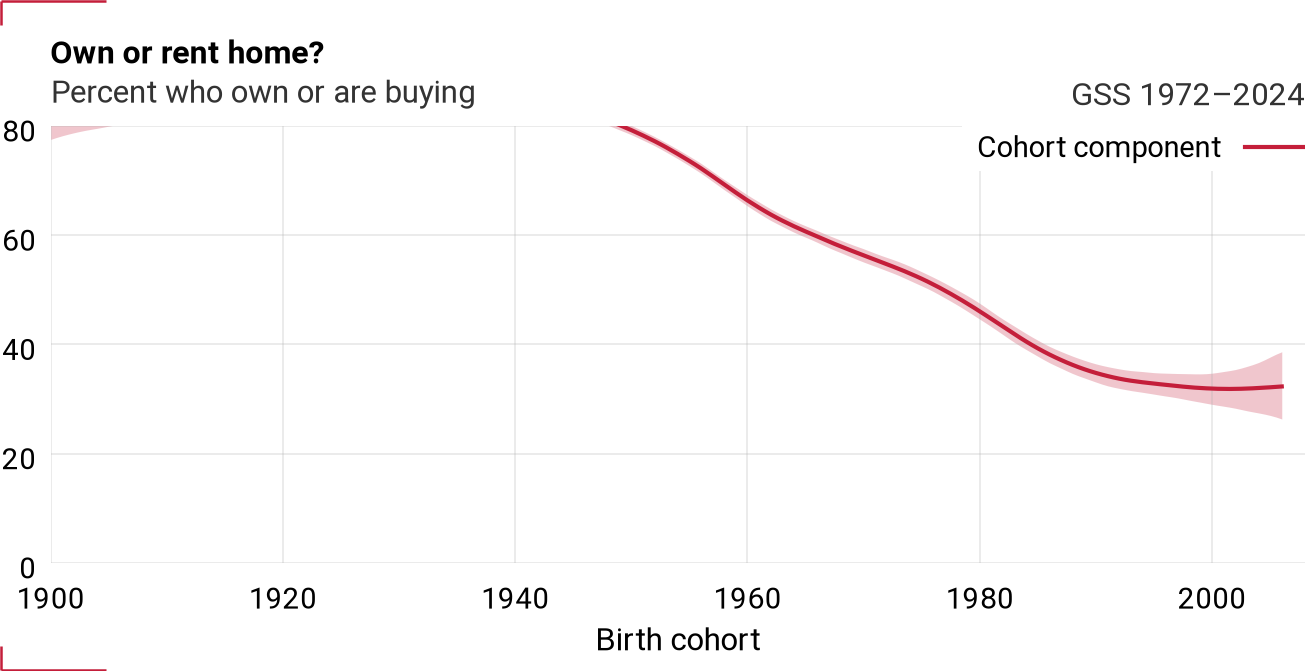
Figure 79:Cohort component for dwelown
Period component (with time series)
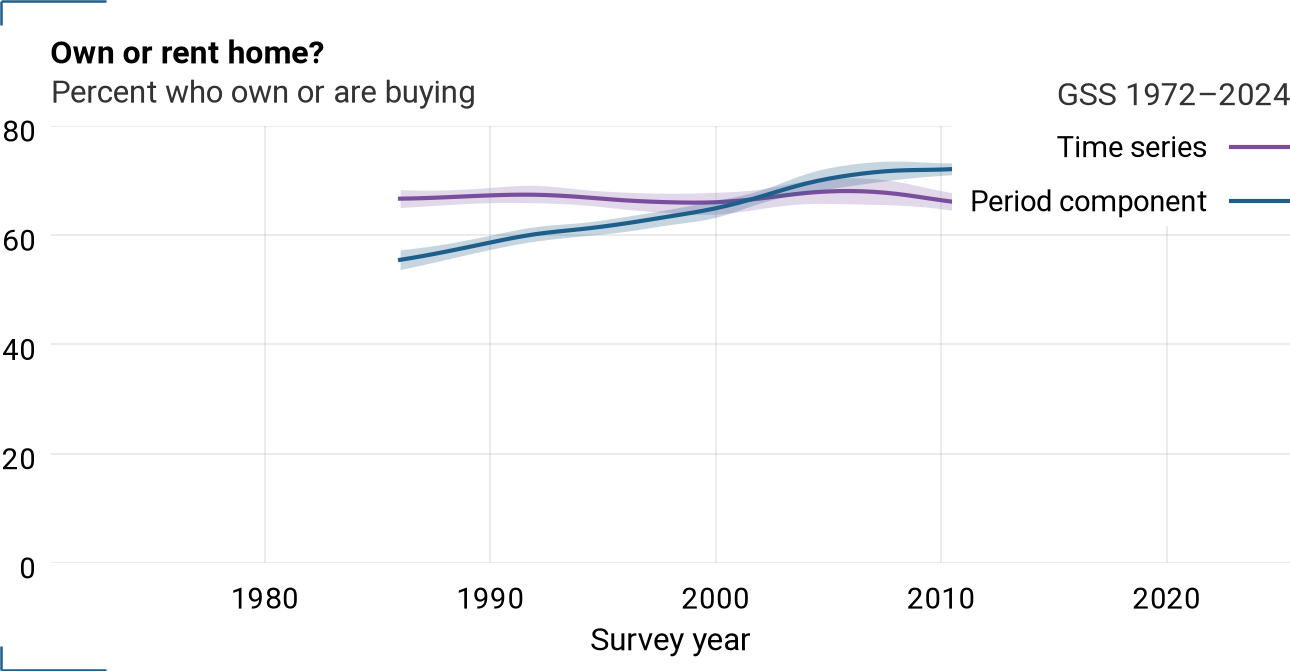
Figure 80:Period component and time series for dwelown