This is work in progress for my book, You Would Choose Now: Measuring America’s Progress Toward Fairness and Tolerance. The completed chapters are available as an Early Access edition on LeanPub.
This post presents new estimates of the religious composition of the United States from the General Social Survey (GSS), 1972–2024, and separates the changes into generational replacement and changes within generations. The technical appendix explains how I classified respondents. Comments and corrections are welcome.
Religious affiliation
The GSS asks:
What is your religious preference? Is it Protestant, Catholic, Jewish, some other religion, or no religion?
The following figure shows the estimated percentage of respondents in four groups. Here, “Protestant” includes respondents who answer “Christian” or “Inter-nondenominational”, and “Other” includes Latter-day Saints, Jehovah’s Witnesses, and other groups that a standard classification puts outside Protestantism (see the appendix).
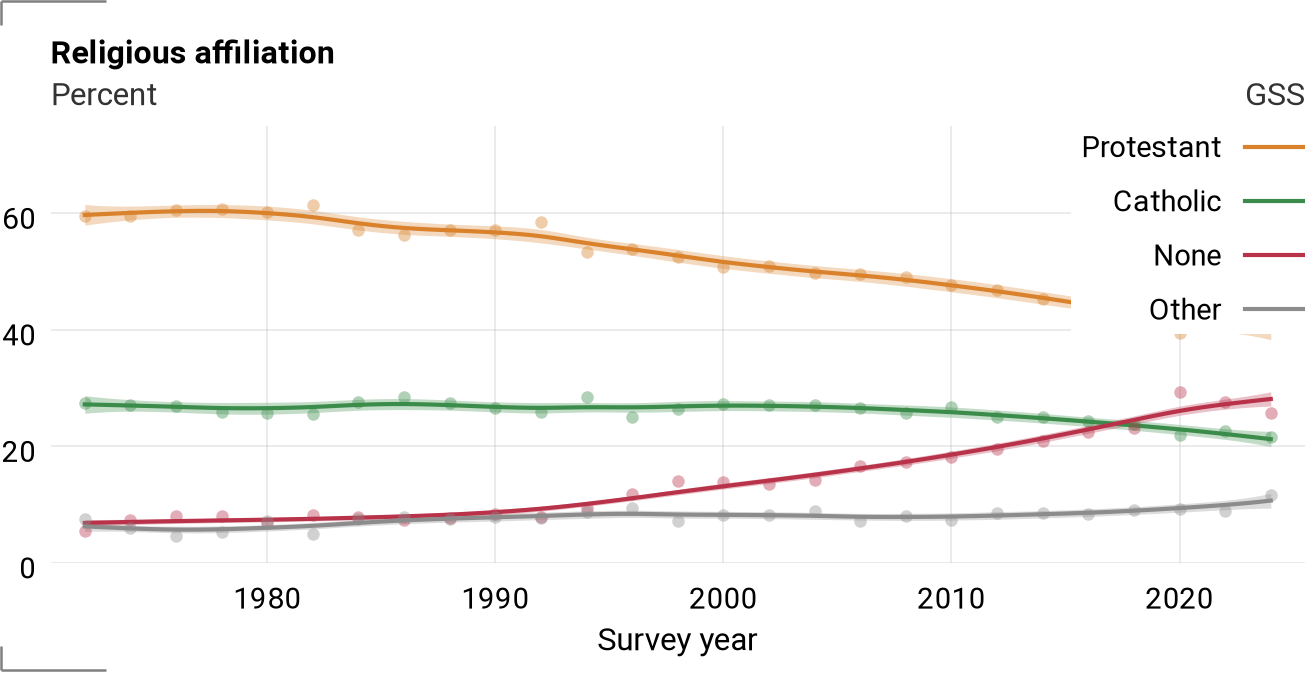
In 1972, 60% of respondents were Protestant; in 2024, 40% were. The percentage with no religion rose from 7% to 28%, passing Catholics around 2017. Catholics declined from 27% to 21%, and other religions grew from 6% to 11%.
Protestant traditions
Protestants are divided into Mainline, Evangelical, Black Protestant, and Nondenominational, following the recommendation of Burge and Djupe (“Falling Through the Cracks”, Review of Religious Research).
The first three are the traditions in the standard classification of Steensland et al. (2000), which groups denominations by history and theology rather than by name -- for example, Southern Baptists are Evangelical and American Baptists are Mainline. Black Protestants are a separate tradition because historically Black churches have a distinct history, and their members differ from white members of nominally similar denominations.
The standard classification has no place for Protestants who say they belong to no denomination or a nondenominational church. It counts those who attend services at least monthly as Evangelical and leaves the rest unclassified -- but as nondenominational churches have grown, the unclassified group has grown with them, to 18% of Protestants in the 2020s. Burge and Djupe found that nondenominational Protestants who attend infrequently fall between Mainline and Evangelical Protestants -- more conservative than United Methodists, more liberal than Southern Baptists -- and recommend treating nondenominational Protestants as a separate group. I follow that recommendation, regardless of attendance, except that Black nondenominational Protestants are grouped with Black Protestants. The technical appendix has the details.
The following figure shows each tradition as a percentage of all respondents, so the four lines add up to the Protestant line in the previous figure (less a small residual group, not shown).
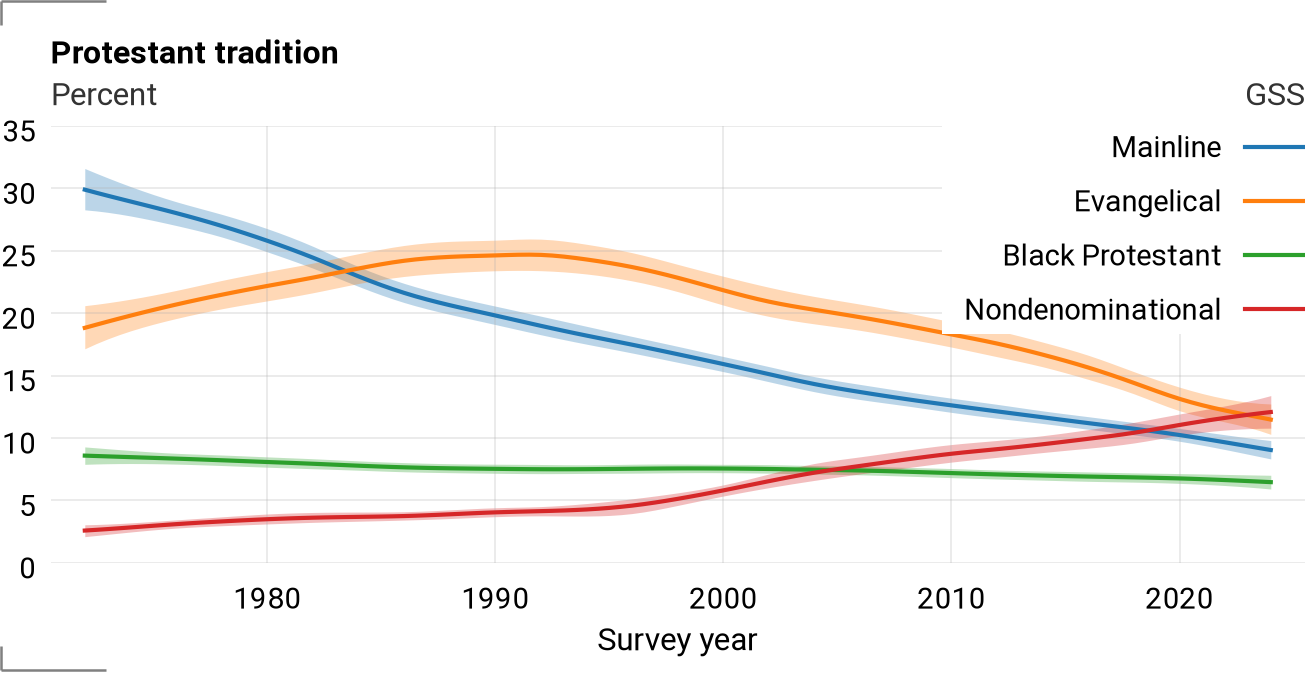
Mainline Protestants were the largest group in 1972, at 30% of respondents; by 2024 they were 9%. Evangelicals grew from 19% to a peak of 25% around 1992, then declined to 12%. Nondenominational Protestants grew from 3% to 12%, passing Mainline Protestants around 2019 and reaching the level of Evangelicals in 2024 -- the uncertainty bands overlap, so the order of those two in the last year is not clear. Black Protestants declined from 9% to 7%.
Smaller religious groups
The GSS can identify several smaller groups, but not all of them over the whole period. Jewish respondents are identified in every year. Latter-day Saints and Jehovah’s Witnesses can be identified from detailed denomination codes from 1972 through 2022; the 2024 public file does not include those codes, so the last segment of their lines is an extrapolation (dashed).
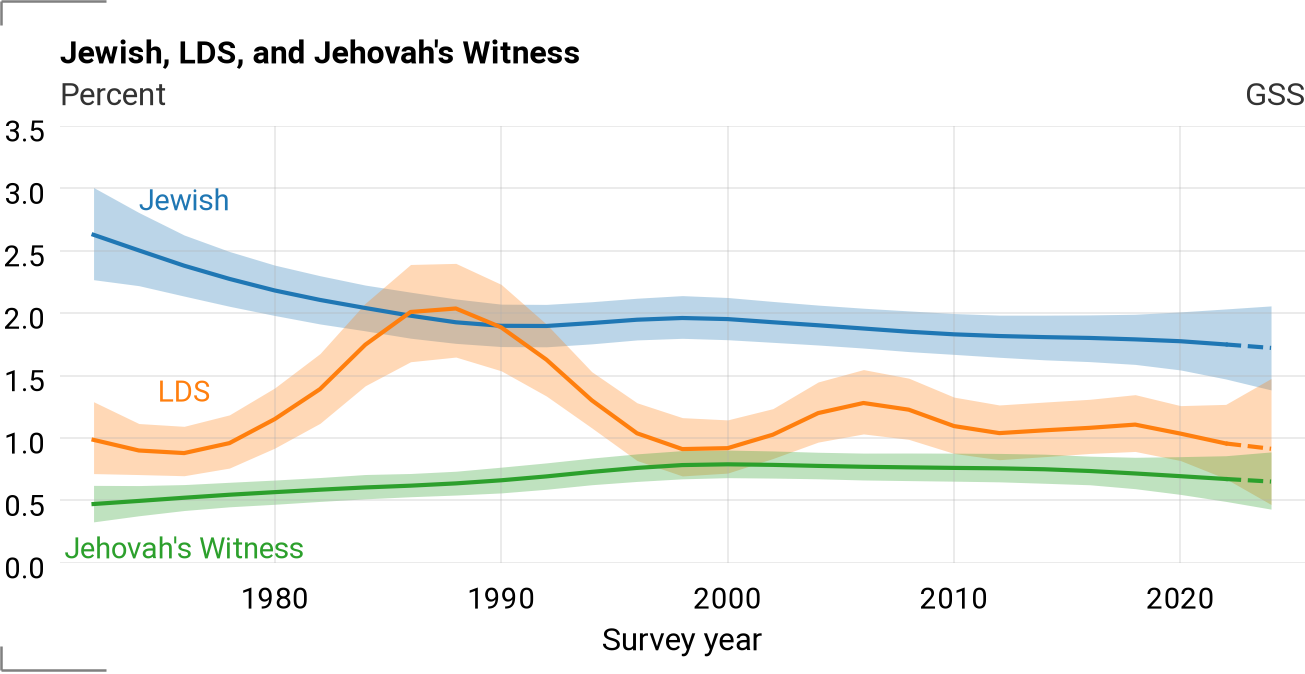
Jewish respondents declined from 2.6% to 1.7%. Latter-day Saints were 1.0% in 1972 and 0.9% in 2024, with a bump to 2% between 1984 and 1993. That bump is almost certainly an artifact of the survey design, not a real change. The GSS samples people in clusters within a set of geographic areas, which is redrawn after each census, and 1984–1993 is the period when the sample was drawn from the 1980 census. Because Latter-day Saints are concentrated in a few Western states, their share depends on which Western areas happen to be in the sample. In those years, the LDS share among respondents in the West more than doubled (from 3.6% to 8.1%) and then fell back (to 2.9%), while outside the West it stayed between 0.4% and 0.5%. Jehovah’s Witnesses were 0.5% in 1972 and 0.7% in 2024.
Starting in 1998, the GSS added codes for Buddhist, Hindu, Muslim, and Orthodox Christian.
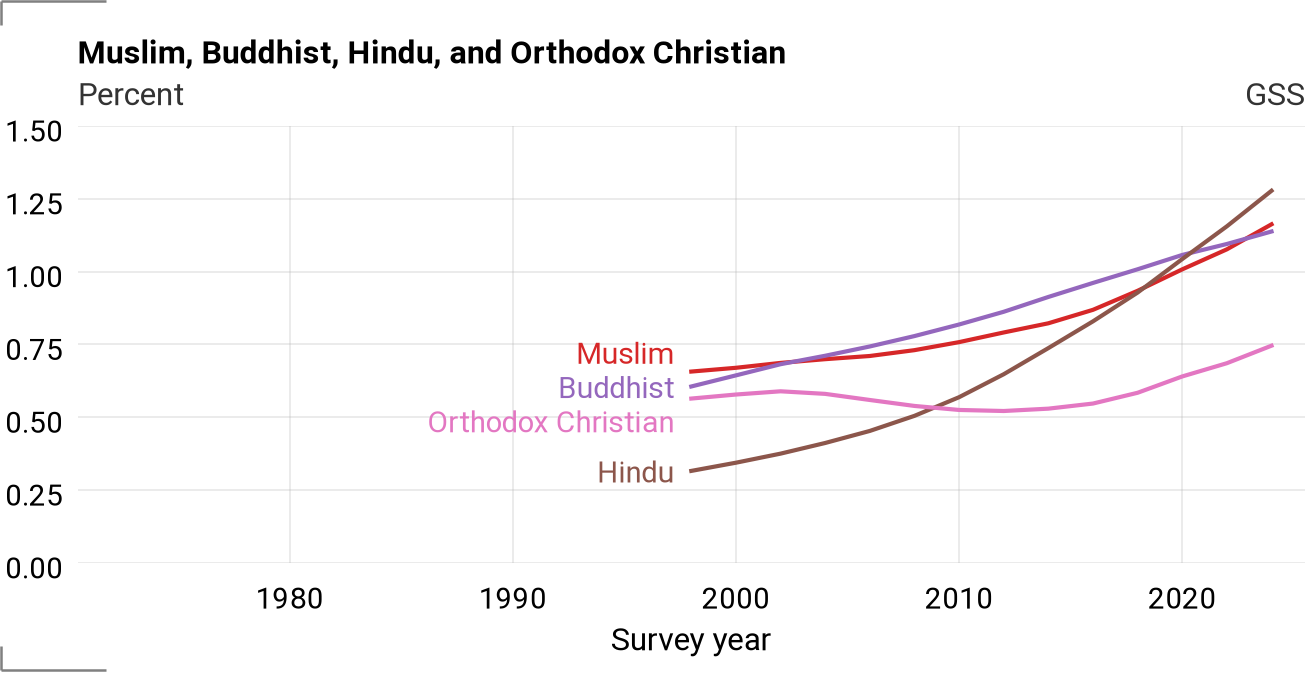
From 1998 to 2024, Hindus grew from 0.3% to 1.3%, Muslims from 0.7% to 1.2%, Buddhists from 0.6% to 1.1%, and Orthodox Christians from 0.6% to 0.8%. These groups are small in the sample -- 20 to 45 respondents per survey year recently, and as few as 4 to 10 in the early years -- so these estimates are less precise than the others. I omitted the error bounds from the figure because they make it hard to read.
Generational replacement and changes within generations
Changes in religious composition can come from two sources:
Generational replacement: older generations are replaced by younger generations with different affiliations.
Changes within generations: the composition of each birth cohort changes over time. Some of this comes from people switching affiliation, but much of it is demographic -- especially immigration, which adds people to each cohort, and differences in mortality between groups.
With a repeated cross-sectional survey like the GSS, we can use a statistical model to separate the two. The model estimates a cohort component, which is the tendency of each birth cohort to belong to a group, and a period component, which is the tendency at each point in time, after controlling for generational replacement. I fit a separate model for each group; the appendix has details.
Cohort components
The following figure shows the cohort component for each of the four affiliation groups. In these figures, the levels depend on the reference period the model averages over, so the shapes are what matter: where each line rises or falls, and how steeply.
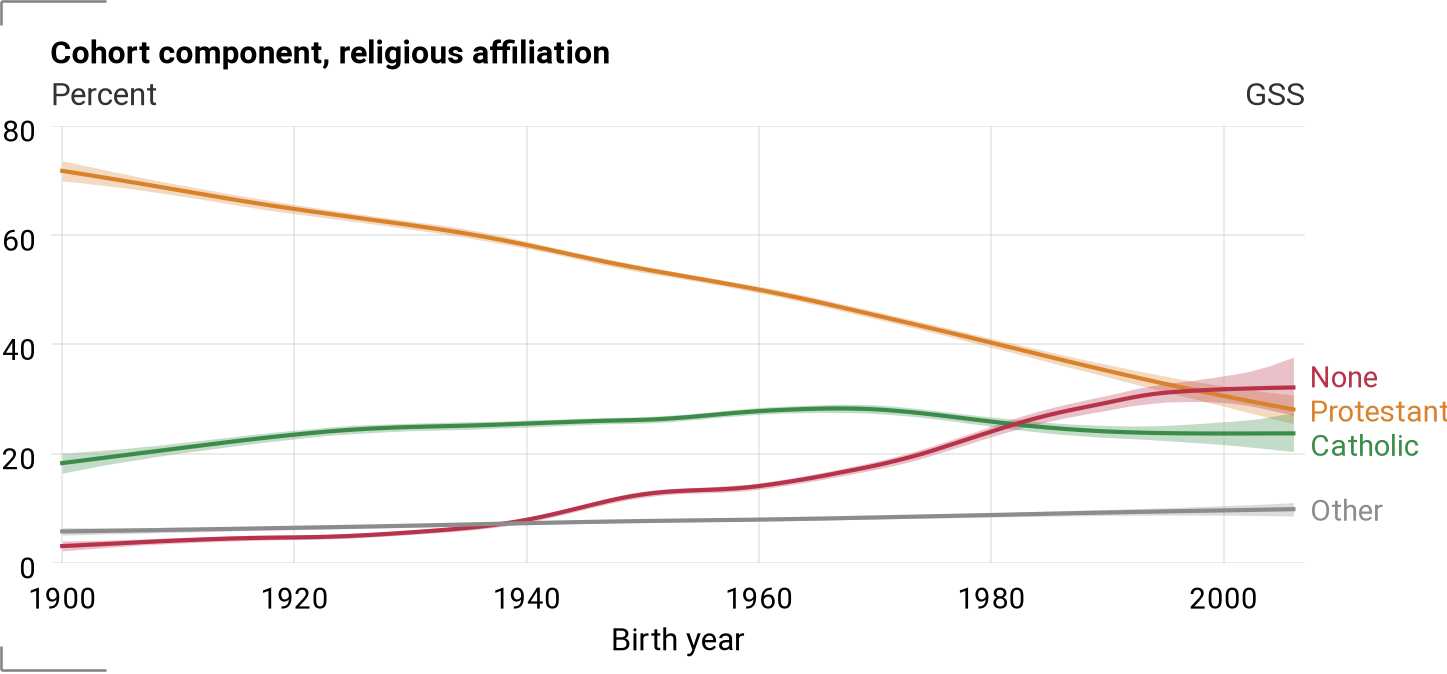
The Protestant cohort component declines across all cohorts, and the decline accelerates: about 3.5 percentage points per decade of birth year for cohorts born before 1940, 5 points per decade for cohorts born in the 1970s and 1980s, and 7 points for cohorts born after 1990. The cohort component for no religion is flat for cohorts born before 1930. It rises for cohorts born in the 1940s, pauses for the 1950s, and rises most steeply for cohorts born between 1960 and 1990, then levels off. The Catholic cohort component rises for cohorts born before 1930, is nearly flat for cohorts born between 1930 and 1970, and declines for cohorts born in the 1970s and 1980s. Other religions rise slowly and steadily.
Here are the cohort components for the Protestant traditions.
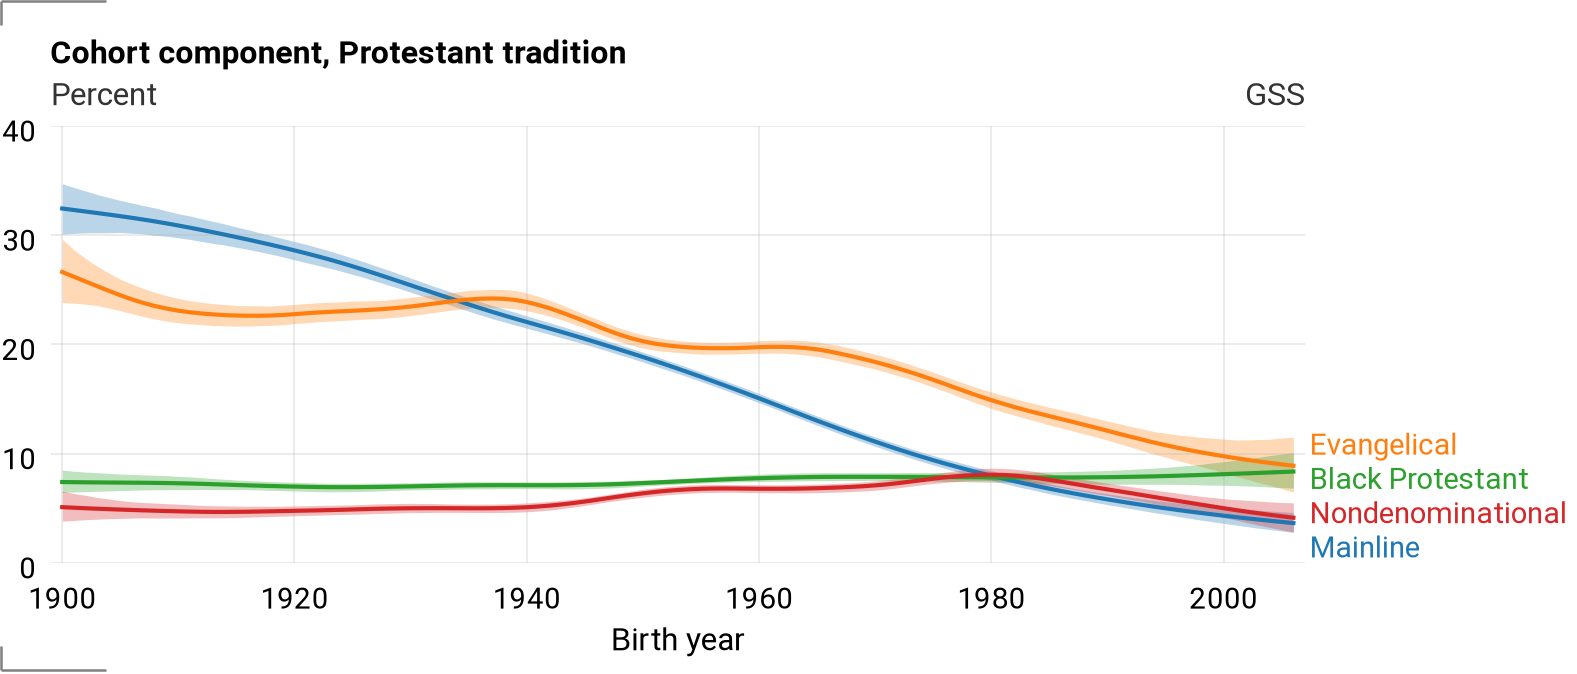
The Mainline cohort component declines across all cohorts, most steeply for cohorts born between 1950 and 1970. The Evangelical cohort component is nearly flat for cohorts born between 1910 and 1940, drops for cohorts born in the 1940s, and declines steadily for cohorts born after 1970. The Black Protestant cohort component is nearly flat. The Nondenominational cohort component changes little: it rises slightly for cohorts born in the 1940s and 1970s and declines for cohorts born after 1980.
Period components
The following figure shows the period components for the affiliation groups.
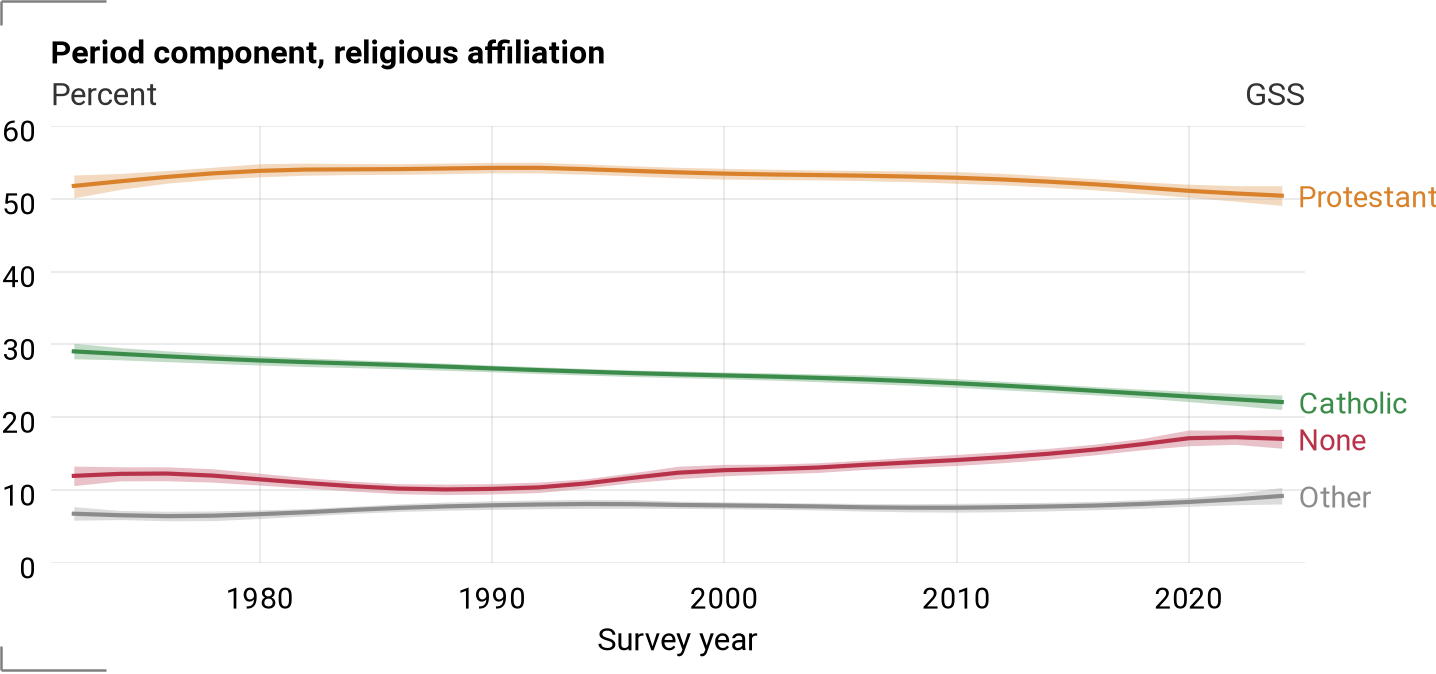
The Protestant period component rises slightly in the 1970s and declines slowly after 1990, most steeply between 2010 and 2020. The Catholic period component declines steadily over the whole period, a little faster between 2010 and 2020. The period component for no religion is flat until 1990, rises in the 1990s and again between 2010 and 2020, and is flat since 2020. Other religions rise in the 1980s and again after 2010.
And here are the period components for the Protestant traditions.
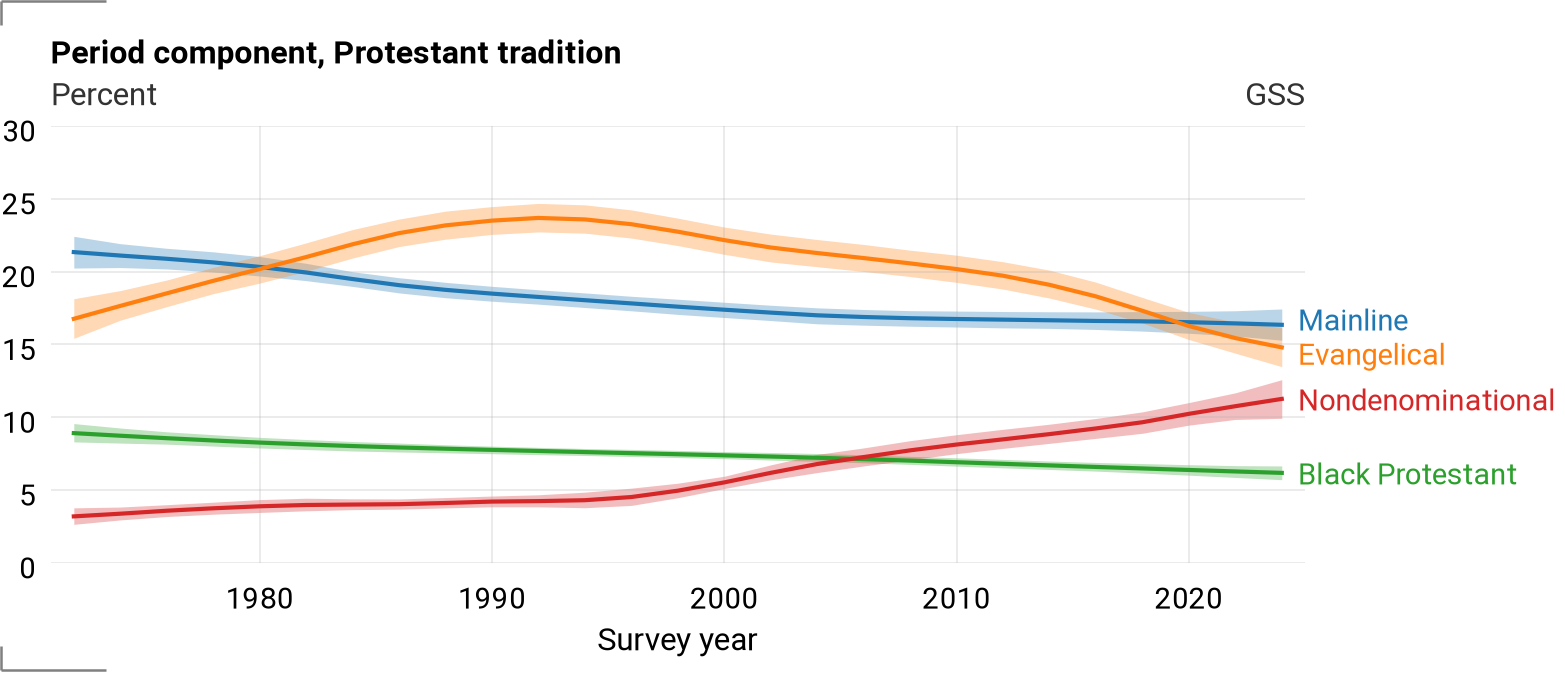
The Nondenominational period component rises over the whole period, most steeply between 2000 and 2020. The Evangelical period component rises until about 1992, then declines, most steeply between 2010 and 2020. The Mainline period component declines most steeply in the 1980s and is nearly flat since 2010. The Black Protestant period component declines slowly and steadily.
Decomposition
Combining the two components, we can estimate how much of the change between 1972 and 2024 is due to generational replacement and how much to changes within generations. The following table shows the estimated change for each group in percentage points, split between the two.
| Group | 1972 | 2024 | Change | Generational replacement | Within generations |
|---|---|---|---|---|---|
| Protestant | 60.4 | 40.8 | −19.6 | −18.3 | −1.3 |
| Catholic | 27.1 | 22.2 | −4.9 | +1.9 | −6.8 |
| Other religion | 6.0 | 10.2 | +4.2 | +1.8 | +2.4 |
| No religion | 6.2 | 26.8 | +20.6 | +15.4 | +5.2 |
| Evangelical | 19.1 | 11.8 | −7.3 | −5.4 | −1.9 |
| Mainline | 29.5 | 9.9 | −19.6 | −14.7 | −4.9 |
| Black Protestant | 8.5 | 6.4 | −2.1 | +0.6 | −2.7 |
| Nondenominational | 2.7 | 12.1 | +9.4 | +1.7 | +7.8 |
The 1972 and 2024 values in this table come from the decomposition model, so they differ slightly from the figures above, which come from a model of the composition as a whole.
The decline of Protestants is almost entirely generational replacement: each cohort is less Protestant than the one before, but within cohorts there is little change. The rise of the religiously unaffiliated is three-quarters generational replacement and one-quarter change within generations.
The Catholic decline is the opposite case: it is entirely due to changes within cohorts, and generational replacement would have increased the Catholic share slightly. The same is true of Black Protestants.
Among Protestant traditions, the declines of Mainline and Evangelical Protestants are three-quarters generational replacement. The growth of Nondenominational Protestants is mostly change within generations: the Nondenominational share grew within every cohort, and the cohort component contributes little.
Technical appendix
Data and weights
The data are from the GSS cumulative file, 1972–2024 (release 3a), weighted with WTSSPS, the post-stratification weight NORC back-cast to 1972.
Unlike the older WTSSALL, WTSSPS corrects for the oversamples of Black respondents in 1982 and 1987.
Religious affiliation
Affiliation starts from RELIG:
Protestant:
RELIG= 1 (Protestant), 11 (Christian), or 13 (Inter-nondenominational). Codes 11 and 13 were added in 1998.Catholic:
RELIG= 2.None:
RELIG= 4.Other: all other codes (Jewish, Buddhist, Hindu, Muslim, Orthodox Christian, other Eastern, Native American, other).
One adjustment: respondents whose RELIG is Protestant but whom the GSS-supplied RELTRAD classifies as “other faith” (mostly Latter-day Saints, Jehovah’s Witnesses, Unitarian Universalists, and Christian Scientists) are moved to Other; the rare respondents RELTRAD classifies as Catholic or Jewish are moved accordingly.
This affects 1,809 respondents.
Protestant traditions
Among Protestants, as defined above, I use the GSS-supplied RELTRAD (Steensland et al. 2000) with one change:
Nondenominational:
DENOM= 7 (“no denomination or non-denominational church”), orRELIG= 11 or 13 with noDENOMresponse, regardless of attendance. Black respondents in this group are classified as Black Protestant.Otherwise,
RELTRAD= 1 is Evangelical, 2 is Mainline, and 3 is Black Protestant.The remaining Protestants, 0.5–2% of Protestants, have no usable denomination response or a denomination code
RELTRADdoes not classify; they are a residual category, modeled but not shown.
Notes on these choices:
In the current cumulative file,
DENOMis a coarse seven-category variable; the detailed codes used by older RELTRAD syntax are inDENOM_7222, which is not available in the 2024 public file. For 1972–2022,DENOM= 7 matchesDENOM_7222= 70 exactly (5,003 respondents), so the coarse variable identifies nondenominational Protestants consistently, including 2024.RELTRADclassifies nondenominational Protestants who attend monthly or more as Evangelical and leaves the rest unclassified. That unclassified group grew to 8% of all respondents by 2022 -- 18% of Protestants in the 2020s -- which is the main reason for the separate category. This follows the recommendation of Burge and Djupe (“Falling Through the Cracks”, Review of Religious Research).Black nondenominational Protestants are grouped with Black Protestants following Gaghan and Eagle’s RELTRAD2 and Shelton (2026).
The GSS documentation notes that
RELTRADdoes not classifyOTHERcodes above 148. That affects only 80 respondents (1998–2022), too few to change any of these estimates.
Smaller groups
1972–2024: Jewish (
RELIG= 3); Latter-day Saints (OTHER= 59, 60, 61, 62, 64, 162) and Jehovah’s Witnesses (OTHER= 58), among Protestant-identified respondents thatRELTRADclassifies as other faith. Because the 2024 public file has noOTHERcodes, this model is fit to 1972–2022 and extrapolated one period.1998–2024: Muslim (
RELIG= 9), Buddhist (6), Hindu (7), and Orthodox Christian (10).
Models
The composition figures come from a multinomial model: the log-odds of each category relative to a reference category follow a second-order random walk over survey years, with additional year-to-year variation. The observed counts in each year are weighted counts with Kish effective sample sizes.
The cohort and period components come from a separate binomial model for each category (for example, Catholic or not). The log-odds of belonging to the category is the sum of an intercept, a cohort effect, and a period effect, each a second-order random walk, plus year-to-year variation. The cohort component averages each cohort’s estimated probability over survey years; the period component averages each year’s estimated probability over a fixed mix of cohorts.
To decompose the change from 1972 to 2024, I compute two counterfactuals: one that holds the cohort mix at its 1972 value and lets period effects change, and one that holds period effects at their 1972 values and lets the cohort mix change. These give two estimates of each part that differ by an interaction term; the table reports the average of the two orderings, so the parts add up to the total. Because each category is fit separately, the categories are not constrained to sum to 100%.