This post is based on material from my book-in-progress, You Would Choose Now: Measuring America’s Progress Toward Fairness and Tolerance. It’s a data-driven exploration of progress (or not) in public opinion and civil rights. The completed chapters are available as an Early Access edition on LeanPub.
The most vocal, and possibly most effective, opponent of the ERA was Phyllis Schlafly.
The Equal Rights Amendment passed Congress in March 1972, by votes of 84 to 8 in the Senate and 354 to 24 in the House. To become part of the Constitution, it had to be ratified by 38 states, and at first it looked like that would happen quickly: 22 states ratified it in 1972, and 8 more in 1973.
In 1972, Schlafly founded STOP ERA, where “STOP” stood for “Stop Taking Our Privileges”. In the February 1972 issue of her newsletter, The Phyllis Schlafly Report, she explained what privileges she meant:
Of all the classes of people who ever lived, the American woman is the most privileged. We have the most rights and rewards, and the fewest duties.
She argued that the ERA “would deprive the American woman of many of the fundamental special privileges we now enjoy, and especially the greatest rights of all: (1) NOT to take a job, (2) to keep her baby, and (3) to be supported by her husband.” And she warned that it would “absolutely and positively make women subject to the draft” and “abolish a woman’s right to child support and alimony”. As the campaign went on, opponents added that the ERA would lead to unisex bathrooms, put women in combat, and force women into the workforce.
After 1973, ratification slowed: 3 states in 1974, 1 in 1975, and 1 in 1977, for a total of 35 — three short. Five states voted to rescind their ratifications. Congress extended the deadline to 1982, but no more states ratified, according to the Congressional Research Service.
Who were the opponents? According to a 1982 study of activists on both sides, “Unlike previous periods in American history when women’s rights were at stake, the main activists in this issue have been women.”
A survey of anti-ERA women at a 1975 hearing in the Texas legislature, as reported in that study, found that only 27% were employed and 16% had graduated from college.
Among the public, opinions about the ERA were less divided. In a 1975 Gallup poll, 63% of men and 54% of women were in favor — but among women over 50, only 46% were.
The General Social Survey (GSS) asked about the ERA in 1977 and 1982:
Have you heard or read about the Equal Rights Amendment? Do you strongly favor, somewhat favor, somewhat oppose, or strongly oppose this amendment?
Among people who had heard of it, 72% of women and 71% of men were in favor in 1977; in 1982, it was 73% of women and 70% of men. The following figure shows the cohort component — that is, the estimated percentage in favor for each generation, after accounting for changes over time.
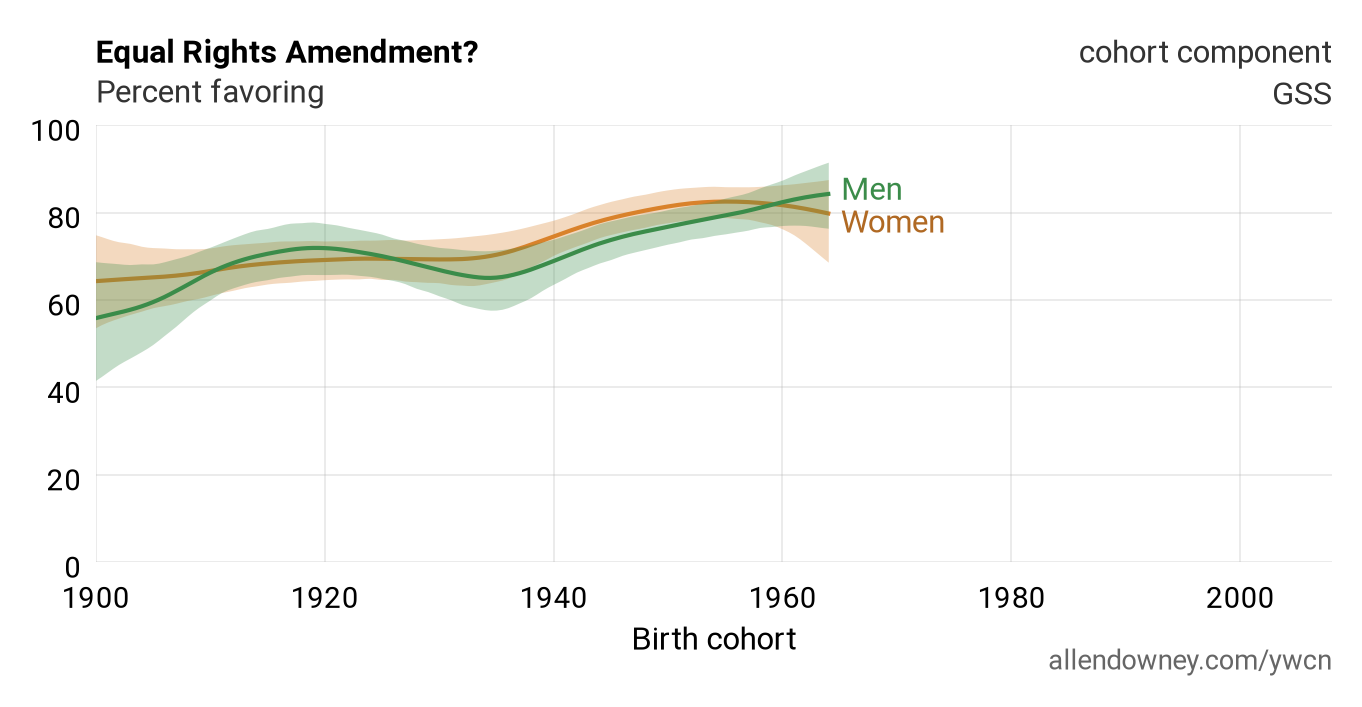
Among people born around 1900, 64% of women and 56% of men were in favor; among people born in the 1960s, it was 80% of women and 84% of men. But the intervals for women and men overlap in every generation, so these data don’t show a clear difference between them.
So the most active opponents of the ERA were women, but among the public, women and men of the same generation had similar views about the ERA itself. As we’ll see, that’s not true of several other questions about women’s roles: in the oldest generations, women were more traditional than men.
A woman’s place
Starting in 1972, the American National Election Studies (ANES) asked:
Recently there has been a lot of talk about women’s rights. Some people feel that women should have an equal role with men in running business, industry and government. Others feel that a women’s place is in the home. Where would you place yourself on this scale?
The scale goes from 1, an equal role, to 7, a woman’s place is in the home. The following figure shows the percentage of women and men who chose 1 or 2.
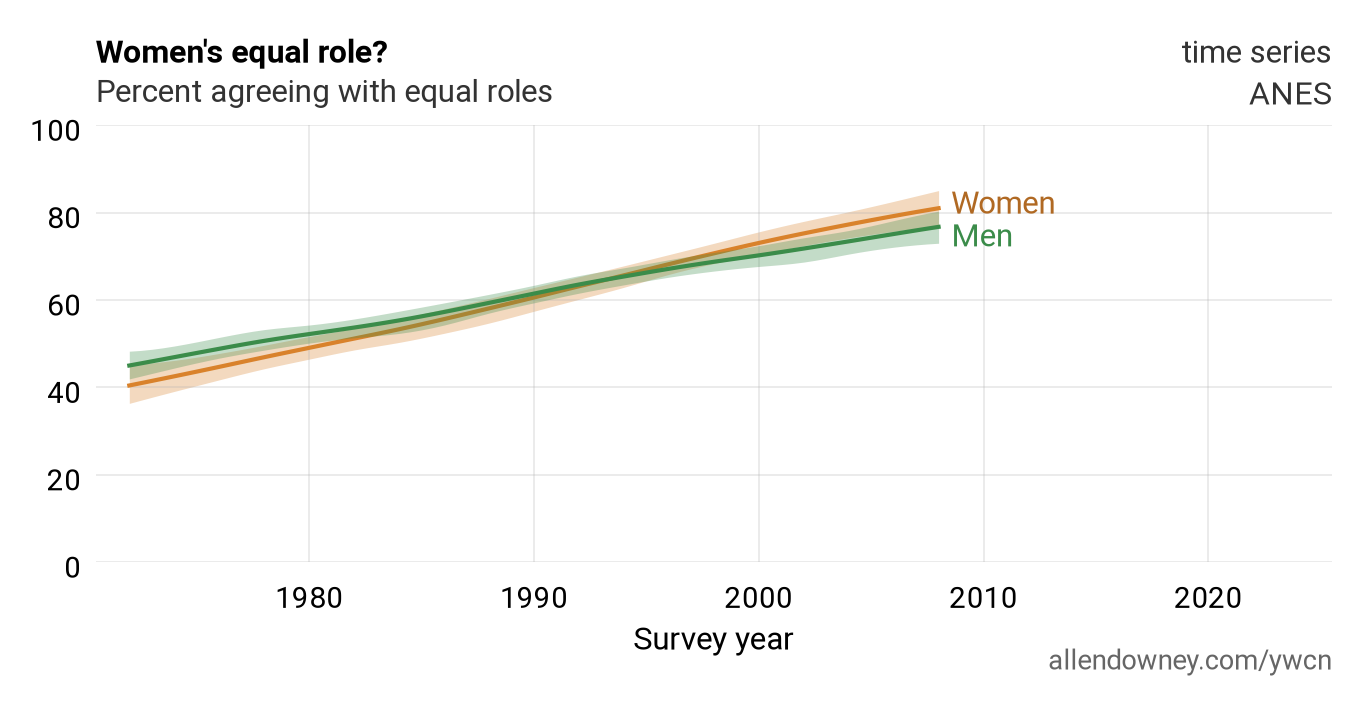
In 1972, 40% of women and 45% of men chose the equal-role end of the scale. The lines cross around 1993. In 2008, the last time the question was asked, it was 81% of women and 77% of men.
So in the 1970s and 1980s, women were less likely than men to choose an equal role. To see where that difference comes from, we can look at the cohort component, which shows how each generation answered, on average, after accounting for changes over time.
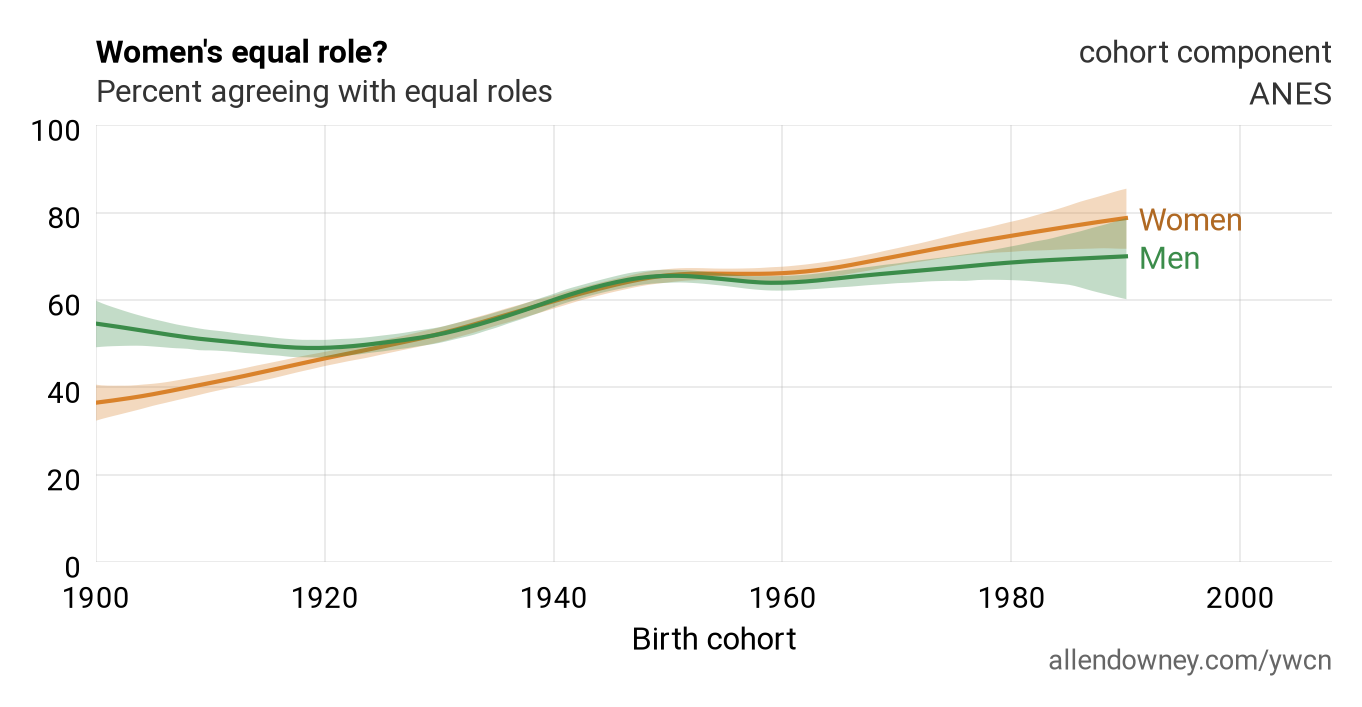
Among people born in 1900, 37% of women chose an equal role, compared with 55% of men. The lines meet around the 1930 birth cohort and stay close through the 1950s. Among people born in 1990, it was 79% of women and 70% of men.
The GSS asked a more pointed question from 1974 to 1998:
Do you agree or disagree: Women should take care of running their homes and leave running the country up to men.
The following figure shows the percentage of women and men who agreed.
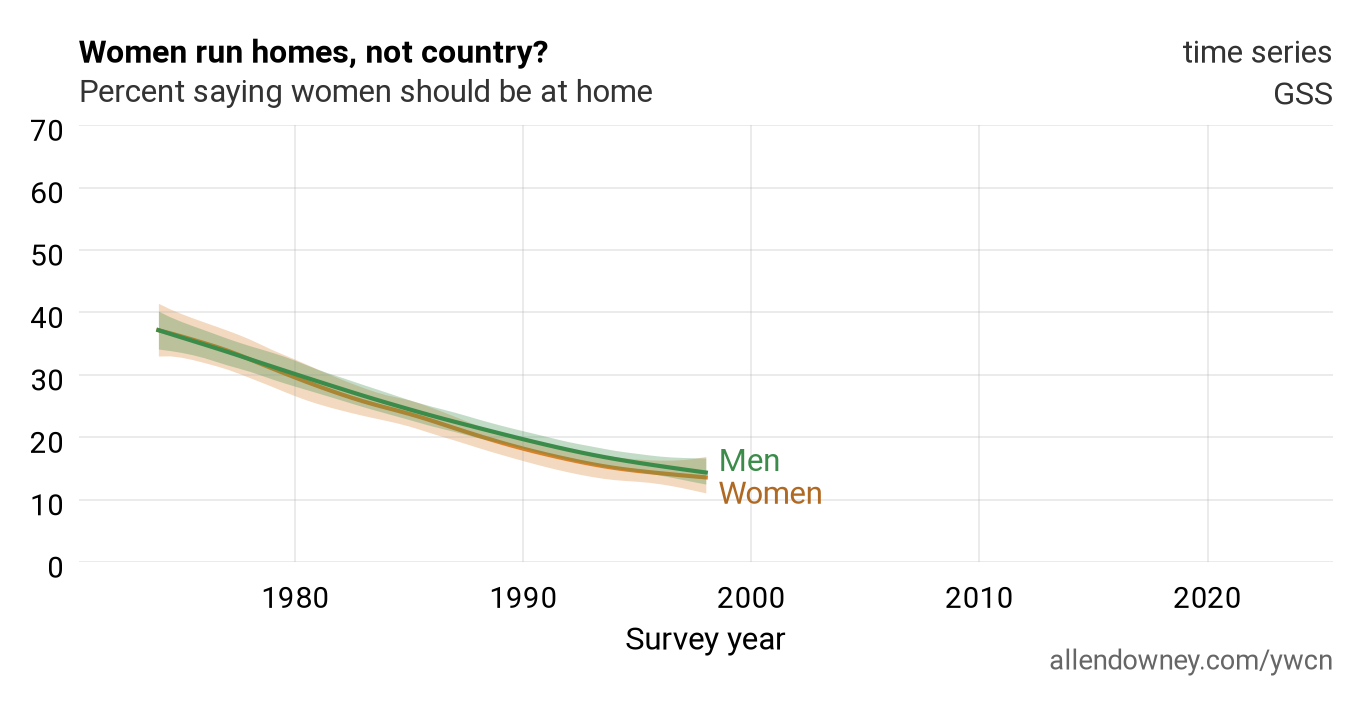
In 1974, 37% of women and 37% of men agreed. In 1998, it was 14% of women and 14% of men. In this time series, there is almost no difference between women and men. But here is the cohort component.
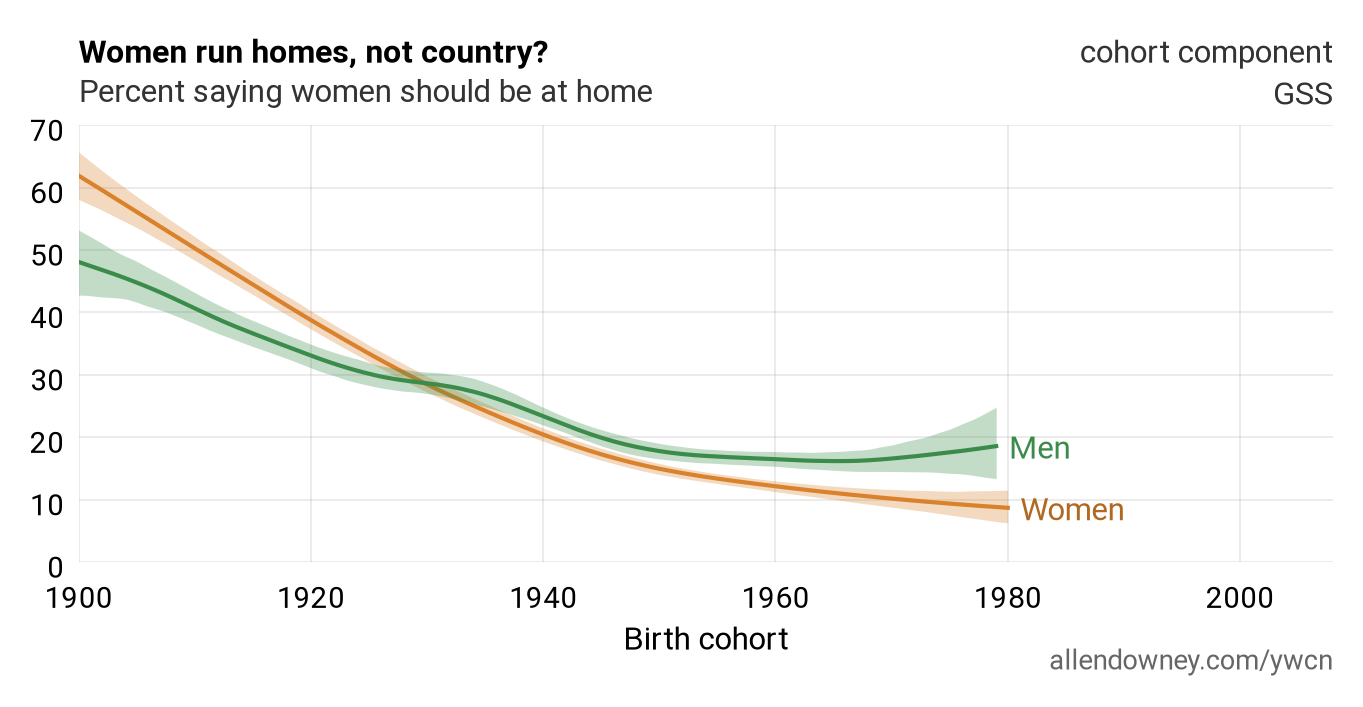
Among people born in 1900, 62% of women agreed that women should leave running the country to men, compared with 48% of men. The lines cross around the 1930 birth cohort. Among people born around 1980, it was 9% of women and 19% of men.
Small gaps can hide big ones
These examples show that a small gap in the time series can hide a large gap in the cohort component, or two large gaps that point in opposite directions. In any survey year, the respondents include several generations. If older women are more traditional than older men, and younger women are less traditional than younger men, the differences can cancel out when we average over everyone.
Here’s another example. From 1972 to 2010, the GSS asked:
If your party nominated a woman for President, would you vote for her if she were qualified for the job?
The following figure shows the percentage of women and men who said they would.
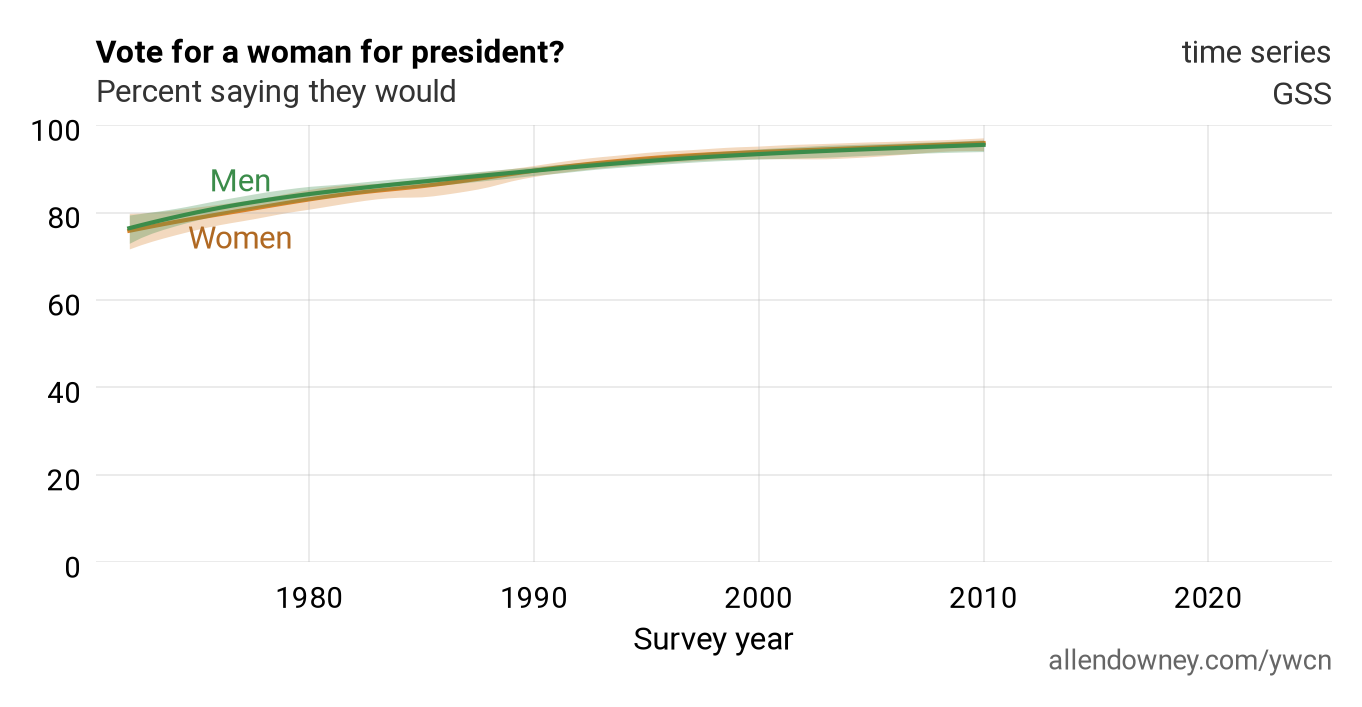
In 1972, 76% of women and 76% of men said they would vote for a woman; in 2010, 96% of women and 96% of men did. The lines are within a point of each other the whole time. But the cohort component tells a different story.
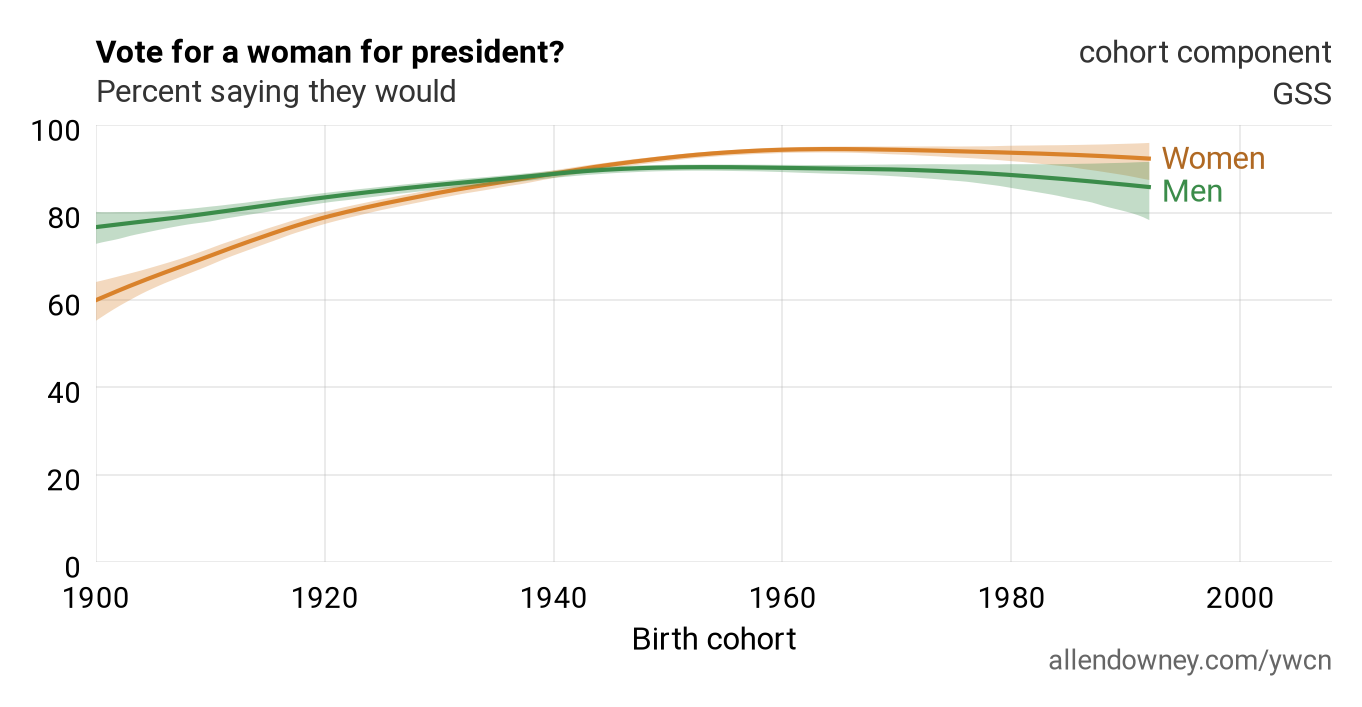
Among people born in 1900, 60% of women said they would vote for a woman, compared with 77% of men. The lines cross around the 1940 birth cohort. Among people born in 1992, it was 92% of women and 86% of men.
Polls from earlier decades are consistent with this pattern. According to Gallup, in three polls conducted in the 1960s, men were more likely than women to say they would vote for a woman for president — in 1969, it was 49% of women and 58% of men.
As a final example, the ANES asked respondents how they felt about the “women’s liberation movement”, from 1970 to 2000, using a “feeling thermometer” from 0 to 100 degrees. The following figure shows the percentage of women and men with warm feelings — that is, ratings above 50 degrees.
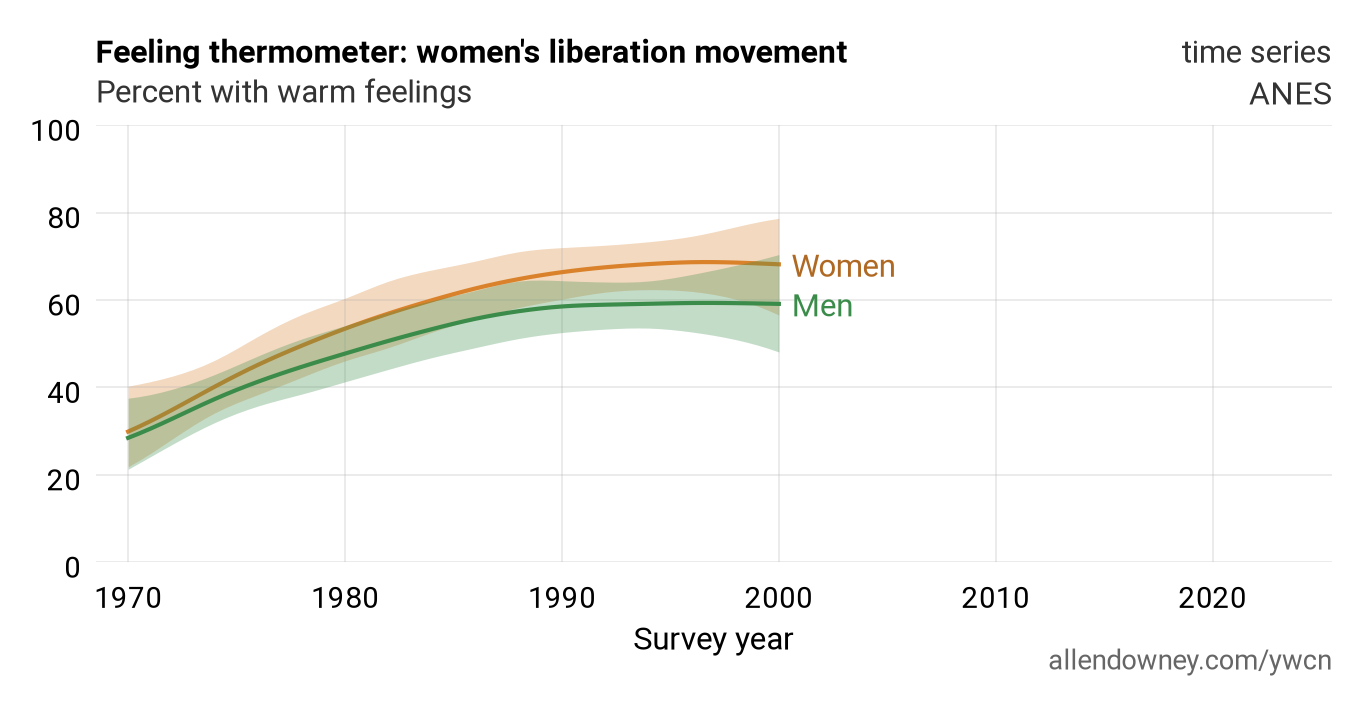
In 1970, 30% of women and 28% of men had warm feelings toward the women’s liberation movement. In 2000, it was 68% of women and 59% of men. In the time series, women are a little warmer than men the whole time. But in the cohort component, the gap runs the other way among the oldest generations.
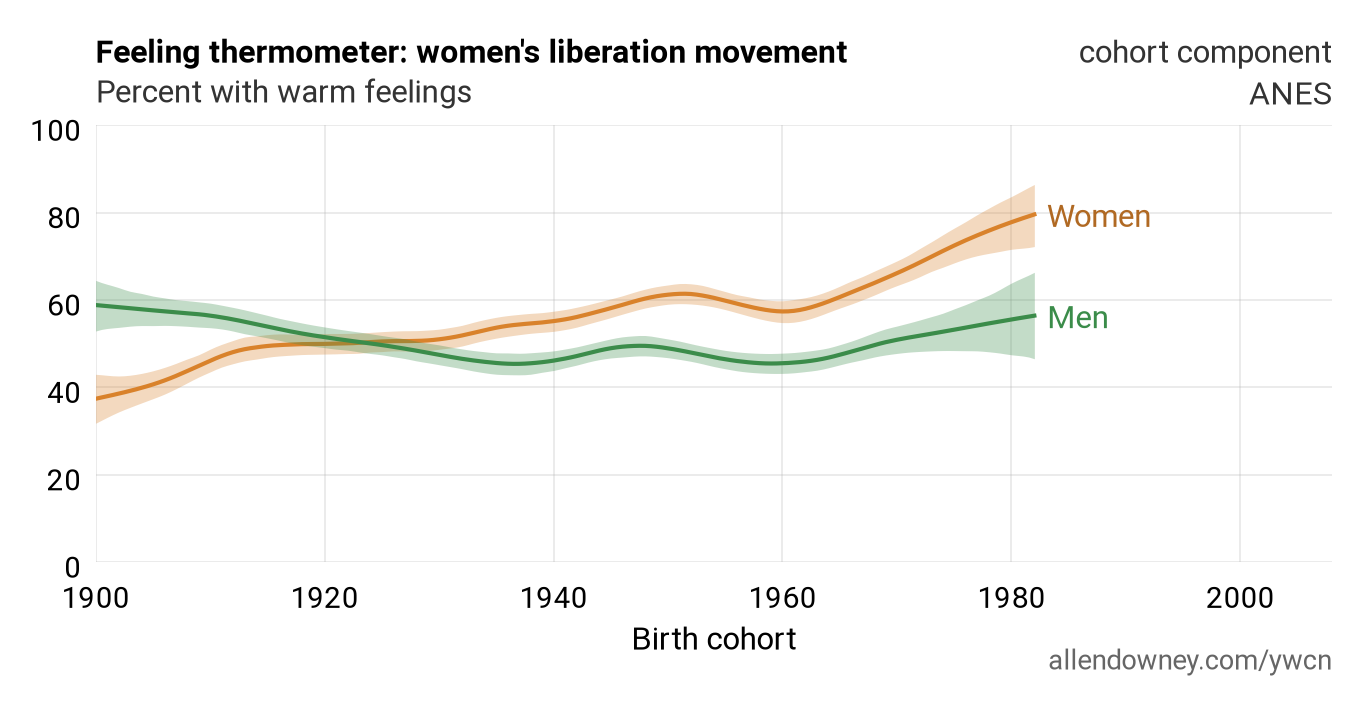
Among people born in 1900, 37% of women had warm feelings toward the women’s liberation movement, compared with 59% of men. The lines cross around the 1923 birth cohort. Among people born in 1982, it was 80% of women and 56% of men.
This post is based on material from You Would Choose Now, a work in progress I plan to publish in 2027.