The second edition of Think DSP is not for sale yet, but if you would like to support this project, you can contribute through Green Tea Press.
Chapter 1 Preview#
Click here to run this notebook on Colab.
import matplotlib.pyplot as plt

from thinkdsp import decorate
Read a wave#
read_wave reads WAV files. The WAV examples in the book are from freesound.org. In the contributors section of the book, I list and thank the people who uploaded the sounds I use.
from thinkdsp import read_wave

wave = read_wave('92002__jcveliz__violin-origional.wav')
wave.make_audio()
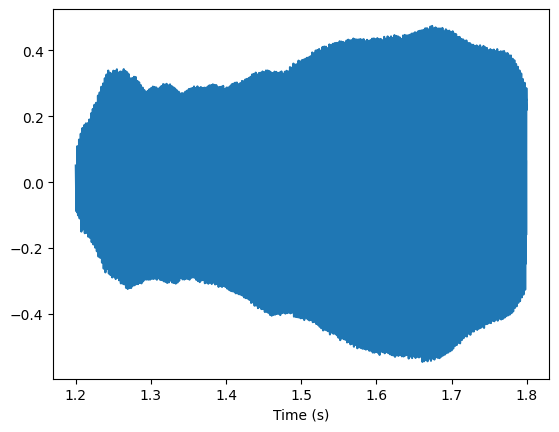
I pulled out a segment of this recording where the pitch is constant. When we plot the segment, we can’t see the waveform clearly, but we can see the “envelope”, which tracks the change in amplitude during the segment.
start = 1.2
duration = 0.6
segment = wave.segment(start, duration)
segment.plot()
plt.xlabel('Time (s)');
Spectrums#
Wave provides make_spectrum, which computes the spectrum of the wave.
spectrum = segment.make_spectrum()
Spectrum provides plot
spectrum.plot()
plt.xlabel('Frequency (Hz)');
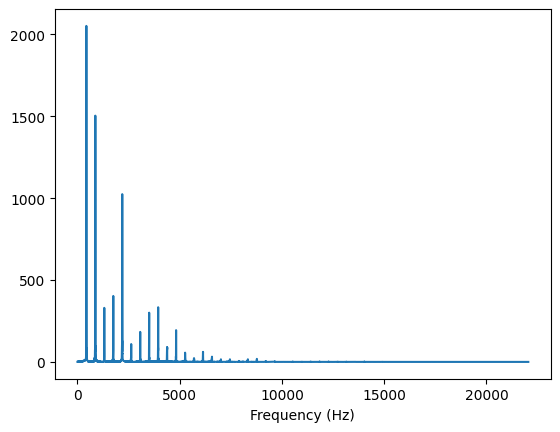
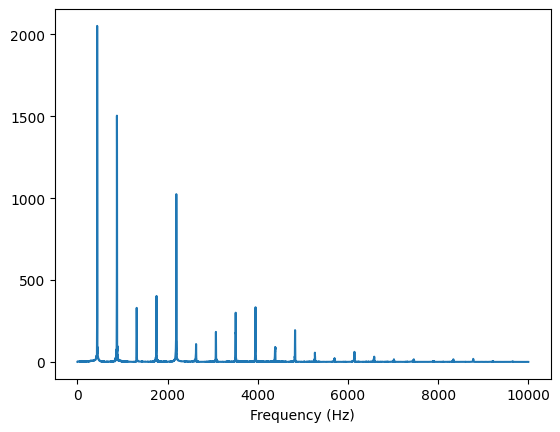
The frequency components above 10 kHz are small. We can see the lower frequencies more clearly by providing an upper bound:
spectrum.plot(high=10000)
plt.xlabel('Frequency (Hz)');
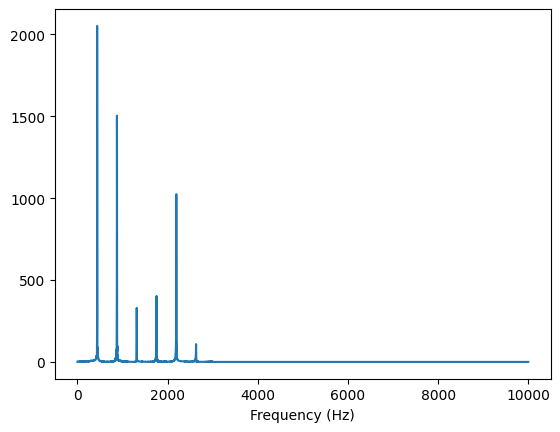
Spectrum provides low_pass, which applies a low pass filter; that is, it attenuates all frequency components above a cutoff frequency.
spectrum.low_pass(3000)
The result is a spectrum with fewer components.
spectrum.plot(high=10000)
plt.xlabel('Frequency (Hz)');
We can convert the filtered spectrum back to a wave:
filtered = spectrum.make_wave()
Now we can listen to the original segment and the filtered version.
segment.make_audio()
filtered.make_audio()
The original sounds more complex, with some high-frequency components that sound buzzy.
The filtered version sounds more like a pure tone, with a more muffled quality.
The cutoff frequency I chose, 3000 Hz, is similar to the quality of a telephone line, so this example simulates the sound of a violin recording played over a telephone.
Interaction#
The following shows the same example using interactive IPython widgets.
def filter_wave(wave, start, duration, cutoff):
    """Selects a segment from the wave and filters it.

    Plots the spectrum and displays an Audio widget.

    wave: Wave object
    start: time in s
    duration: time in s
    cutoff: frequency in Hz
    """
    segment = wave.segment(start, duration)
    spectrum = segment.make_spectrum()

    spectrum.plot(color='0.7')
    spectrum.low_pass(cutoff)
    spectrum.plot()
    plt.xlabel('Frequency (Hz)');
    plt.show()

    audio = spectrum.make_wave().make_audio()
    display(audio)
Adjust the sliders to control the start and duration of the segment and the cutoff frequency applied to the spectrum.
from ipywidgets import interact, fixed
from IPython.display import display

wave = read_wave('92002__jcveliz__violin-origional.wav')
interact(filter_wave, wave=fixed(wave),
         start=(0, 5, 0.1), duration=(0, 5, 0.1), cutoff=(0, 10000, 100));
Think DSP: Digital Signal Processing in Python, 2nd Edition
Copyright 2024 Allen B. Downey
License: Creative Commons Attribution-NonCommercial-ShareAlike 4.0 International