This is Part 4 in a series on gender gaps in life expectancy, what causes them, and what we can do about it.
In Part 3, we used counterfactual analysis to identify factors that contribute to the life expectancy gap in the United States. Now we’ll do the same for the other countries in the OECD (Organisation for Economic Co-operation and Development, a group of mostly developed, democratic countries). Then we’ll discuss evidence that public health and safety policies can reduce the life expectancy gap — especially policies that reduce deaths due to road traffic, alcohol, smoking, suicide, and homicide.
Different Factors in Different Countries
For each country, we identify leading factors, which include the factor that makes the largest contribution to the life expectancy gap and additional factors with a contribution at least half as big.
Starting in North America, the following list shows the current gender gap in each country, the leading factors, and how much of the gap could be closed if each factor was lowered to the smallest observed value.
United States (5.37 years): Road Traffic (-0.81), Drug Disorders (-0.77), Suicide (-0.52)
Canada (4.61 years): Drug Disorders (-0.51), Cancer (-0.36), Suicide (-0.34)
Canada is the only OECD country where drug deaths are the top factor. If the gender gap in drug disorders could be closed to the smallest observed gap (essentially zero), it would close the life expectancy gap by about half a year, according to the model.
In every Latin American country, road traffic is a leading factor; in Mexico and Colombia, homicide is the top factor.
Colombia (6.03 years): Homicide (-1.61), Road Traffic (-1.48)
Costa Rica (6.01 years): Road Traffic (-1.77)
Mexico (4.93 years): Homicide (-1.32), Road Traffic (-1.06), Liver Disease (-0.75)
Chile (4.60 years): Road Traffic (-0.88), Liver Disease (-0.45)
In every Northern European country, suicide is a leading factor, and in most, cancer is as well.
Finland (5.76 years): Lung Disease (-0.56), Liver Disease (-0.47), Suicide (-0.39)
Denmark (3.93 years): Cancer (-0.47), Suicide (-0.26), Alcohol (-0.25), Liver Disease (-0.24)
Norway (3.61 years): Cancer (-0.33), Suicide (-0.23)
Sweden (3.45 years): Suicide (-0.28), Drug Disorders (-0.15), Cancer (-0.14)
Iceland (3.25 years): Suicide (-0.37), Cancer (-0.21)
Compared to Northern Europe, the life expectancy gaps are bigger in Baltic Countries, but the leading factors are similar, including cancer and suicide.
Latvia (9.73 years): Cancer (-0.95), Suicide (-0.83), Road Traffic (-0.71), Cardiovascular (-0.59), Lung Disease (-0.53)
Lithuania (8.78 years): Suicide (-1.17), Cancer (-0.87), Liver Disease (-0.60)
Estonia (8.71 years): Liver Disease (-0.71), Cancer (-0.66), Suicide (-0.60), Lung Disease (-0.50), Alcohol (-0.48), Cardiovascular (-0.44)
The life expectancy gaps in Western Europe are among the smallest. Cancer is a leading factor in every country; suicide, lung disease, and liver disease are also common.
France (6.17 years): Cancer (-0.84), Suicide (-0.53)
Portugal (5.92 years): Cancer (-1.19)
Spain (5.29 years): Cancer (-0.94), Lung Disease (-0.71)
Germany (4.81 years): Cancer (-0.58), Suicide (-0.44), Liver Disease (-0.42), Lung Disease (-0.35)
Austria (4.77 years): Suicide (-0.55), Cancer (-0.44), Liver Disease (-0.38)
Italy (4.43 years): Cancer (-0.67), Lung Disease (-0.45), Road Traffic (-0.34)
Belgium (4.38 years): Lung Disease (-0.61), Cancer (-0.50), Suicide (-0.50)
United Kingdom (3.96 years): Cancer (-0.36), Suicide (-0.21), Drug Disorders (-0.21), Liver Disease (-0.20)
Switzerland (3.87 years): Cancer (-0.41), Suicide (-0.28)
Ireland (3.84 years): Cancer (-0.30), Suicide (-0.19)
Netherlands (3.40 years): Cancer (-0.49)
Luxembourg (3.39 years): Liver Disease (-0.27), Cancer (-0.26), Suicide (-0.17), Lung Disease (-0.17), Cardiovascular (-0.15)
In Eastern Europe, cancer, suicide and liver disease are leading factors in every country.
Poland (7.16 years): Suicide (-0.66), Cancer (-0.59), Liver Disease (-0.58), Alcohol (-0.48), Road Traffic (-0.42)
Slovakia (6.79 years): Liver Disease (-0.78), Cancer (-0.67), Suicide (-0.48)
Hungary (6.24 years): Liver Disease (-0.94), Suicide (-0.61), Cancer (-0.53)
Czechia (5.60 years): Cancer (-0.53), Suicide (-0.49), Liver Disease (-0.46), Lung Disease (-0.43), Road Traffic (-0.30)
Slovenia (5.50 years): Cancer (-0.68), Suicide (-0.68), Alcohol (-0.46), Cardiovascular (-0.43), Liver Disease (-0.39), Lung Disease (-0.35)
The patterns in other OECD countries are similar to Western Europe, where cancer and suicide are often leading factors, along with road traffic.
Australia (4.04 years): Cancer (-0.50), Suicide (-0.34)
New Zealand (3.67 years): Cancer (-0.31), Suicide (-0.30), Road Traffic (-0.30)
Greece (5.73 years): Cancer (-1.11), Road Traffic (-0.61)
Japan (6.88 years): Lung Disease (-1.19), Cancer (-1.17)
South Korea (6.78 years): Cancer (-0.80), Suicide (-0.75)
Israel (3.69 years): Road Traffic (-0.18), Cancer (-0.17), Suicide (-0.11)
Nine of the thirteen factors in the model appear as a leading factor in at least one country. Only four did not: unintentional injury, COVID-19, childhood mortality, and diabetes — although COVID was a leading factor in some countries during the peak of the pandemic.
Success Story: Road Traffic in Europe
Road traffic is a leading factor in only four countries in the European Union (EU), and it is not the top factor in any. That might not be a coincidence: In the early 2000s, the EU launched a coordinated effort to reduce traffic fatalities.
A 2001 transport policy set the goal of cutting road deaths in half by 2010.
The European Road Safety Action Programme (2003–2010) promoted stronger enforcement of speeding and drunk-driving laws, and encouraged seatbelt use, safer road design, and improved vehicle safety standards.
A follow-on program (2011–2020) added focus on protection for pedestrians and cyclists, and vehicle features like automatic emergency braking and lane-departure warnings.
These policies were not targeted specifically to men, but because traffic death rates are higher for men, the reduction in their rates was larger. As a result, in every European country the contribution of traffic deaths to the life expectancy gap decreased between 2000 and 2023. The following figure shows these changes.
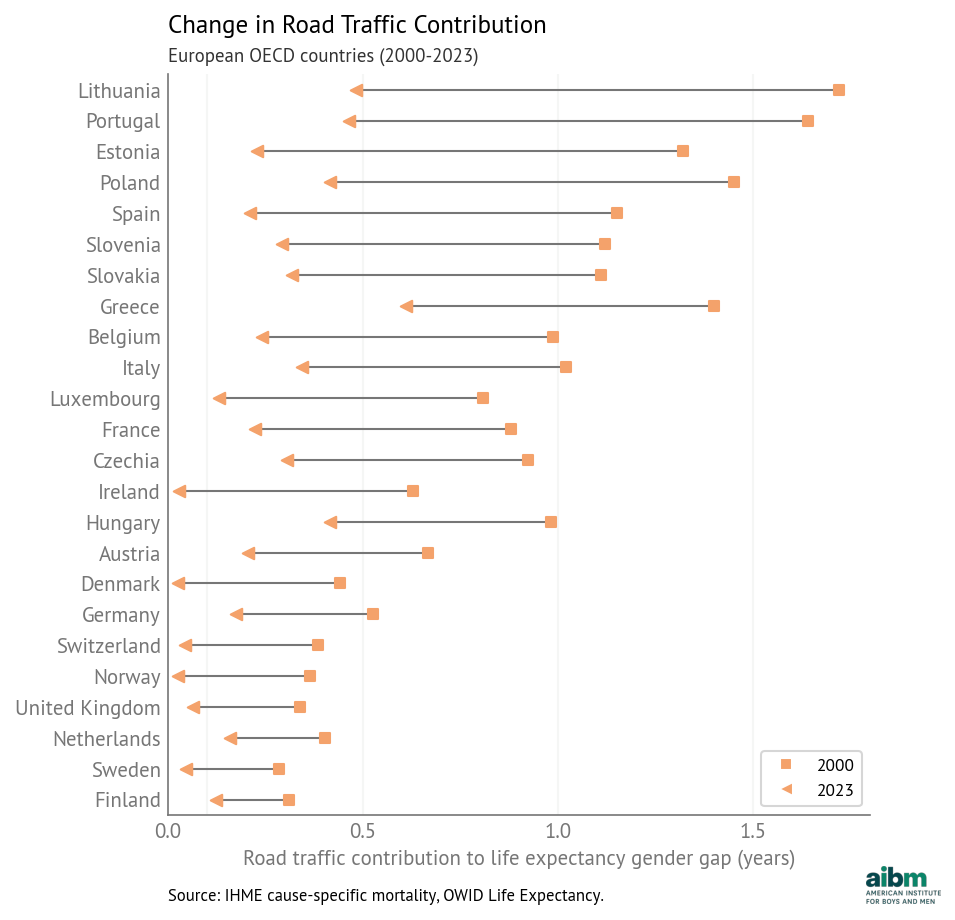
Figure 1:Change in road traffic contribution to the life expectancy gender gap (2000–2023), European OECD countries.
The declines are largest in Eastern and Southern Europe, where traffic death rates were highest. In five countries the life expectancy gap due to traffic decreased by more than a year. In another eleven countries, it decreased by more than 0.5 years. And in six countries, the remaining contribution is less than 0.1 years — which suggests that it is possible to eliminate the gender gap in road traffic deaths.
Amenable to Change
Road traffic in Europe is an example of how public health and safety policies can reduce the life expectancy gap. It is likely that the other causes of death that contribute to the gap are also amenable to intervention.
Drug disorders: The opioid epidemic in the United States and Canada was avoidable. Other high-income countries avoided harms on the same scale by maintaining stricter controls on opioid prescribing, implementing prescription monitoring systems earlier, limiting pharmaceutical marketing, and expanding harm-reduction measures. Deaths due to drug disorders have started to decline in the United States and Canada (although the causes are not yet clear). If these trends continue, we expect this component of the life expectancy gap to decrease.
Alcohol: The Baltic countries and Poland implemented alcohol control policies — including tax increases, availability restrictions, and marketing limits — that reduced alcohol-attributable mortality and contributed to declines in liver disease and suicide. In general, a decrease in alcohol use directly reduces the contribution of alcohol-related mortality and indirectly reduces the contributions of homicide, suicide, road traffic, liver disease, and cancer. In many OECD countries, alcohol use is falling, with lower rates of drinking among recent cohorts, compared with previous generations. If these patterns persist, alcohol’s contribution to the life expectancy gap may decrease as well.
Smoking: Smoking rates have declined in most OECD countries, driven by higher taxes, smoke-free laws, advertising bans, graphic health warnings on packaging, and restrictions on sales to minors. Because more men smoke, and they might suffer greater harms due to smoking, the decline of smoking should reduce the contributions of lung disease, cardiovascular disease, and cancer to the life expectancy gap.
Cancer: According to this recent study across 185 countries almost 40% of new cancers are preventable, attributable to factors including smoking and alcohol, obesity and lack of exercise, air pollution, solar radiation, infection, and occupational exposure. Like smoking and alcohol use, many of these factors are amenable to public health and safety policies. The paper notes that the proportion of preventable cancers is higher in men, which suggests that interventions that reduce death rates due to cancer would have a larger effect on men and reduce the life expectancy gap.
Suicide: In most OECD countries, the contribution of suicide to the life expectancy gap decreased between 2000 and 2023. The biggest declines were in the Baltic and Central European countries, due to improving economic conditions after the post-Soviet transition, stronger alcohol control policies, and the adoption of national suicide-prevention strategies. Similar declines occurred in Finland, Ireland, and Japan following coordinated public health interventions.
At the same time, the contribution of suicide increased by 0.11–0.14 years in the United States, Mexico, and Costa Rica, and by 0.34 years in South Korea. In the United States, rising suicide mortality has been concentrated among middle-aged men in economically declining regions; it is associated with job loss, substance abuse, social isolation, and uneven access to mental-health care. In South Korea, suicide rates rose sharply after the Asian financial crisis of the late 1990s and have remained high; it has been attributed to economic insecurity, workplace and educational pressures, and population aging, along with limited mental-health services and stigma surrounding treatment.
Homicide: In most OECD countries homicide contributes less than 0.05 years to the life expectancy gap, and changes since 2000 are small. The largest decline was in Colombia, where the contribution fell from 4.17 years to 1.61 years, due to state security policies, the demobilization of paramilitary groups, reduction of armed conflict, and violence-prevention efforts in major cities. In Estonia, Latvia, and Lithuania the contribution decreased by 0.25–0.52 years as economic conditions stabilized and institutions strengthened after the post-Soviet transition. The contribution of homicide increased by 0.3 years in Costa Rica and 0.7 years in Mexico due to increasing violence associated with organized crime and drug trafficking.
These examples show that the leading causes of the life expectancy gap are contingent: they depend on economic and social conditions, and they are amenable to the effect of public health and safety policies.
Technical Note: Country-specific intercepts
For each country, the model includes an intercept that captures the part of the observed life expectancy gap that is not explained by the gaps in death rates, but is consistent over time. The following figure shows these country-specific intercepts, sorted from highest to lowest. Error bars show 94% credible intervals.
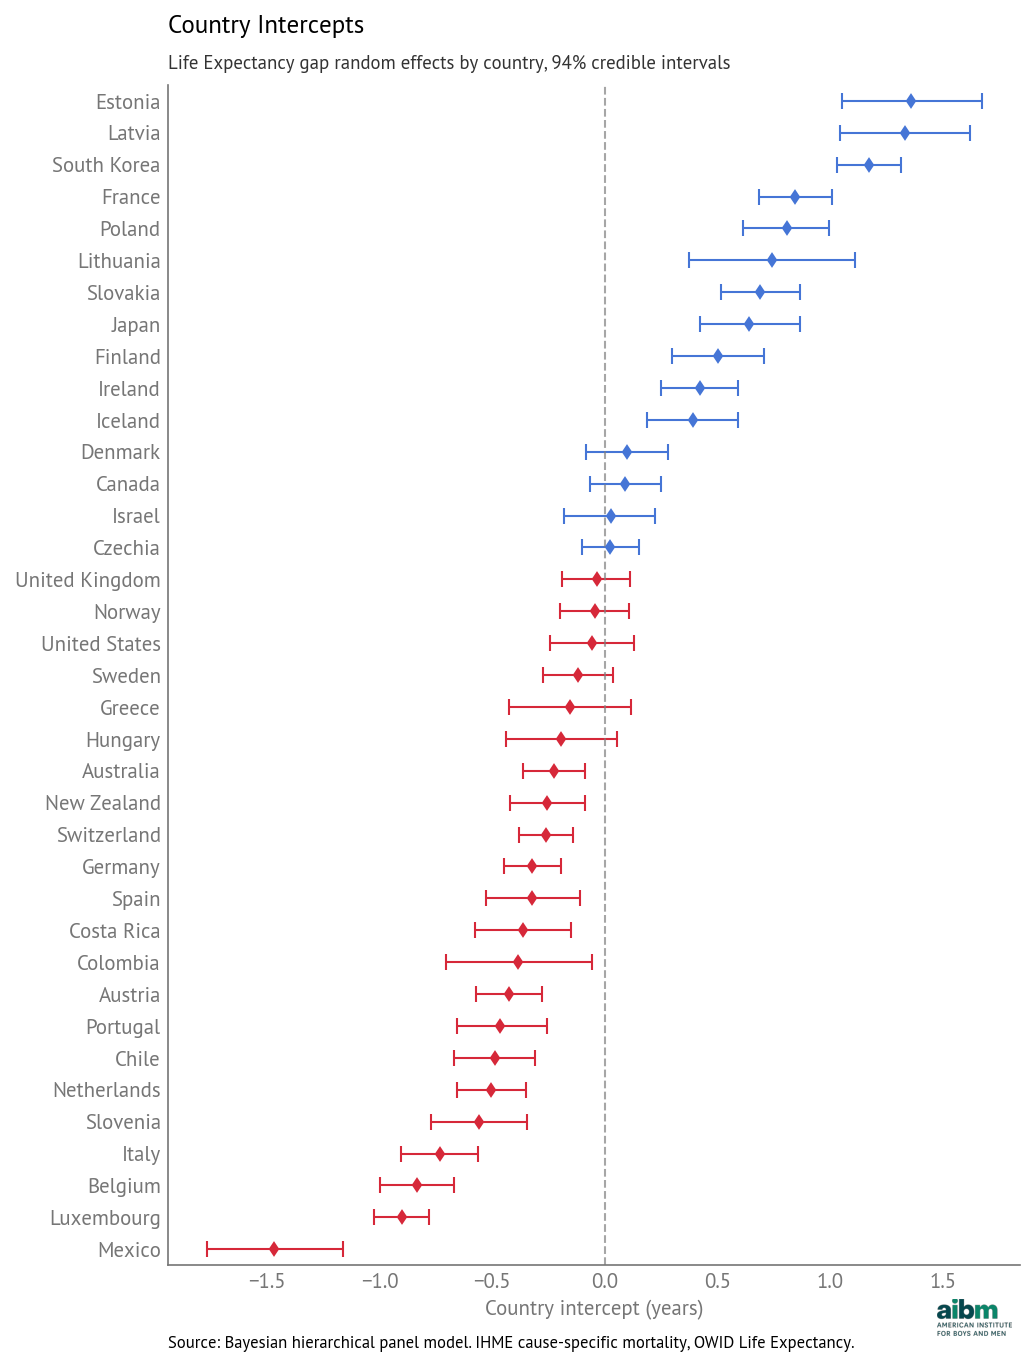
Country intercepts (random effects): deviation from overall mean, with 94% credible intervals.
Most of the intercepts are smaller than 0.5 years, positive or negative, and only a few are larger than one year. In Estonia, Latvia, and South Korea, life expectancy gaps are larger than the model would predict based on cause-specific death rates alone; in Mexico it is smaller than predicted.
These intercepts might reflect additional factors that are not included in the model, or interactions among the factors. They could also reflect persistent biases in data reporting.
In the next article, we’ll present a similar analysis for health life expectancy (HALE), which takes into account years of healthy life.
Next: [Healthy life expectancy: quality, not just quantity]