This is Part 1 in a series on gender gaps in life expectancy, what causes them, and what we can do about it.
In most countries, women live longer than men. That fact is so familiar it’s often treated as natural and inevitable.
For example, the World Economic Forum in their Global Gender Gap Report(GGGR) treats a smaller life expectancy gap as evidence of discrimination against women. They explain:
“In the case of healthy life expectancy the equality benchmark is set at 1.06 to capture the fact that women tend to naturally live longer than men. As such, parity is considered as achieved if, on average, women live five years longer than men.”
We wrote about this adjustment in a recent report, Beyond half measures: How to improve gender gap indices.
In a footnote, the GGGR explains that the 1.06 ratio is “based on the standards used in the UNDP’s Gender-Related Development Index, which uses 87.5 years as the maximum age for women and 82.5 years as the maximum age for men”, and cites the technical notes of the United Nations Development Programme Human Development Report 2021-2022, which explains:
“The indicators are transformed into indices [...] using the same goalposts that are used for the HDI, except life expectancy at birth, which is adjusted for the average five-year biological advantage that women have over men.”
There is no other explanation, no source cited for the size of the gap, and no evidence that it is biological.
Variation in place and time
Contrary to the assumption that the five-year gap is biological and inevitable, it varies substantially between countries and across time. The following figure shows the gender gap in life expectancy for 38 OECD countries from 2000-2023, with selected countries labeled.
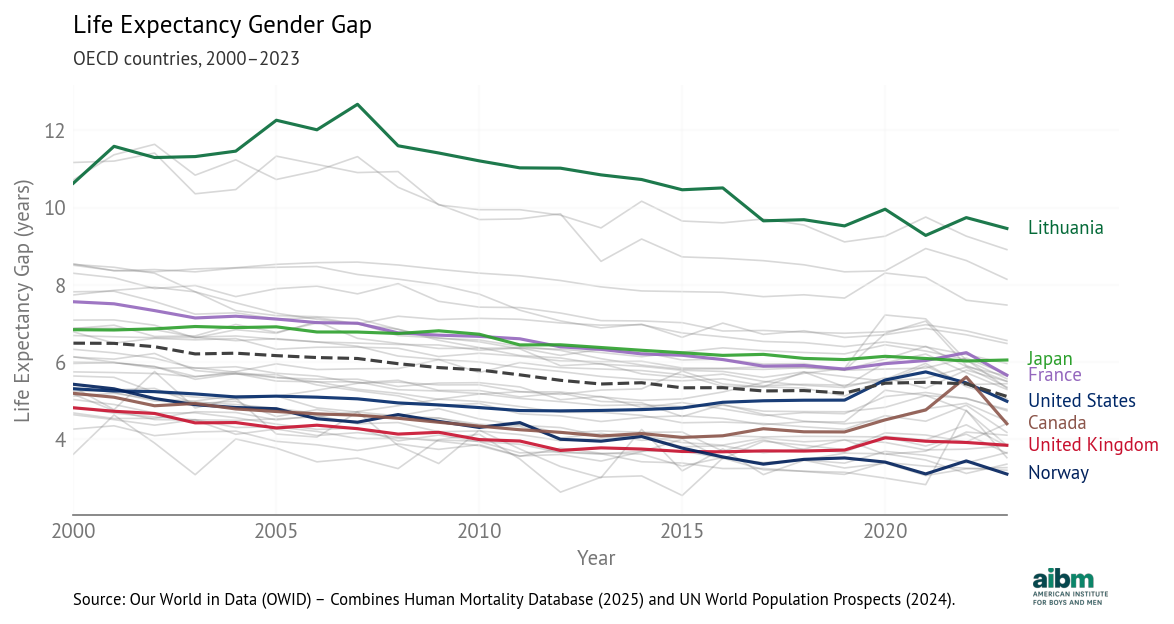
Life expectancy gender gap (2000–2023), OECD countries. From Our World in Data (OWID) - Combines Human Mortality Database (2025) and UN World Population Prospects (2024).
A positive gap means women live longer. The dashed line shows the OECD average.
The differences between countries are large. The largest gap in the dataset was 12.7 years in Lithuania in 2007. The smallest was just 2.5 years in Israel in 2015.
In 2023 the largest gaps are in Lithuania, Latvia, and Estonia, all greater than 8 years. The smallest gaps are in Norway, the Netherlands, Luxembourg, and New Zealand, all less than 3.5 years. The United States is close to the OECD average at 5.0 years.
Notably, some of the largest gaps are in Baltic countries, and some of the smallest in Scandinavia. A ferry from Tallinn to Stockholm travels 240 miles and closes the gender gap from 8.1 years in Estonia to 3.7 years in Sweden. What a difference the Baltic Sea makes.
There are also large differences over time. The OECD average dropped from 6.5 to 5.1 between 2000 and 2023 at an average rate of 0.6 years per decade. The largest decrease was in Estonia, at a rate of 1.5 years per decade. Gaps in Slovenia, Lithuania, Colombia, and Hungary have also closed faster than 1.0 years per decade. The only increases were in Mexico (0.8 years per decade) and Costa Rica (0.3 years per decade).
In the United States, the gap closed slightly between 2000 and 2015, then increased due to the opioid epidemic and COVID. Since 2021 it has decreased again as deaths due to both causes have declined. The net change is a decrease from 5.3 in 2000 to 5.0 in 2023. The pattern in Canada is similar to the U.S.
The large differences between countries and the consistent decline in almost all OECD countries suggest that the gender gap in life expectancy is not natural or inevitable.
But Why?
These results raise an obvious question: what causes these differences between countries and changes over time? Common explanations fall into three groups:
Biological: For example, the “frail male hypothesis” posits that men might have genetic vulnerabilities at higher rates because with only one X chromosome, they have less genetic redundancy than women. They also might be more vulnerable to diseases of aging because evolutionary forces rewarded “live fast, die young” strategies for males more than females.
Behavioral: Men might be more inclined to risk-taking behaviors like smoking, alcohol and drug use, aggressive driving, and extreme sports. And they might be more likely to engage in violent interactions and become victims of homicide.
Social: Men are overrepresented in hazardous occupations including military service. They might be exposed to road traffic hazards at higher rates as they are more likely to commute or drive for work. And they might have greater exposure and vulnerability to diseases of despair.
At this point we don’t mean to assert that any of these are true, or if true that they are the largest causal factors — only that these are the kinds of explanations people offer. We notice that explanations are most often offered in this order: biological first, behavioral second (and often underpinned by biology), and social last or never.
Drug Use Disorders
We can use differences between countries and across time to identify factors that are likely to contribute to gender gaps. For example, it is likely that the increasing gap in the United States between 2015 and 2020 was caused at least in part by the opioid epidemic.
To see whether that explanation is plausible, we use cause-specific death rates from the Global Burden of Disease (GBD) study, produced by the Institute for Health Metrics and Evaluation (IHME). This dataset includes death rates by cause, sex, country, and year, with a consistent methodology that allows us to compare gender gaps between countries and over time.
The following figure shows gender gaps in death rates due to drug use disorders.
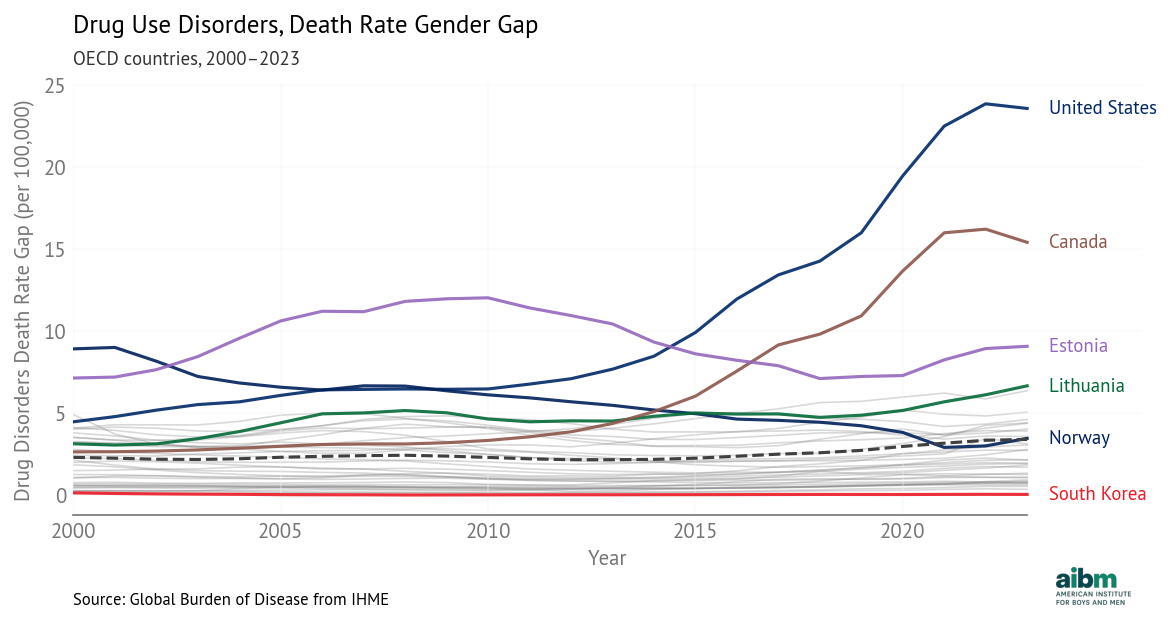
Drug use disorders, death rate gender gap (2000–2023), OECD countries. Source: Global Burden of Disease from IHME.
The most notable feature is the increase in the United States and Canada after 2013, which aligns with the third and fourth waves of the opioid epidemic, attributed to synthetic opioids like fentanyl. The fourth wave peaked in 2022 at 107,000 deaths. Men account for about 70% of opioid overdose deaths. The pattern is similar in Canada, although the gaps are lower throughout.
In many other countries, the gap declined slowly, with the steepest decline in Norway. Other than the United States and Canada, the biggest increases were in Lithuania and Great Britain.
The smallest gap was essentially zero in Japan in 2013; the smallest current gap is in South Korea. In both countries, social stigma against illicit drug use, conservative prescribing practices, and strict narcotics controls likely limited opioid markets.
Homicide
The following figure shows gender gaps in death rates due to interpersonal violence.
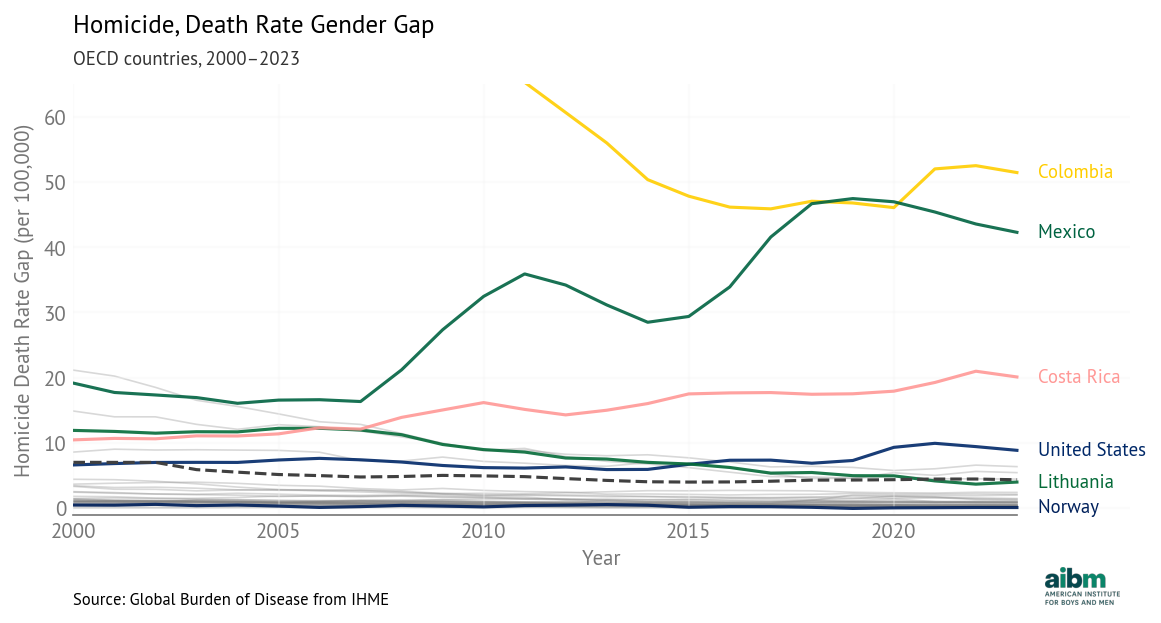
Homicide, death rate gender gap (2000–2023), selected OECD countries. Source: Global Burden of Disease from IHME.
The smallest gap was in Norway in 2019, when the rate was 0.48 for men and 0.55 for women, one of few instances where the female rate was slightly higher. Currently the smallest gap is in Switzerland, where the rates are 0.47 and 0.45.
The largest gap was in Colombia in 2002: the homicide rate was 158 per 100,000 for men and 18 for women, a difference of 140 (truncated in the chart). In Colombia in the early 2000s, homicide rates were among the highest in the world, due to armed conflict, paramilitary violence, drug trafficking networks, and weak state control in some regions. Nearly nine out of ten victims were men. When homicide declined, the gender gap narrowed.
Other than Colombia, the largest decreases were in the Baltic countries. The largest increases were in Mexico, Costa Rica, and the United States.
In the United States, homicide rates for men and women declined between 2000 and 2014, and the gap shrank. Since then, the gap has increased, driven primarily by firearm homicides. A sharp rise in 2020 coincided with pandemic-related social disruption and increased gun purchasing. During this period, the homicide rate for men increased much more than the rate for women, so the gap expanded. The net effect is an increase from 6.6 in 2000 to 8.8 in 2023.
Suicide
The following figure shows gender gaps in death rates due to self harm.
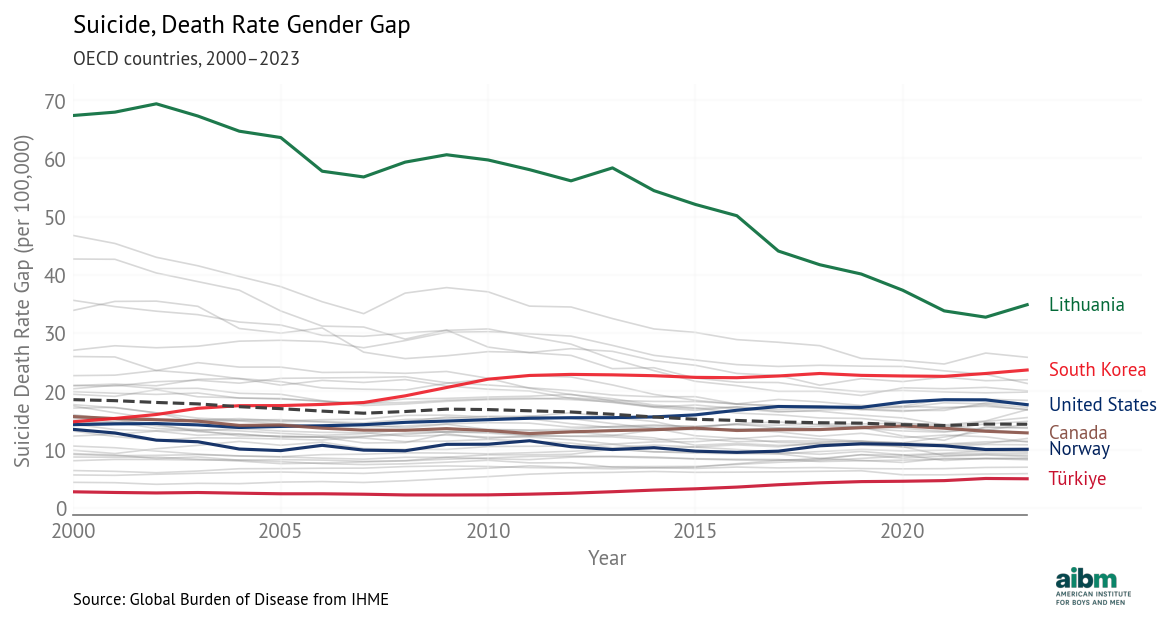
Suicide, death rate gender gap (2000–2023), selected OECD countries. Source: Global Burden of Disease from IHME.
The gender gap is much higher in Lithuania than in any other OECD country, driven by extraordinary male suicide rates in the aftermath of post-Soviet economic disruption. Since 2000, those rates have fallen sharply.
Other countries with large gaps are Latvia and South Korea, both over 20 per 100,000. South Korea’s suicide rate rose sharply after the 1997 Asian financial crisis, especially among working-age and elderly men. Economic disruption, elderly poverty, alcohol use, and limited mental health access are likely contributing factors.
The countries with the smallest gaps — and lowest rates — are Turkey, Greece, and Israel. These low rates might be explained by cultural characteristics, but they might also reflect classification practices.
In the United States, suicide rates have increased for both men and women, but they have increased about three times faster for men, so the gender gap has grown from 14 in 2000 to 18 in 2023. The increase has been driven in part by firearm suicides, which are more lethal. Economic instability, declining labor-force attachment among less-educated men, substance use, and social isolation are likely contributing factors. In 2023, the rate for men was 24.2 per 100,000, almost four times the rate for women, 6.5 per 100,000.
Road Traffic
The following figure shows gender gaps in death rates due to road traffic.
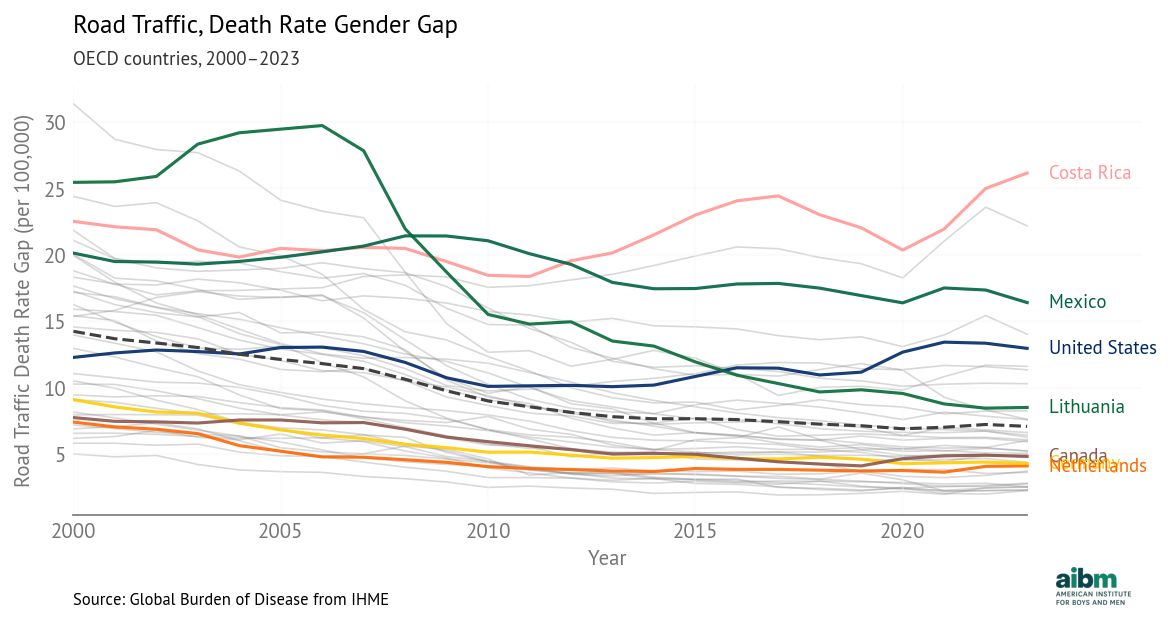
Road traffic, death rate gender gap (2000–2023), selected OECD countries. Source: Global Burden of Disease from IHME.
The most apparent change is the decline in Lithuania, from worst in 2005 to close to the OECD average. This decline followed EU accession in 2004, which brought stricter enforcement, infrastructure investment, and vehicle safety improvements. Alcohol-control measures and speed enforcement also contributed.
Also apparent is the divergence of Mexico and Costa Rica. Costa Rica’s traffic mortality declined alongside strengthened enforcement and road safety initiatives, while Mexico’s worsened amid institutional strain, rising motorcycle use, and uneven traffic law enforcement.
In the United States, the gap narrowed slightly between 2000 and 2010, then grew from 10 in 2010 to 13 in 2023. This change is driven primarily by the increase in death rates for men, from 17.5 in 2010 to 21 in 2023.
The widening gap reflects both exposure and risk per mile. Men in the United States drive about 60 percent more vehicle miles per year than women, and a disproportionate share of those miles occur in higher-risk settings such as nighttime and rural driving. Adjusting for miles driven removes roughly half of the raw male–female difference in fatalities. But even per mile driven, risk for men is higher, primarily due to higher rates of speeding, alcohol impairment, and lower seatbelt use.
Gender Gaps are Contingent
In all of these cause-specific death rates, we see large differences between countries and large changes over time. We can identify likely causes for these differences, including
Historical shocks, such as armed conflict in Colombia, the collapse of the Soviet Union, the Asian financial crisis, and the COVID pandemic.
Economic structure and labor-market conditions, including unemployment, deindustrialization, and elderly poverty.
Social and institutional conditions, such as family structure, social isolation, mental health access, and law enforcement capacity.
Cultural norms and behavioral patterns, including alcohol use, stigma around drug use, and norms surrounding risk-taking and help-seeking.
Public health and safety policies, such as Sweden’s Vision Zero road safety program, alcohol-control reforms in Lithuania, narcotics regulation, and vehicle and firearm policies.
Gender gaps in cause-specific death rates are highly contingent, not natural, and not inevitable. And they contribute directly to gender gaps in life expectancy.
Gender Gaps are Causative
By construction, differences in cause-specific death rates contribute to differences in age-specific death rates, which contribute to differences in period life expectancy.
For that reason, these factors are almost certainly causal in the counterfactual sense — if the gaps in the death rates were smaller, the gap in life expectancy would be smaller — and in the intervention sense — if a public health policy is able to reduce these rates, it would cause the life expectancy gap to close.
We note that there are two ways to reduce cause-specific death rates:
If a gender-targeted intervention reduces death rates for men more than for women, it would decrease the gender gap.
Less obviously, if a general intervention is equally effective for men and women — in the sense that it decreases rates by the same percentage — it would also decrease the gender gap. For example, the 2023 death rates due to drug use disorders in the United States were 41 for men and 17 for women, a gap of 24 deaths per 100,000. If both rates were cut by 50%, they would be 20.5 and 8.5, a gap of 12. In general, an intervention that improves health outcomes is likely to decrease the life expectancy gap.
In the next article, we will enumerate major causes of death with large gender gaps and build a model to estimate relationships between cause-specific death rates and differences in life expectancy. With this model, we can attribute changes in life expectancy to specific causes of death, and estimate the effect of hypothetical interventions on the gender gap in life expectancy.
Next: [Causal modeling: what drives the life expectancy gap?]