This is Part 3 in a series on gender gaps in life expectancy, what causes them, and what we can do about it. This article identifies the causes of death that contribute most to the gap, focusing on the United States. In the next article we’ll consider all OECD countries and identify policies that can narrow the gap.
In the previous article, we built a model to estimate how each cause of death contributes to the life expectancy gap. We identified leading factors in statistical terms: coefficients and feature importance. But the most important factor in the model might not be the most important factor for a particular country. For example, drug disorders have low importance overall because the gap is small in most OECD countries. But in the United States and Canada, drug disorders are among the leading contributors to the life expectancy gap. So now we’ll ask a different question: for a given country, which causes of death offer the largest opportunity to close the gap?
The Counterfactual
As an indication of what’s possible, we’ll consider the smallest observed gap for each cause-specific death rate. The following table shows the minimum gap, in deaths per 100,000 people, across all 37 countries and 24 years, and the country and year where it occurred.
| Cause | Minimum gap | Country | Year |
|---|---|---|---|
| Suicide | 4.05 | Greece | 2002 |
| Road Traffic | 1.92 | Iceland | 2017 |
| Liver Disease | 0.73 | Iceland | 2001 |
| Childhood | 0.59 | Ireland | 2021 |
| Alcohol | 0.23 | Colombia | 2016 |
| Drug Disorders | 0 | Japan | 2013 |
| Homicide | -0.06 | Norway | 2019 |
| Cancer | -2.97 | Colombia | 2023 |
| Diabetes | -12 | Latvia | 2021 |
| COVID-19 | -17.3 | Slovenia | 2022 |
| Injury | -18 | Netherlands | 2023 |
| Lung Disease | -26.4 | Iceland | 2022 |
| Cardiovascular | -191 | Latvia | 2021 |
For example, in Ireland in 2021, the gap in childhood mortality rates was only 0.59 per 100,000, substantially smaller than the OECD average, about 22 per 100,000. This small difference seems to be due to an unusually low rate for boys, rather than a high rate for girls. This example suggests that the gap in child mortality can be close to zero.
The rate gap for several causes is negative, which means that in some places and times, the usual pattern is reversed and death rates are higher for women. For these causes, we assume that if the gaps can be negative or positive, they can also be zero.
Some gaps might be harder to close than others. The smallest rate gap for suicide is about 4 per 100,000, reported in Greece in 2002. The OECD average is about 14.
To be conservative, we’ll assume that the smallest observed gap is the smallest attainable gap.
The United States
In 2023, the life expectancy gap in the United States was 5.0 years, close to the OECD average. The following table shows how much this gap would change, according to the model, if we reduced each cause-specific gap to its best attainable level.
| Cause | Current gap | Target gap | Target Country-Year | Change in LE gap (years) |
|---|---|---|---|---|
| Road Traffic | 13 | 1.92 | Iceland (2017) | -0.81 |
| Drug Disorders | 23.6 | 0.0028 | Japan (2013) | -0.77 |
| Suicide | 17.7 | 4.05 | Greece (2002) | -0.52 |
| Homicide | 8.85 | 0 | -0.28 | |
| Liver Disease | 9.06 | 0.729 | Iceland (2001) | -0.22 |
| Cancer | 23.5 | 0 | -0.20 | |
| Alcohol | 7.37 | 0.232 | Colombia (2016) | -0.15 |
| Childhood | 23.2 | 0.594 | Ireland (2021) | -0.08 |
| Injury | 5.9 | 0 | -0.06 | |
| COVID-19 | 1.28 | 0 | -0.01 | |
| Cardiovascular | 30.7 | 0 | 0.15 | |
| Lung Disease | -6.32 | 0 | 0.18 | |
| Diabetes | 7.73 | 0 | 0.20 |
The following figure shows the results graphically, with 94% credible intervals.
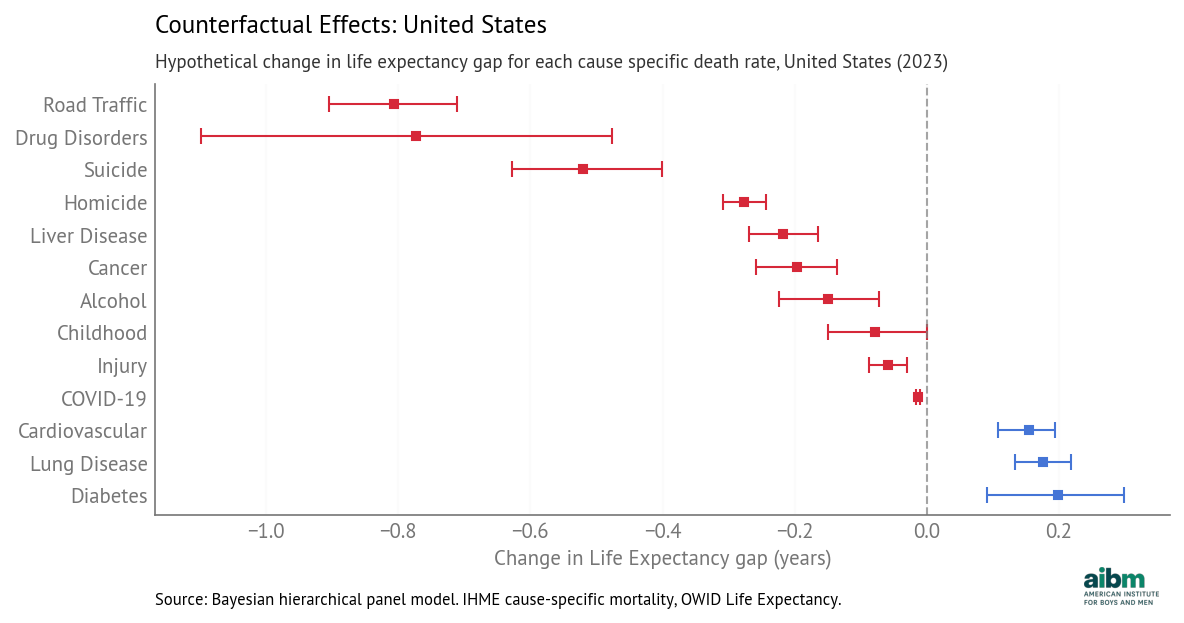
Counterfactual effects: hypothetical change in life expectancy gap for each cause-specific death rate, United States (2023), 94% credible intervals.
Road traffic has the largest potential impact — reducing the death rate gap to Iceland’s 2017 level would close the life expectancy gap by 0.81 years.
Drug disorders are second — reducing the gap to Japan’s 2013 level (essentially zero) would close the life expectancy gap by 0.77 years.
And if the rate gap due to suicide could be reduced from 18 to 4 per 100,000, the model predicts the life expectancy gap would close by 0.52 years.
For homicide, liver disease, cancer, and alcohol, the potential impact is smaller but still meaningful. The potential impact of childhood mortality and injury is smaller still, and for COVID-19 in 2023 it is near zero.
For lung disease, the gender gap in the U.S. is negative, meaning that the death rate is higher for women. So if we close this gap to zero, the life expectancy gap might grow by 0.18 years.
And for cardiovascular disease and diabetes, the estimated coefficient is negative, which means that if we reduce the rate gap, the model predicts that the life expectancy gap would grow. However, as we discussed in the previous article, these negative coefficients might be explained by competing risks — if general health outcomes are better, more people live long enough to die from diseases of aging, so those rates tend to be higher. If that’s true, the counterfactual assumption might not hold — that is, if an intervention is able to reduce these gaps, it’s not clear what effect that would have on life expectancy.
But for the other causes of death, the counterfactual assumption is plausible. For example, if the rate gap due to drug disorders closes — which is likely as overall rates have already started to fall — it is reasonable to expect the life expectancy gap to close, other things being equal.
The total of the gap-closing effects is about 3.1 years, which suggests that together they could reduce the life expectancy gap from 5.0 to 2.9 years.
In reality these effects are likely to interact. For example, a decrease in consumption of alcohol would directly affect death rates due to alcohol, and indirectly affect rates due to liver disease, cancer, road traffic, accidents, suicide, homicide, and possibly drug disorders. With these kinds of interactions, the total effect of multiple interventions might be larger or smaller than the sum of the estimates from the model.
Nevertheless, the magnitudes of the contributions indicate which interventions have the most potential to reduce the life expectancy gap.
The following figure shows how the positive contributions to the gap have changed over time.
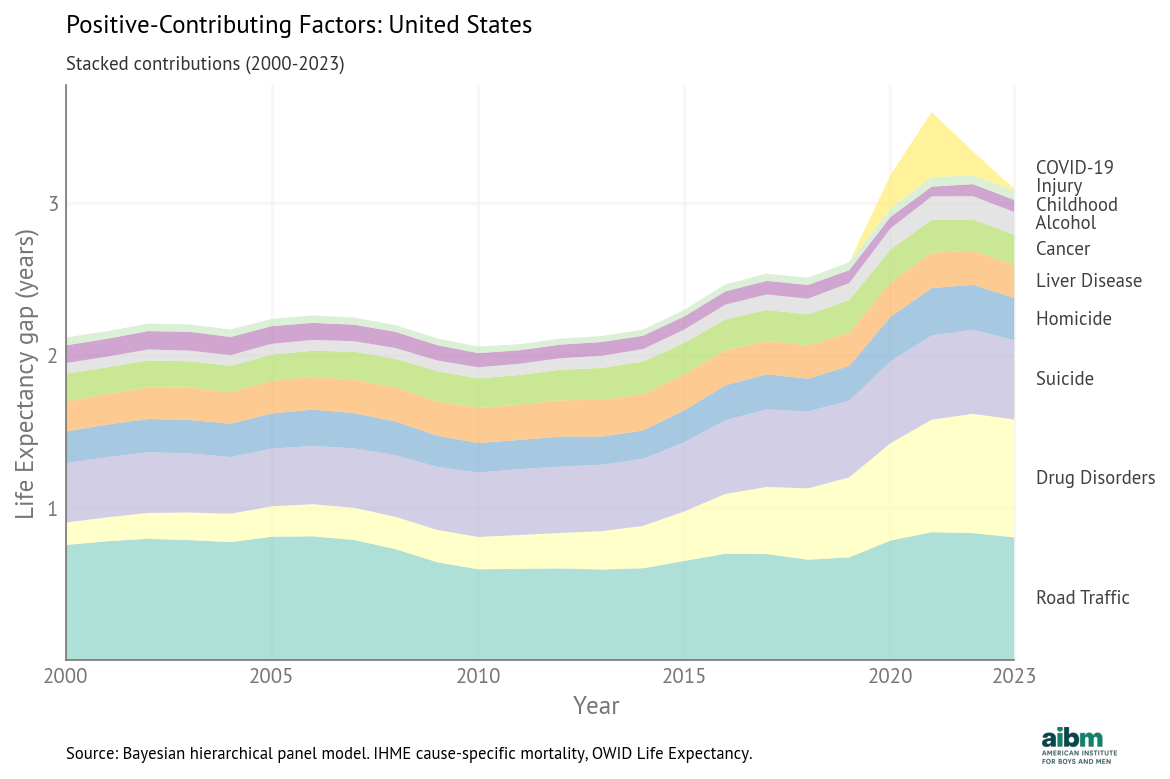
Stacked positive contributions to the life expectancy gap, United States (2000–2023).
The total has generally increased, driven by a large increase in the contribution of drug disorders and smaller increases in the contributions of suicide and road traffic. But this pattern is unusual; in most OECD countries, the total contribution decreased over this period, as we’ll see in the next article.