Purpose
This report examines temporal trends in health indicators and gender gaps across OECD countries from 2000 to 2019. By analyzing data across all years in this period, we can observe:
How gender gaps in Healthy Life Expectancy (HALE) and Life Expectancy (LE) have evolved over time
Trends in overall mortality rates (Mid values) for each health indicator
Trends in gender gaps (Gap values) for each health indicator
Which countries have shown the most improvement or deterioration in specific indicators
Which indicators show the strongest trends (increasing or decreasing) over the two-decade period
This temporal analysis complements the cross-sectional modeling approach by revealing dynamic patterns that may not be apparent in single-year snapshots. Understanding these trends helps identify:
Areas where progress has been made (narrowing gaps, declining rates)
Areas of concern (widening gaps, increasing rates)
Countries that serve as positive examples of improvement
Indicators with the strongest temporal trends that may require targeted interventions
Methodology
Data Sources and Time Period
Time Period: 2000-2019 (excluding 2020+ to avoid COVID-19 pandemic distortions)
Data Sources:
WHO Global Health Observatory: HALE and Life Expectancy data
IHME Global Burden of Disease: Cause-specific mortality indicators (cardiovascular disease, diabetes, chronic respiratory disease, neoplasms, alcohol use disorders, self-harm/suicide, interpersonal violence/homicide, road injuries, unintentional injuries, liver disease)
Data Processing
For each indicator, we:
Load temporal data: Preserve all years from 2000-2019 (not just the most recent year)
Compute gender gaps: For each year, calculate the difference between male and female values
For predictors: Gap = Male - Female (positive gap means higher male rates)
For targets (HALE/LE): Gap = Female - Male (positive gap means women live longer)
Compute midpoint values: Average of male and female values, representing overall rates
Filter to OECD countries: Focus on 38 OECD countries for consistency and data quality
Statistical Analysis
For each indicator and country, we compute:
Mean: Average value across all years (2000-2019)
Slope: Linear trend over time
For each indicator, we identify countries with:
Highest Mean: Country with the highest average value over the period
Lowest Mean: Country with the lowest average value over the period
Highest Slope: Country with the largest positive slope (most increasing trend)
Lowest Slope: Country with the most negative slope (most decreasing trend)
HALE and Life Expectancy
HALE Time Series (Overall Rates)
The following figures show changes in HALE in all countries and in selected countries.
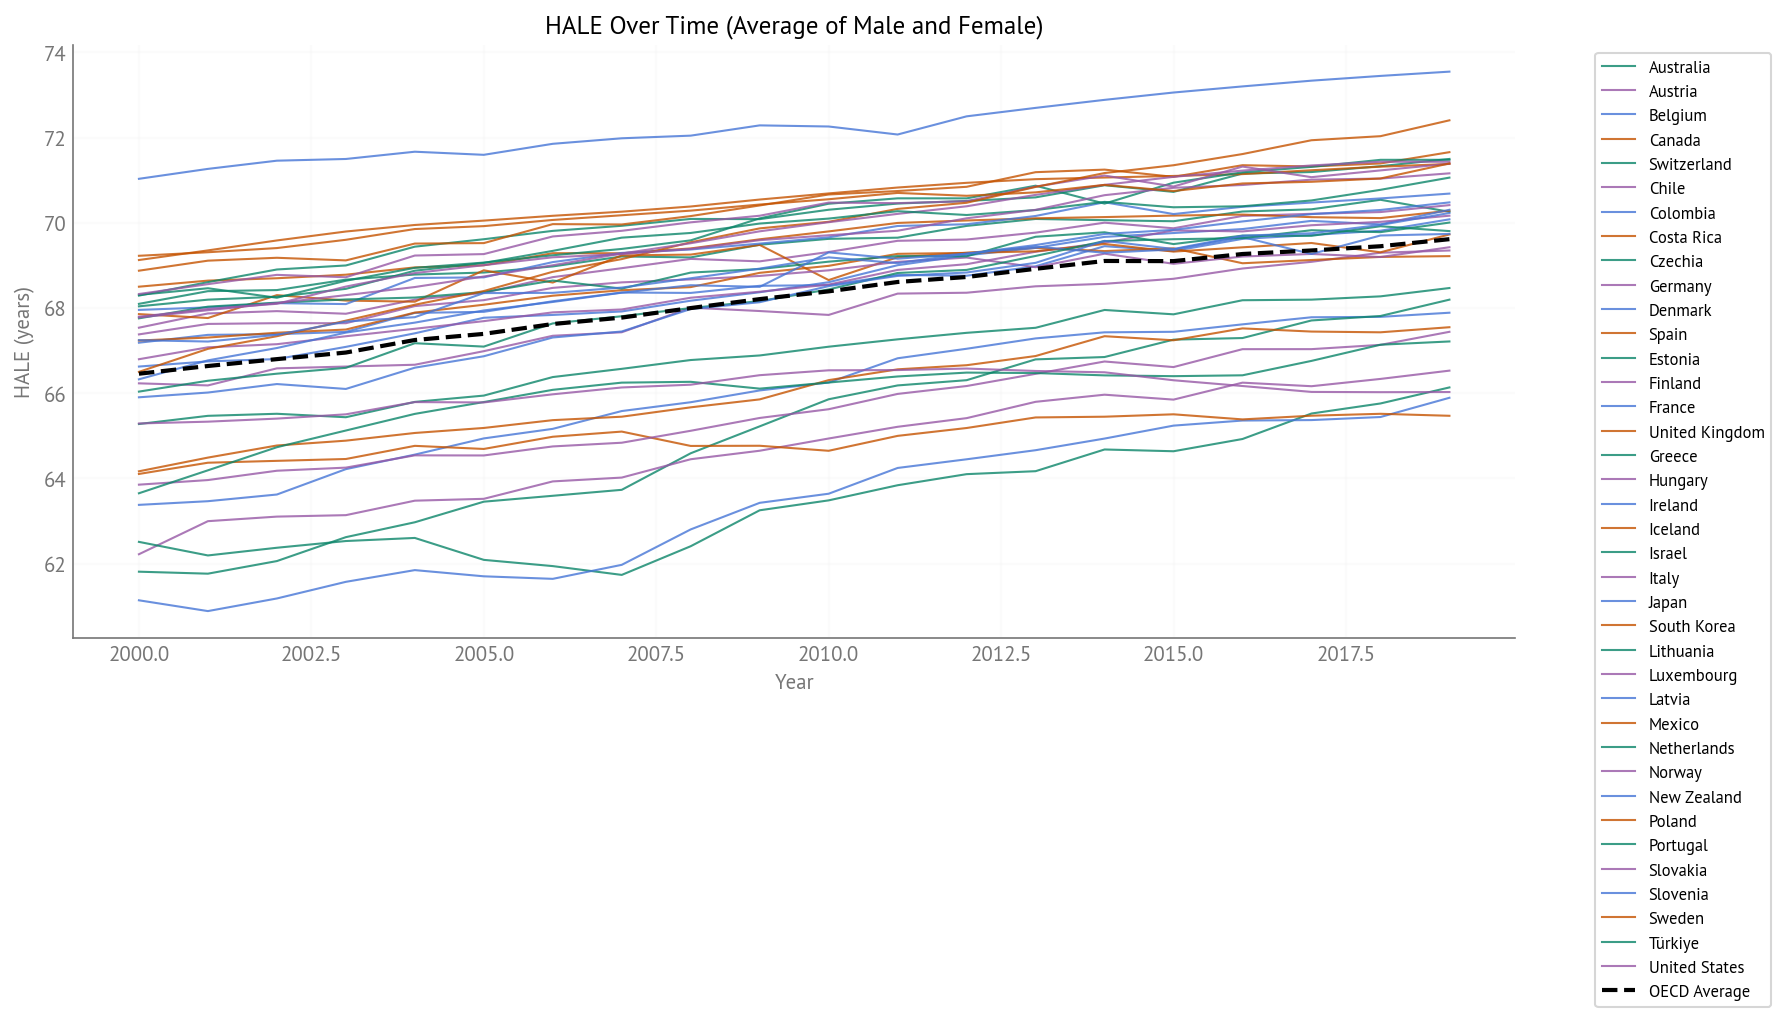
Figure 1:HALE Over Time (2000-2019) - All OECD Countries
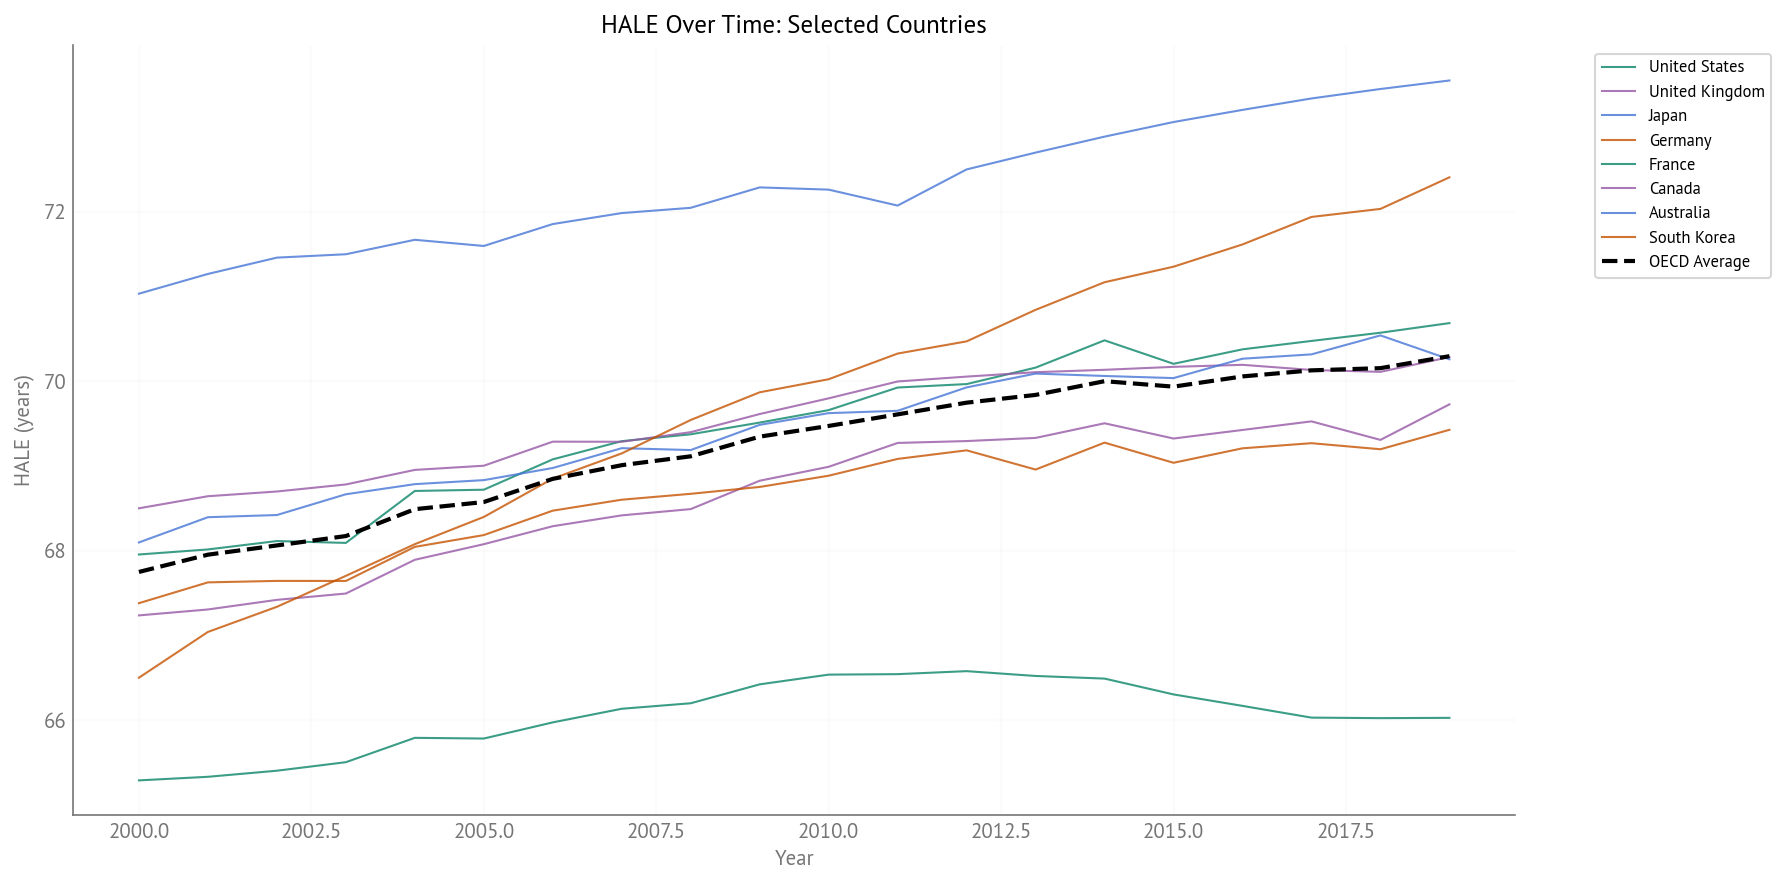
Figure 2:HALE Over Time (2000-2019) - Selected Countries
Key Observations:
Increasing trends: Most countries show increasing HALE over time, reflecting overall improvements in population health
Wide variation: HALE ranges from around 60 years to over 70 years across OECD countries
Convergence: Some convergence is evident, with countries with lower initial HALE showing faster improvement
Life Expectancy Time Series (Overall Rates)
The following figures show changes in life expectancy in all countries and in selected countries.
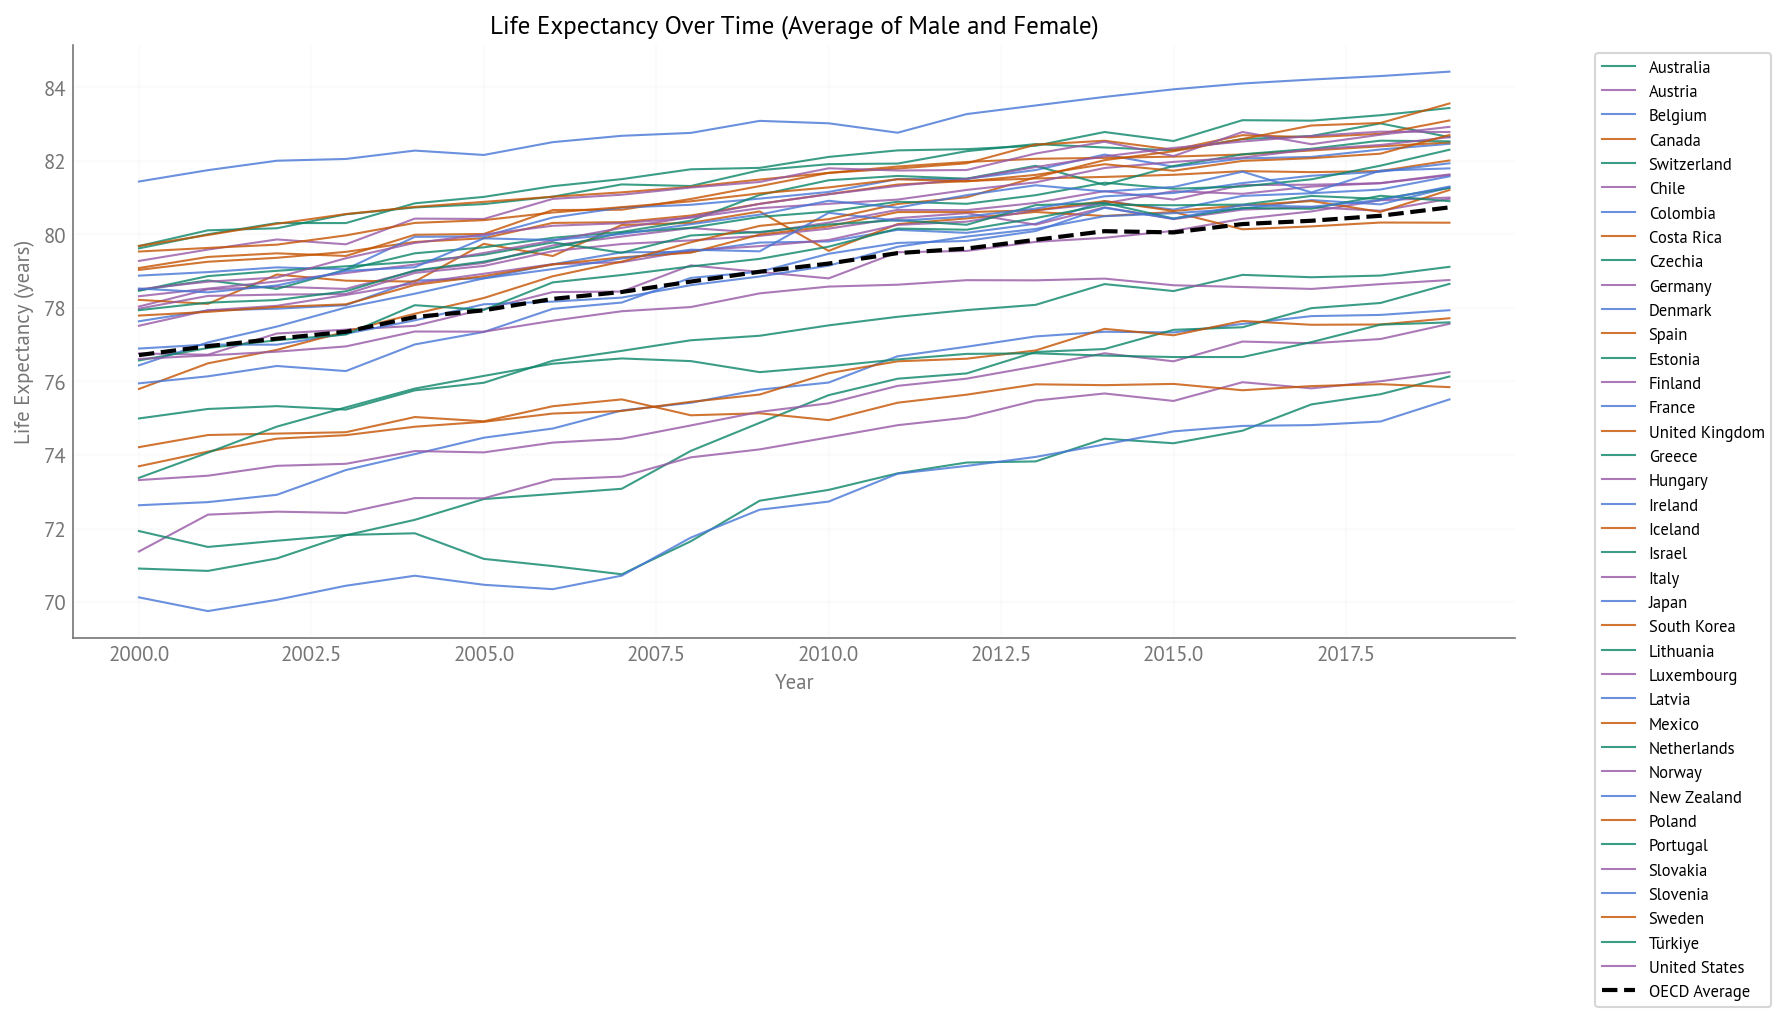
Figure 3:Life Expectancy Over Time (2000-2019) - All OECD Countries
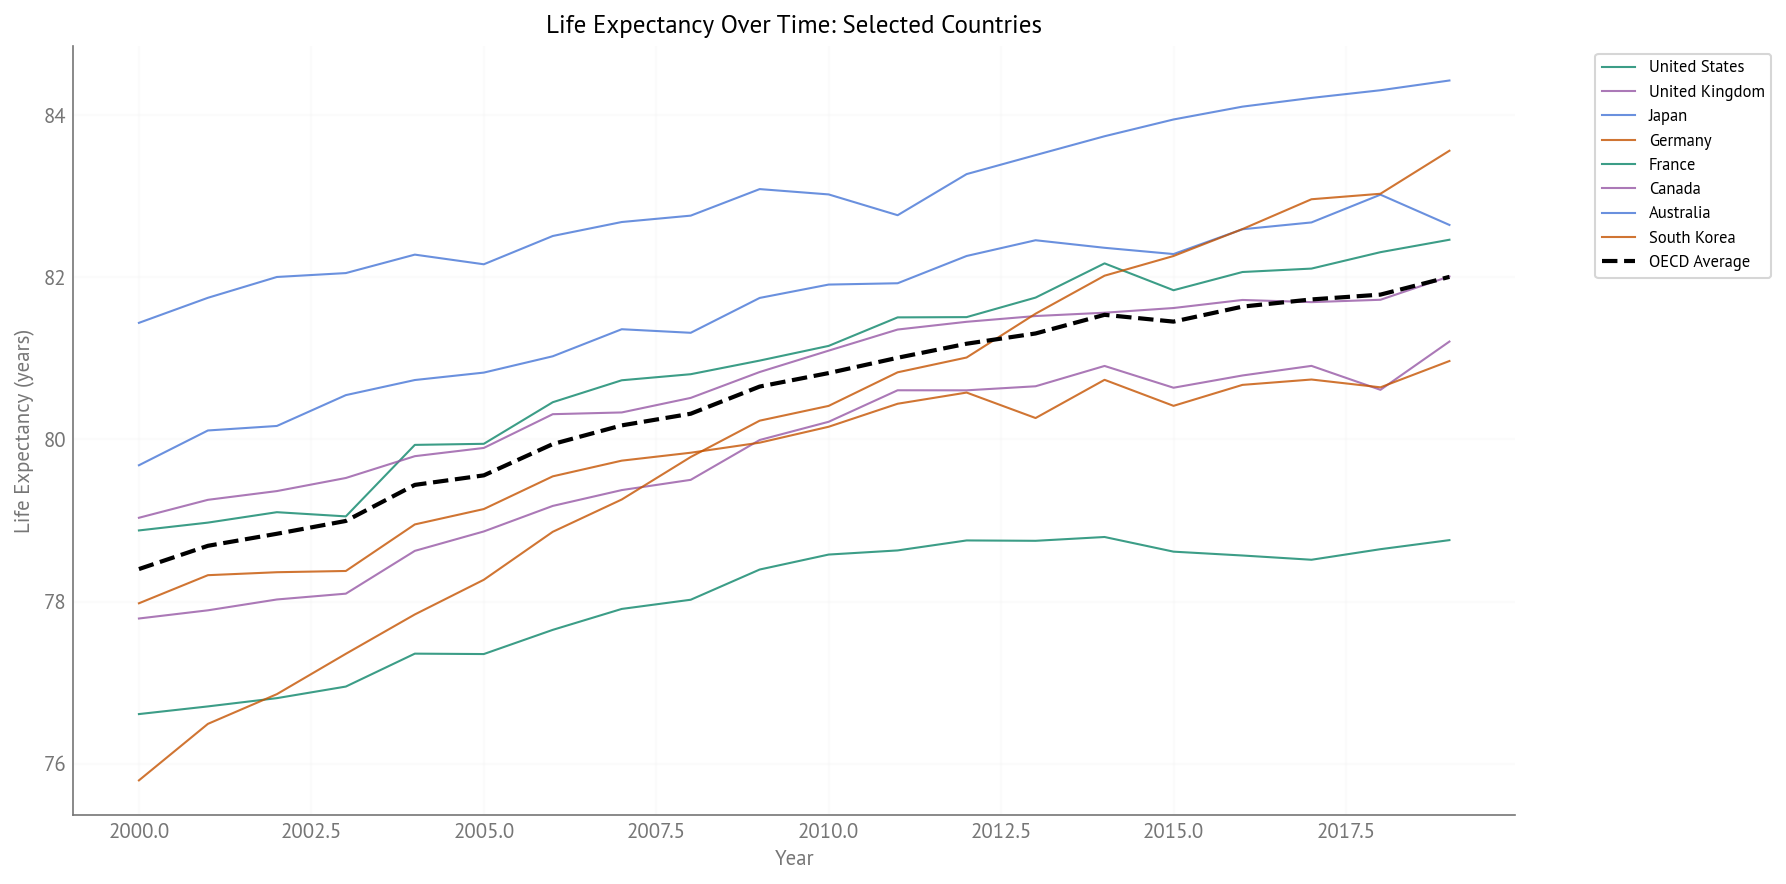
Figure 4:Life Expectancy Over Time (2000-2019) - Selected Countries
Key Observations:
Increasing trends: Life Expectancy has increased across most OECD countries over the two-decade period
Wide variation: Life Expectancy ranges from around 70 years to over 80 years
Overall improvement: The OECD average shows steady improvement, reflecting successful public health interventions
Relationship between Levels and Gaps:
Countries with higher overall HALE/LE don’t necessarily have smaller gaps
Some countries (e.g., Netherlands) achieve both high levels and small gaps
The gap analysis complements the level analysis by highlighting gender equity dimensions
HALE Gap Trends
The HALE gap represents the difference in Healthy Life Expectancy between women and men (Female - Male, in years). A positive gap means women have longer healthy life expectancy.
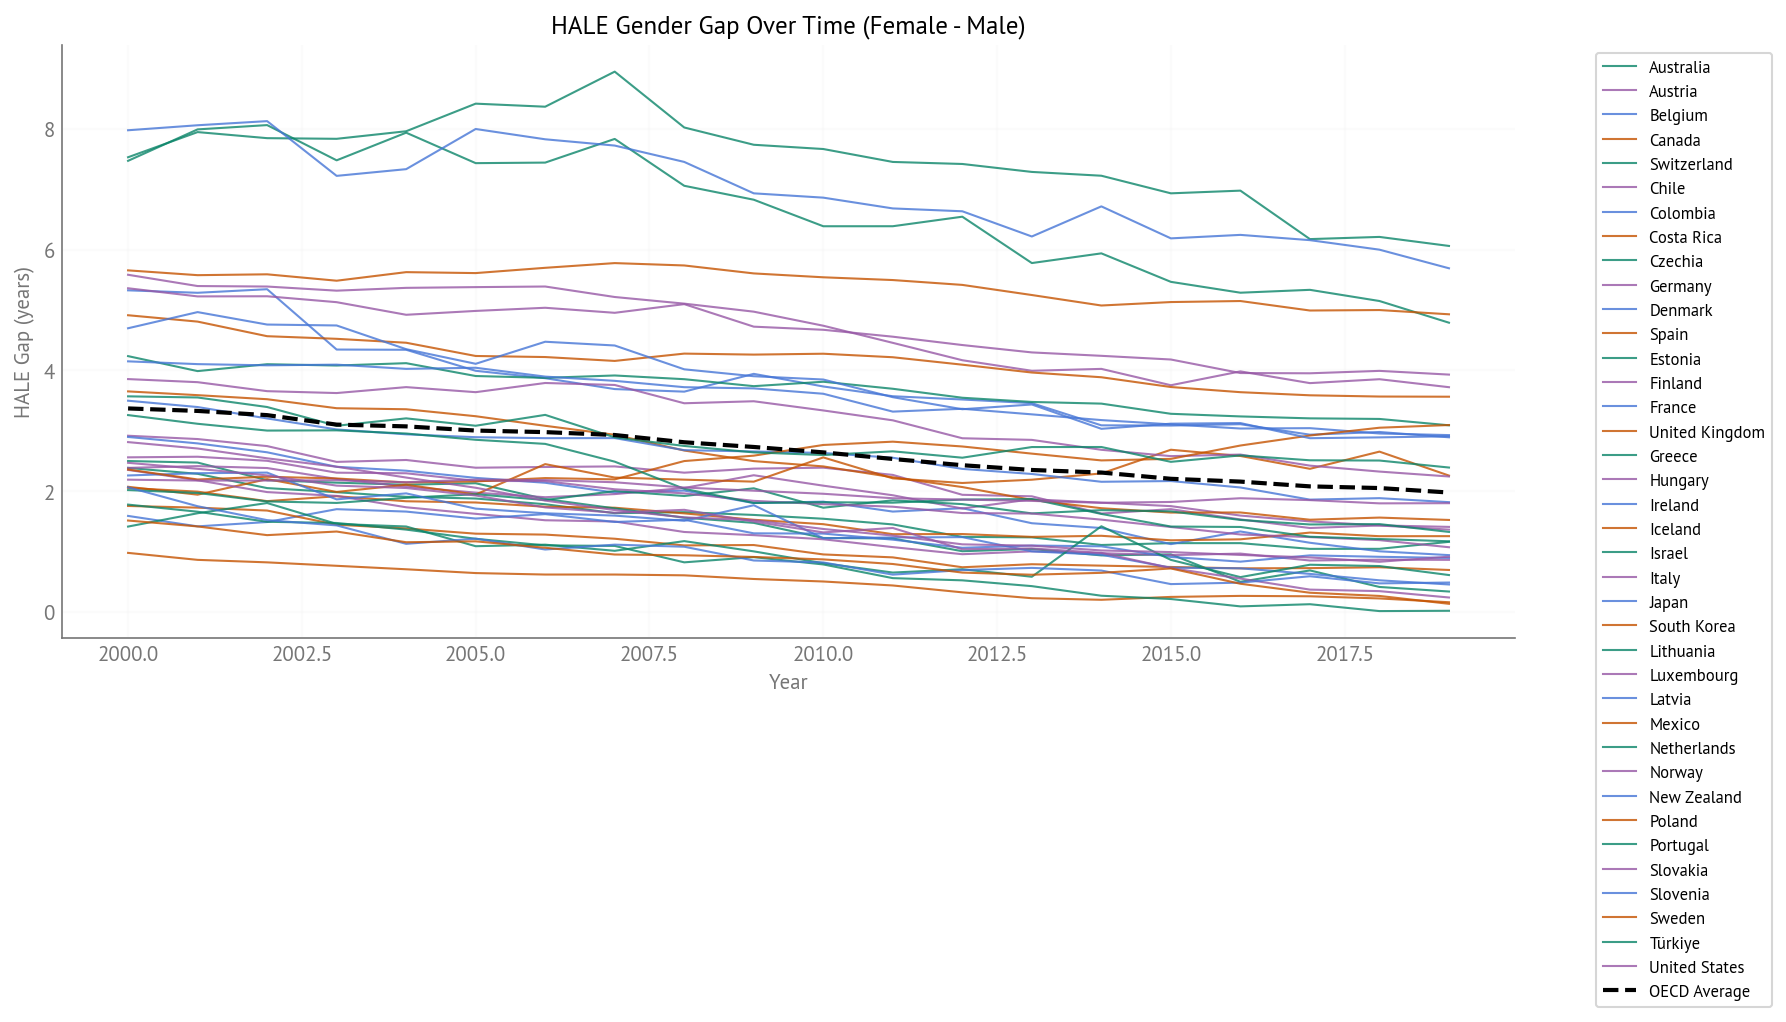
Figure 5:HALE Gender Gap Over Time (2000-2019) - All OECD Countries
The figure above shows HALE gap trends for all OECD countries. Several patterns are evident:
Wide variation: Gaps range from near zero (Netherlands, Switzerland) to over 6 years (Latvia, Lithuania)
Stability: Most countries show relatively stable gaps over time, with gradual changes
Convergence: Some countries (notably in Northern Europe) have gaps close to zero, demonstrating that large gaps are not inevitable
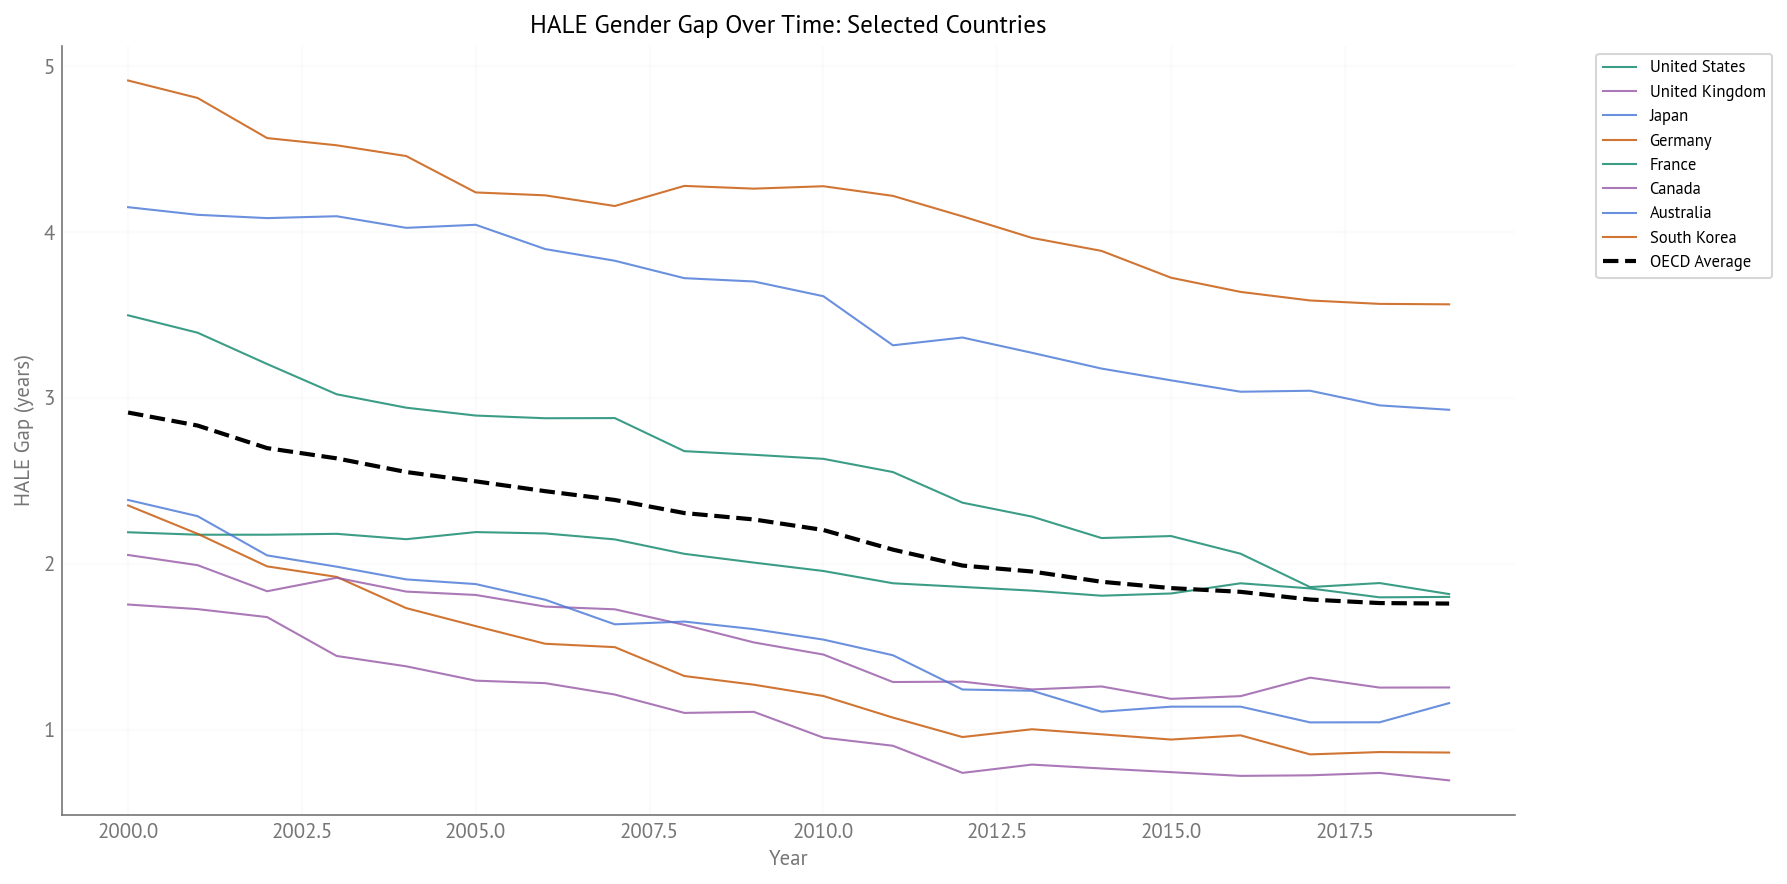
Figure 6:HALE Gender Gap Over Time (2000-2019) - Selected Countries
The selected countries view highlights key examples:
Netherlands: Consistently near-zero gap, showing that gender equity in healthy life expectancy is achievable
United States: Moderate gap (~3-4 years) with slight narrowing over time
Latvia/Lithuania: Large gaps (6-7 years) that have remained relatively stable
OECD Average: Shows a gradual narrowing trend, suggesting overall improvement
Life Expectancy Gap Trends
The Life Expectancy gap represents the difference in overall Life Expectancy between women and men (Female - Male, in years).
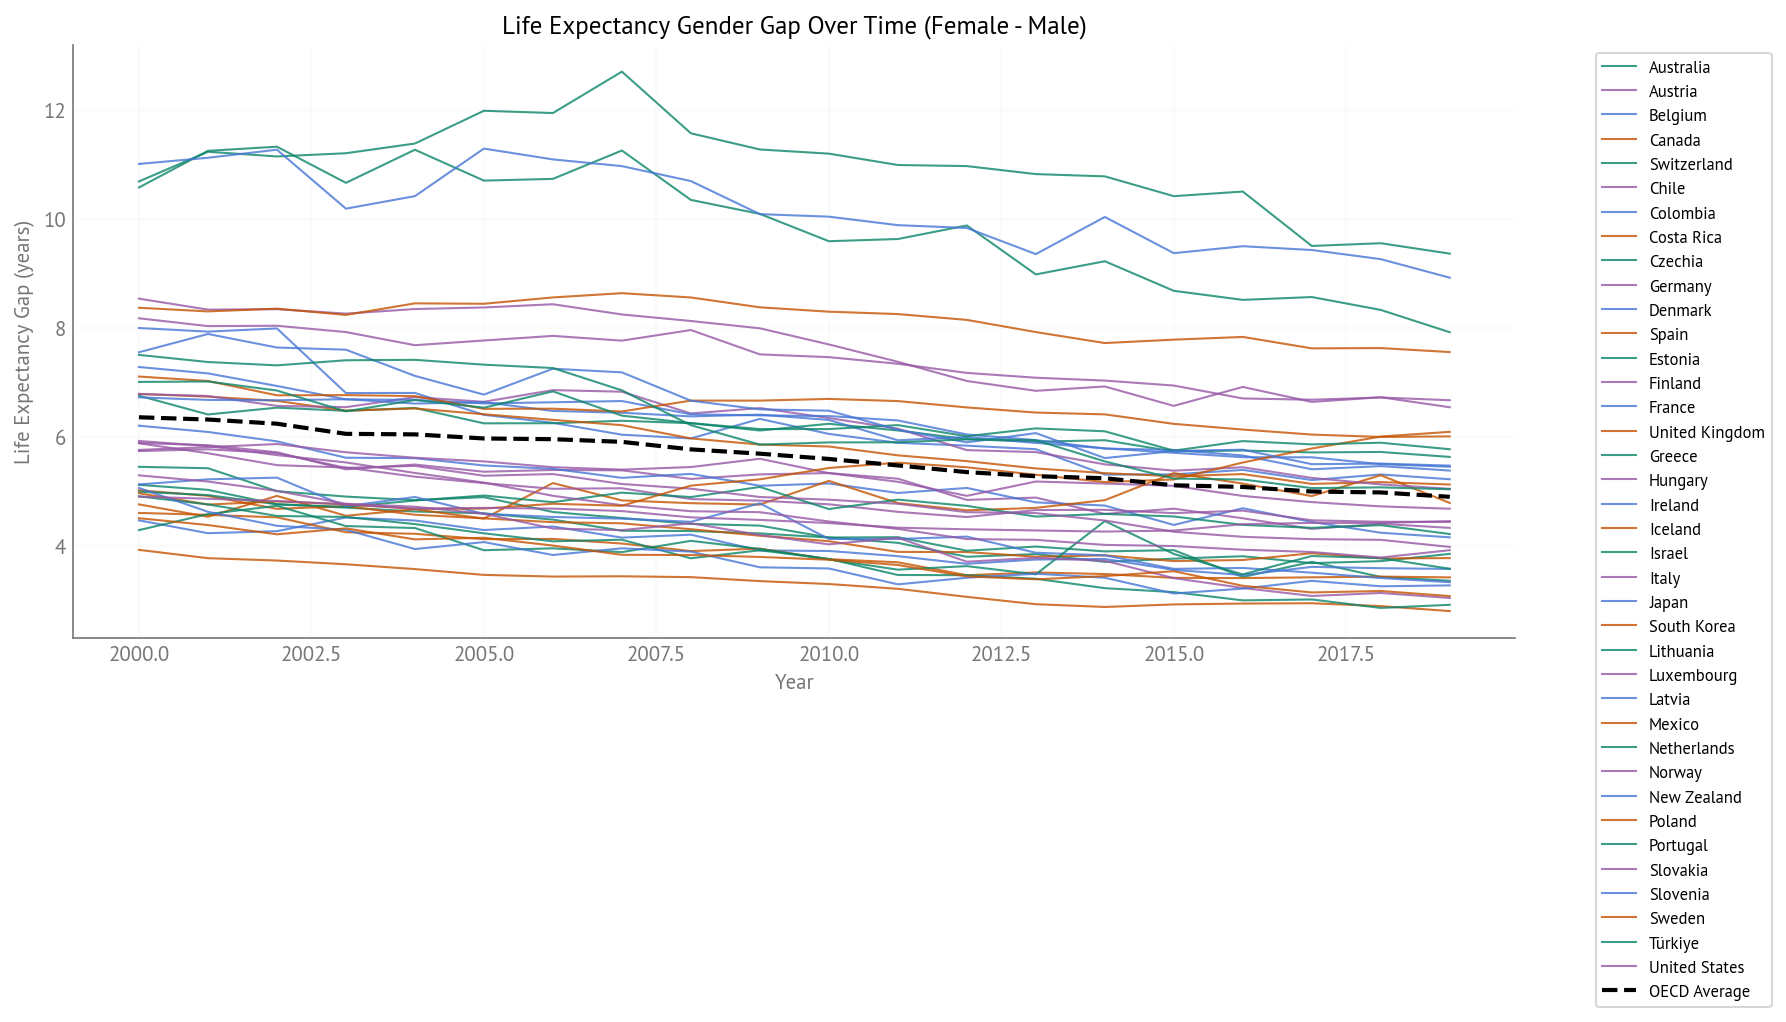
Figure 7:Life Expectancy Gender Gap Over Time (2000-2019) - All OECD Countries
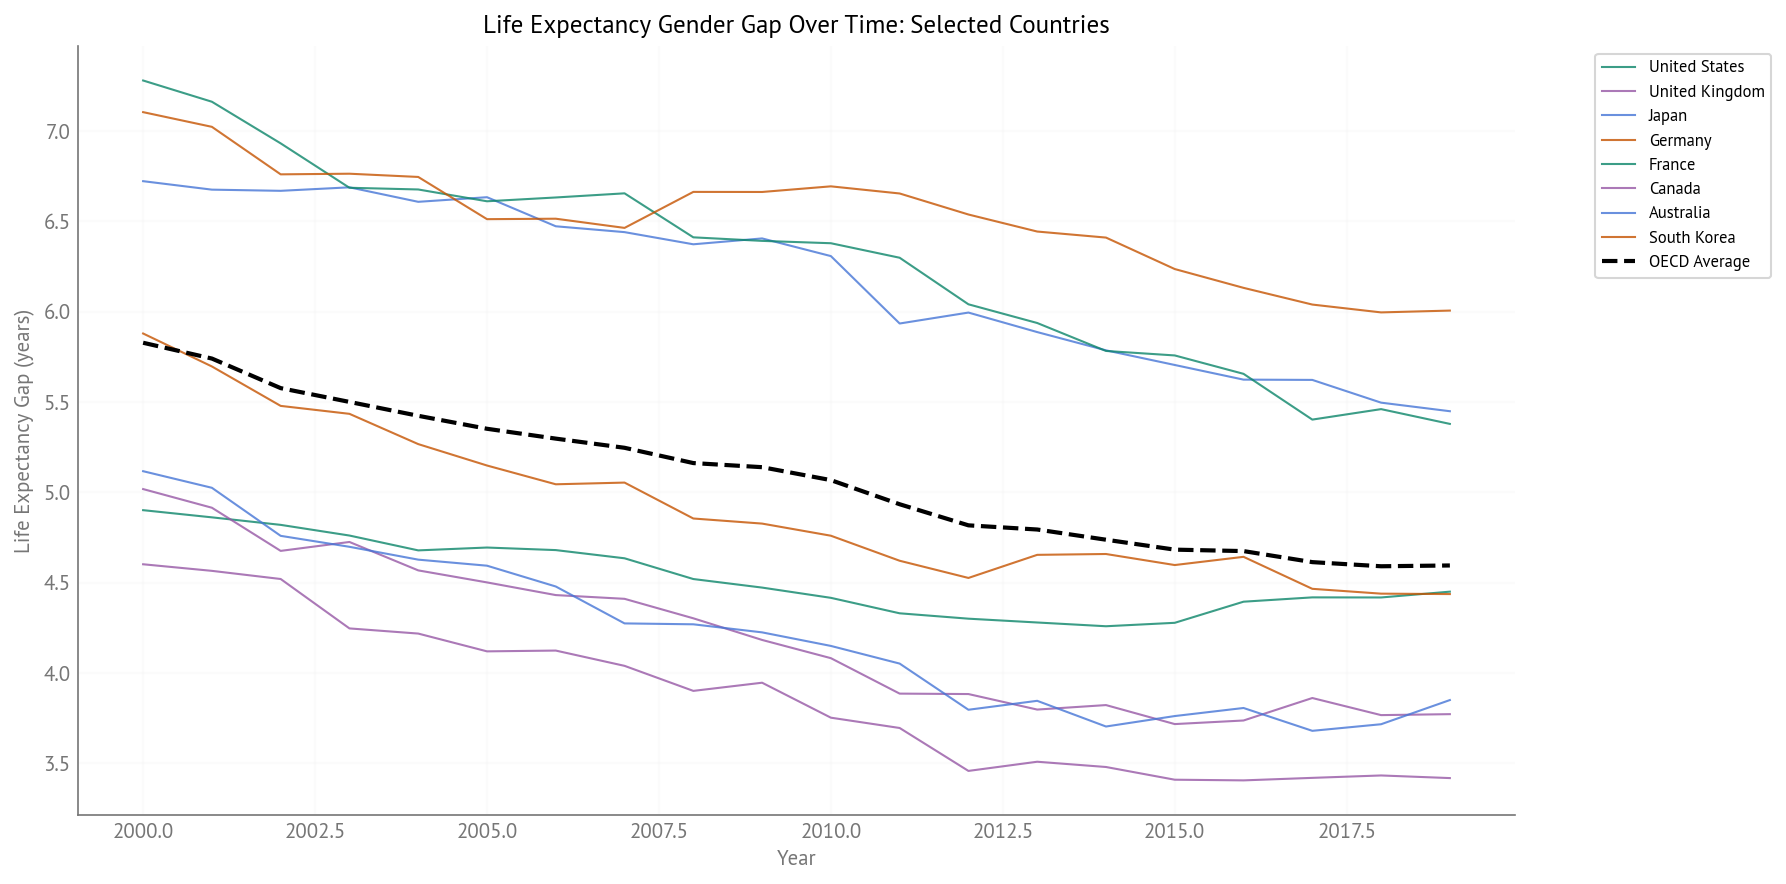
Figure 8:Life Expectancy Gender Gap Over Time (2000-2019) - Selected Countries
Life Expectancy gaps show similar patterns to HALE gaps, but are generally larger (since they include years lived in poor health). The OECD average shows a gradual narrowing trend over the two-decade period.
Value Changes: 2000 to 2019
The following table shows how HALE values changed for each country over the two-decade period:
| Country | HALE 2000 | HALE 2019 | Change |
|---|---|---|---|
| Japan | 71 | 73.5 | 2.52 |
| South Korea | 66.5 | 72.4 | 5.91 |
| Spain | 68.9 | 71.7 | 2.78 |
| Switzerland | 68.3 | 71.5 | 3.21 |
| Israel | 68.3 | 71.5 | 3.17 |
| Luxembourg | 67.8 | 71.4 | 3.65 |
| Sweden | 69.2 | 71.4 | 2.17 |
| Italy | 68.3 | 71.4 | 3.06 |
| Iceland | 69.1 | 71.4 | 2.26 |
| Norway | 67.8 | 71.2 | 3.37 |
| Netherlands | 68 | 71.1 | 3.02 |
| France | 68 | 70.7 | 2.73 |
| Ireland | 66.3 | 70.5 | 4.15 |
| Austria | 67.5 | 70.4 | 2.88 |
| Denmark | 66.6 | 70.3 | 3.68 |
| Canada | 68.5 | 70.3 | 1.78 |
| Australia | 68.1 | 70.3 | 2.16 |
| Slovenia | 65.9 | 70.2 | 4.33 |
| Finland | 66.8 | 70.2 | 3.37 |
| Belgium | 67.2 | 70.1 | 2.9 |
| Portugal | 66 | 70 | 3.97 |
| Greece | 67.8 | 69.8 | 2.05 |
| New Zealand | 67.2 | 69.7 | 2.49 |
| United Kingdom | 67.2 | 69.7 | 2.49 |
| Germany | 67.4 | 69.4 | 2.05 |
| Chile | 66.2 | 69.3 | 3.12 |
| Costa Rica | 67.9 | 69.2 | 1.36 |
| Czechia | 65.3 | 68.5 | 3.19 |
| Estonia | 61.8 | 68.2 | 6.39 |
| Colombia | 63.4 | 67.9 | 4.51 |
| Poland | 64.2 | 67.5 | 3.38 |
| Slovakia | 63.9 | 67.4 | 3.59 |
| Türkiye | 63.6 | 67.2 | 3.56 |
| Hungary | 62.2 | 66.5 | 4.31 |
| Lithuania | 62.5 | 66.1 | 3.63 |
| United States | 65.3 | 66 | 0.74 |
| Latvia | 61.1 | 65.9 | 4.75 |
| Mexico | 64.1 | 65.5 | 1.37 |
The following table shows how Life Expectancy values changed for each country over the two-decade period:
| Country | Life Expectancy 2000 | Life Expectancy 2019 | Change |
|---|---|---|---|
| Japan | 81.4 | 84.4 | 2.99 |
| South Korea | 75.8 | 83.6 | 7.77 |
| Switzerland | 79.6 | 83.4 | 3.82 |
| Spain | 79.1 | 83.1 | 4.01 |
| Italy | 79.3 | 82.9 | 3.65 |
| Luxembourg | 78.3 | 82.8 | 4.47 |
| Sweden | 79.5 | 82.7 | 3.17 |
| Australia | 79.7 | 82.7 | 2.96 |
| Norway | 78.5 | 82.6 | 4.14 |
| Israel | 78.5 | 82.5 | 4.05 |
| Iceland | 79.7 | 82.5 | 2.82 |
| France | 78.9 | 82.5 | 3.59 |
| Netherlands | 77.9 | 82.3 | 4.36 |
| Canada | 79 | 82 | 2.98 |
| Ireland | 76.4 | 81.9 | 5.5 |
| New Zealand | 78.5 | 81.8 | 3.27 |
| Finland | 77.5 | 81.6 | 4.12 |
| Austria | 78 | 81.6 | 3.57 |
| Belgium | 77.6 | 81.6 | 3.94 |
| Slovenia | 76 | 81.3 | 5.35 |
| Denmark | 76.9 | 81.3 | 4.38 |
| Portugal | 76.6 | 81.3 | 4.69 |
| United Kingdom | 77.8 | 81.2 | 3.42 |
| Chile | 76.8 | 81 | 4.24 |
| Germany | 78 | 81 | 2.99 |
| Greece | 78.5 | 80.9 | 2.44 |
| Costa Rica | 78.2 | 80.3 | 2.1 |
| Czechia | 75 | 79.1 | 4.12 |
| United States | 76.6 | 78.8 | 2.15 |
| Estonia | 70.9 | 78.7 | 7.74 |
| Colombia | 72.6 | 77.9 | 5.3 |
| Poland | 73.7 | 77.7 | 4.03 |
| Türkiye | 73.4 | 77.6 | 4.23 |
| Slovakia | 73.3 | 77.6 | 4.25 |
| Hungary | 71.4 | 76.2 | 4.88 |
| Lithuania | 71.9 | 76.1 | 4.2 |
| Mexico | 74.2 | 75.8 | 1.63 |
| Latvia | 70.1 | 75.5 | 5.38 |
Key Findings from Value Changes:
Most countries show increases: The vast majority of OECD countries have seen their HALE and Life Expectancy increase from 2000 to 2019
Substantial improvements: Many countries gained 2-4 years in HALE and 3-5 years in Life Expectancy over the period
Variation in improvement rates: Some countries show faster improvement than others, reflecting different public health trajectories
Overall progress: The widespread increases demonstrate overall improvements in population health across OECD countries
Gap Changes: 2000 to 2019
The following table shows how HALE gaps changed for each country over the two-decade period:
| Country | Gap 2000 | Gap 2019 | Change |
|---|---|---|---|
| Lithuania | 7.53 | 6.06 | -1.47 |
| Latvia | 7.98 | 5.69 | -2.29 |
| Poland | 5.66 | 4.93 | -0.73 |
| Estonia | 7.47 | 4.79 | -2.68 |
| Slovakia | 5.36 | 3.93 | -1.43 |
| Hungary | 5.58 | 3.72 | -1.86 |
| South Korea | 4.91 | 3.56 | -1.35 |
| Mexico | 2.36 | 3.1 | 0.74 |
| Czechia | 4.24 | 3.09 | -1.15 |
| Japan | 4.15 | 2.93 | -1.22 |
| Slovenia | 4.7 | 2.91 | -1.79 |
| Colombia | 5.33 | 2.89 | -2.43 |
| Portugal | 3.57 | 2.39 | -1.18 |
| Costa Rica | 2.07 | 2.26 | 0.19 |
| Finland | 3.86 | 2.24 | -1.61 |
| France | 3.5 | 1.82 | -1.68 |
| United States | 2.19 | 1.8 | -0.39 |
| Spain | 3.65 | 1.52 | -2.13 |
| Chile | 2.39 | 1.41 | -0.98 |
| Austria | 2.92 | 1.36 | -1.55 |
| Greece | 2.02 | 1.33 | -0.69 |
| Canada | 2.05 | 1.25 | -0.8 |
| Türkiye | 3.26 | 1.17 | -2.09 |
| Australia | 2.39 | 1.16 | -1.22 |
| Italy | 2.56 | 1.07 | -1.49 |
| Belgium | 2.9 | 0.94 | -1.96 |
| Luxembourg | 2.81 | 0.91 | -1.9 |
| Denmark | 1.59 | 0.89 | -0.7 |
| Germany | 2.35 | 0.86 | -1.49 |
| United Kingdom | 1.75 | 0.69 | -1.06 |
| Israel | 1.41 | 0.61 | -0.8 |
| New Zealand | 2.06 | 0.49 | -1.58 |
| Ireland | 2.26 | 0.45 | -1.81 |
| Switzerland | 2.5 | 0.34 | -2.16 |
| Norway | 2.47 | 0.24 | -2.23 |
| Iceland | 0.98 | 0.16 | -0.82 |
| Sweden | 1.51 | 0.13 | -1.38 |
| Netherlands | 1.78 | 0.02 | -1.76 |
The following table shows how Life Expectancy gaps changed for each country over the two-decade period:
| Country | Gap 2000 | Gap 2019 | Change |
|---|---|---|---|
| Lithuania | 10.7 | 9.36 | -1.33 |
| Latvia | 11 | 8.92 | -2.09 |
| Estonia | 10.6 | 7.92 | -2.66 |
| Poland | 8.37 | 7.55 | -0.81 |
| Slovakia | 8.17 | 6.67 | -1.5 |
| Hungary | 8.54 | 6.54 | -1.99 |
| Mexico | 4.96 | 6.09 | 1.13 |
| South Korea | 7.11 | 6.01 | -1.1 |
| Portugal | 7.01 | 5.77 | -1.24 |
| Czechia | 6.75 | 5.63 | -1.12 |
| Slovenia | 7.55 | 5.47 | -2.08 |
| Japan | 6.72 | 5.45 | -1.27 |
| France | 7.28 | 5.38 | -1.9 |
| Colombia | 8 | 5.22 | -2.78 |
| Spain | 6.79 | 5.12 | -1.66 |
| Finland | 6.78 | 5.04 | -1.74 |
| Türkiye | 7.5 | 5.04 | -2.47 |
| Costa Rica | 4.76 | 4.78 | 0.03 |
| Chile | 5.76 | 4.68 | -1.08 |
| United States | 4.9 | 4.45 | -0.45 |
| Germany | 5.88 | 4.44 | -1.44 |
| Austria | 5.89 | 4.33 | -1.56 |
| Greece | 4.99 | 4.21 | -0.78 |
| Belgium | 6.2 | 4.15 | -2.05 |
| Italy | 5.74 | 3.98 | -1.76 |
| Luxembourg | 5.92 | 3.92 | -2 |
| Australia | 5.12 | 3.85 | -1.27 |
| Canada | 5.02 | 3.77 | -1.25 |
| Israel | 4.29 | 3.58 | -0.71 |
| Denmark | 4.47 | 3.57 | -0.89 |
| United Kingdom | 4.6 | 3.42 | -1.18 |
| Switzerland | 5.45 | 3.36 | -2.09 |
| Ireland | 5.12 | 3.33 | -1.8 |
| New Zealand | 5.06 | 3.27 | -1.79 |
| Sweden | 4.5 | 3.07 | -1.43 |
| Norway | 5.29 | 3.04 | -2.25 |
| Netherlands | 4.91 | 2.91 | -1.99 |
| Iceland | 3.92 | 2.8 | -1.12 |
Key Findings from Gap Changes:
Most countries show narrowing gaps: The majority of OECD countries have seen their gender gaps decrease from 2000 to 2019
Variation in magnitude: Changes range from substantial narrowing (>1 year) to slight widening
Consistent patterns: Countries that narrowed HALE gaps also tended to narrow LE gaps
Positive examples: Several countries (e.g., Netherlands, Switzerland) maintain or achieved near-zero gaps
Relationship between Value and Gap Changes:
Countries can improve in both absolute values and gender equity simultaneously
Some countries show large increases in HALE/LE while also narrowing gender gaps
The combination of increasing values and narrowing gaps represents the best outcome—improving health for everyone while reducing disparities
Summary
Overall Values (HALE and Life Expectancy)
| Target | Highest Mean Country | Highest Mean Value | Lowest Mean Country | Lowest Mean Value | Highest Slope Country | Highest Slope Value | Lowest Slope Country | Lowest Slope Value |
|---|---|---|---|---|---|---|---|---|
| HALE | Japan | 72.3 | Latvia | 63.4 | Estonia | 0.367 | United States | 0.0474 |
| Life Expectancy | Japan | 83 | Latvia | 72.5 | Estonia | 0.443 | Mexico | 0.0851 |
Gender Gaps (HALE Gap and Life Expectancy Gap)
| Target | Highest Mean Country | Highest Mean Value | Lowest Mean Country | Lowest Mean Value | Highest Slope Country | Highest Slope Value | Lowest Slope Country | Lowest Slope Value |
|---|---|---|---|---|---|---|---|---|
| HALE Gap | Lithuania | 7.5 | Iceland | 0.501 | Mexico | 0.0452 | Estonia | -0.173 |
| Life Expectancy Gap | Lithuania | 11 | Iceland | 3.28 | Mexico | 0.0648 | Estonia | -0.175 |
Health Indicator Trends
This section examines temporal trends for each of the 10 health indicators used in the predictive models. For each indicator, we show:
Overall rates (Mid values): Average of male and female rates, representing the overall mortality burden
Gender gaps (Gap values): Difference between male and female rates (Male - Female)
Alcohol Use Disorders
Alcohol use disorders represent deaths directly attributable to alcohol consumption.
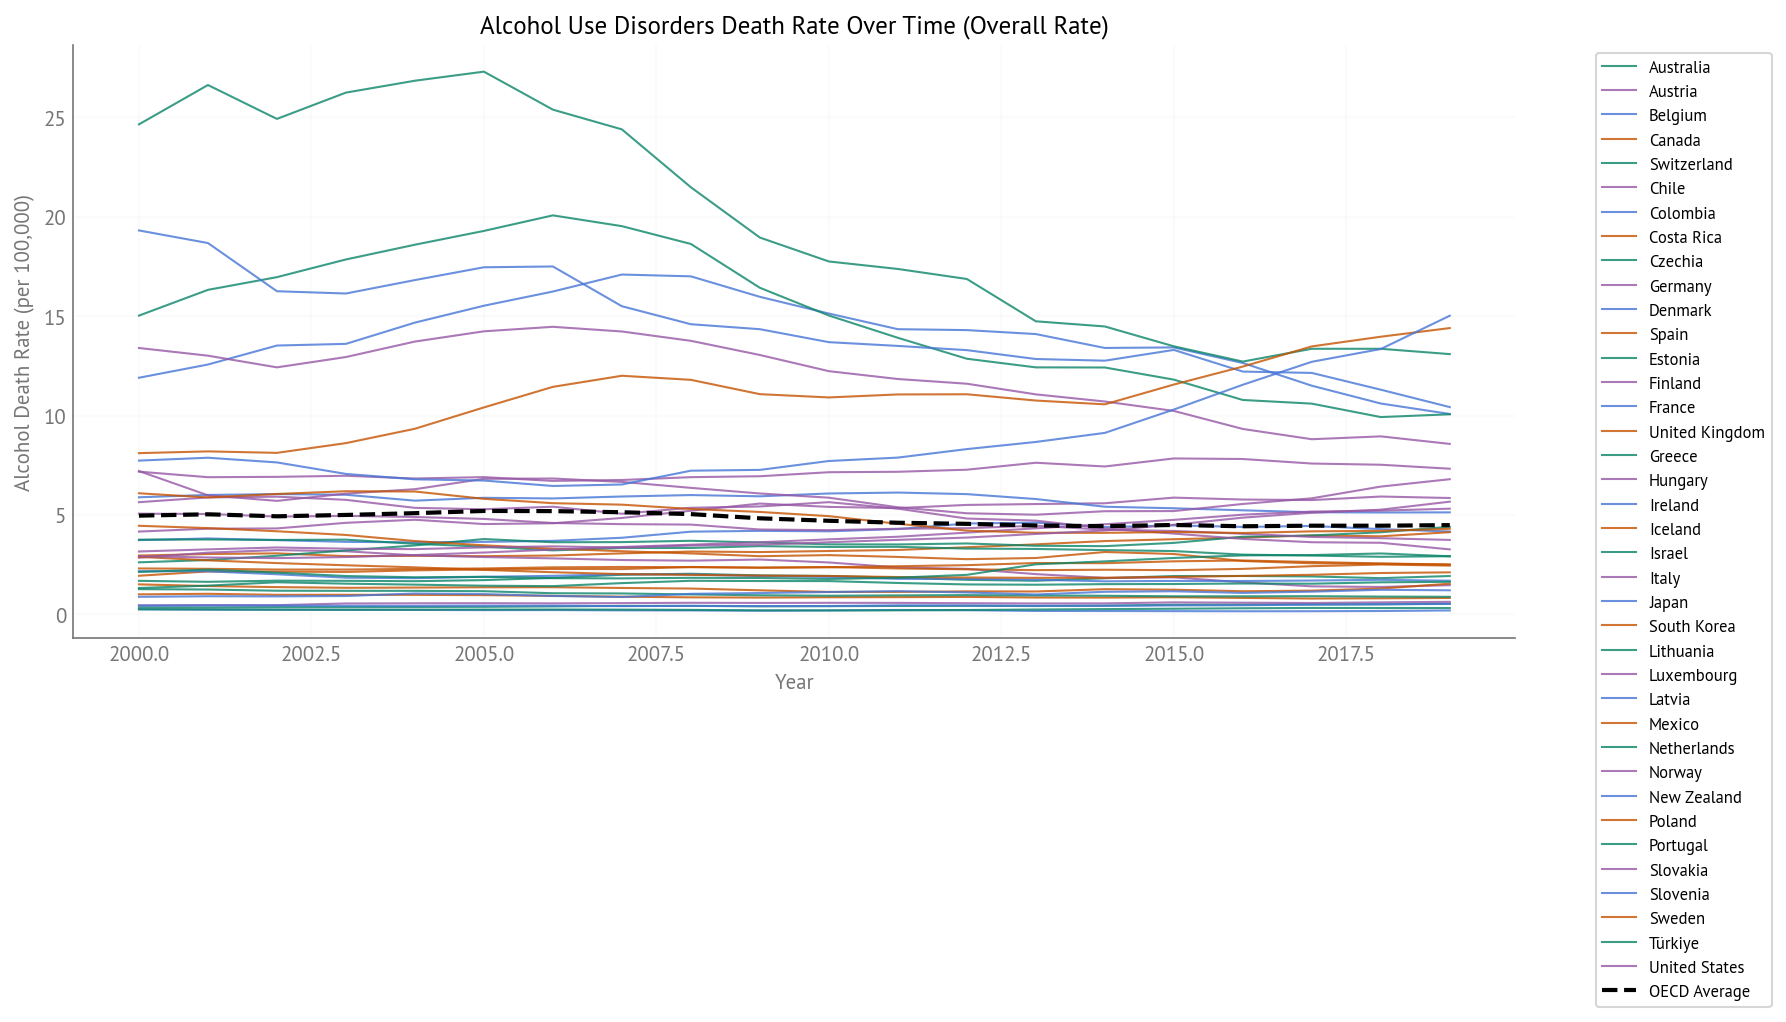
Figure 9:Alcohol Use Disorders Death Rate Over Time (2000-2019) - All OECD Countries
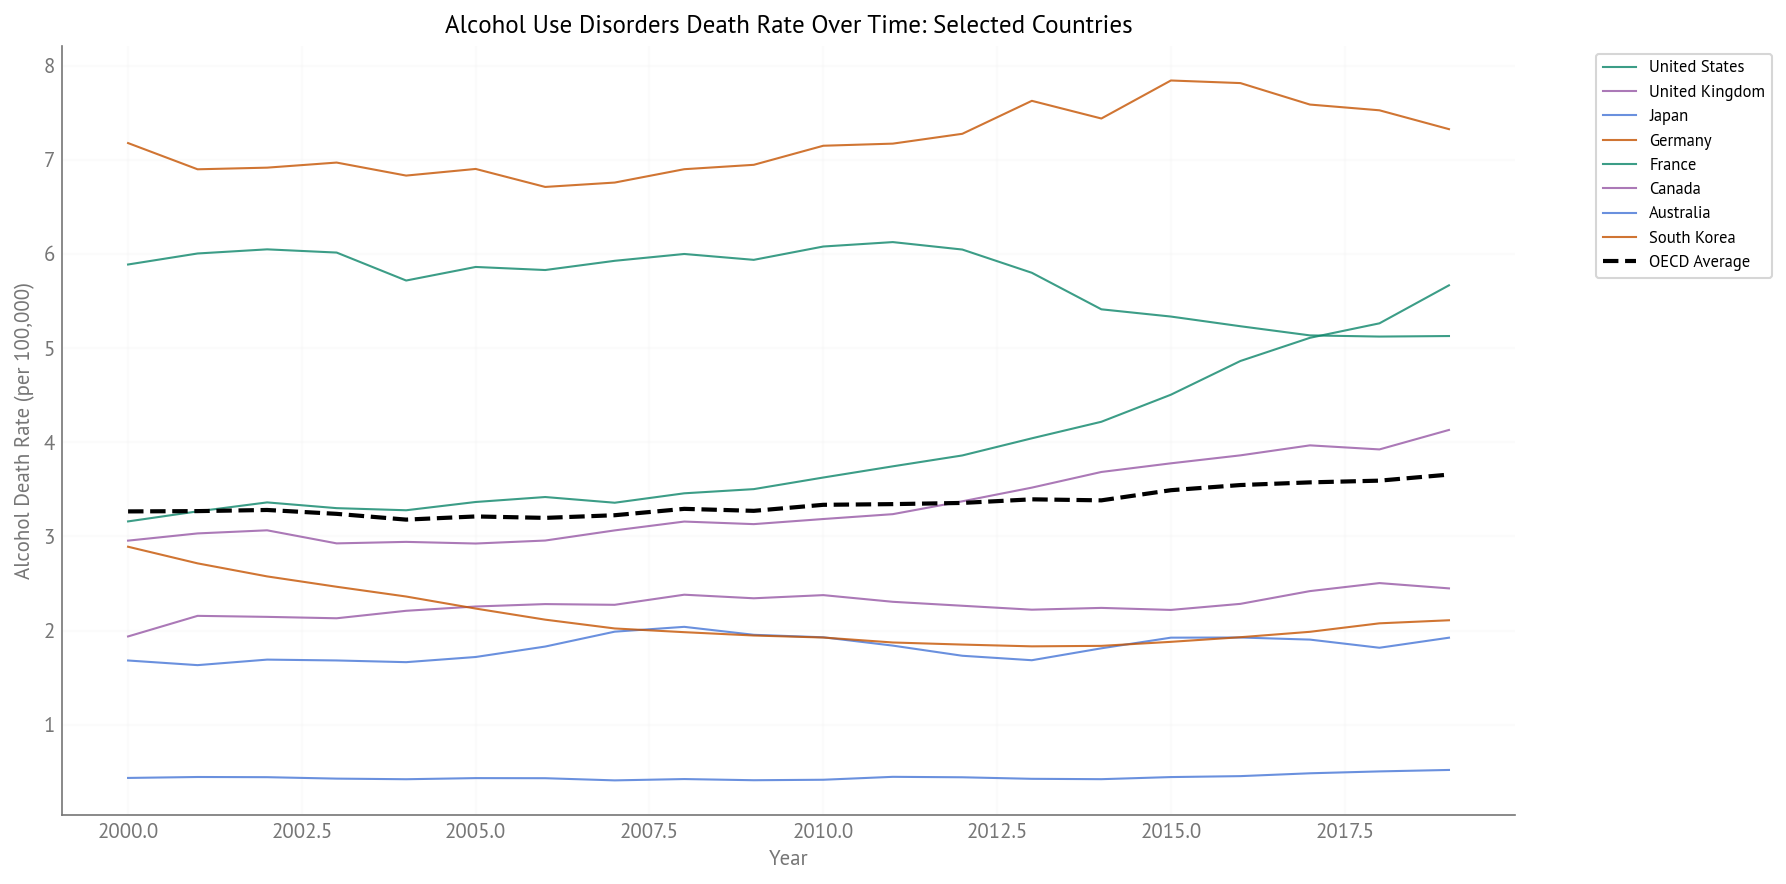
Figure 10:Alcohol Use Disorders Death Rate Over Time (2000-2019) - Selected Countries
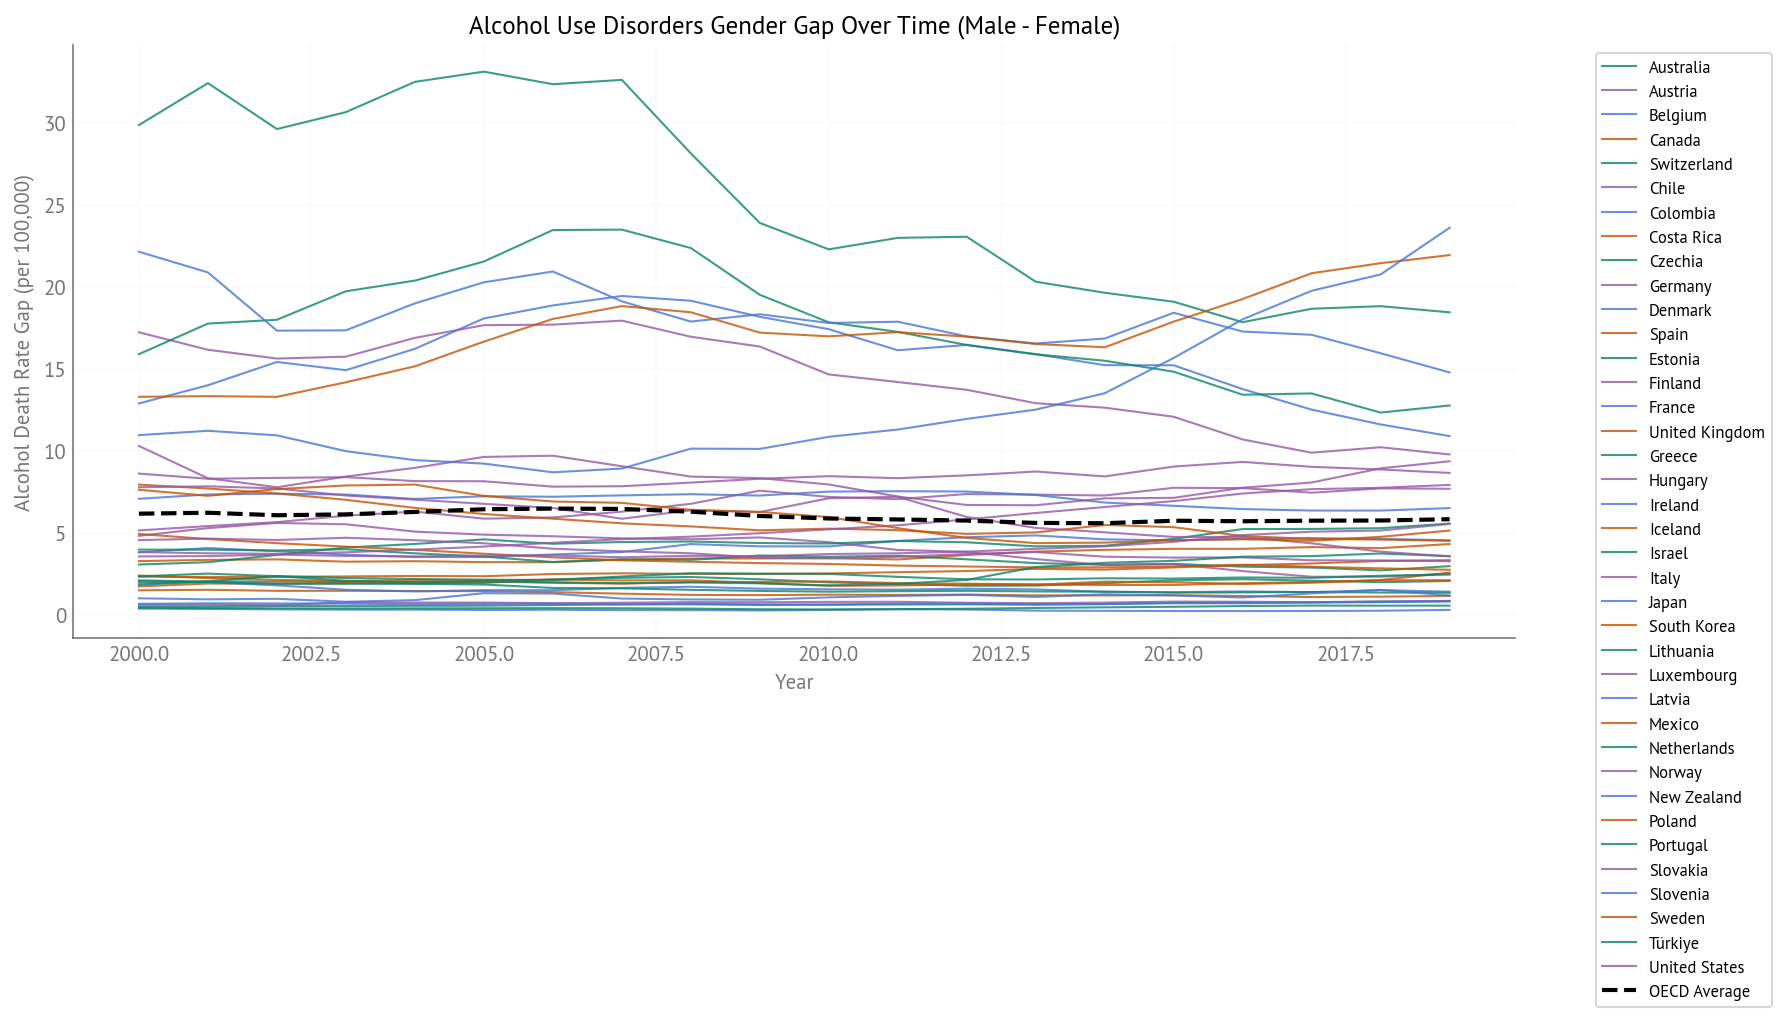
Figure 11:Alcohol Use Disorders Gender Gap Over Time (2000-2019) - All OECD Countries
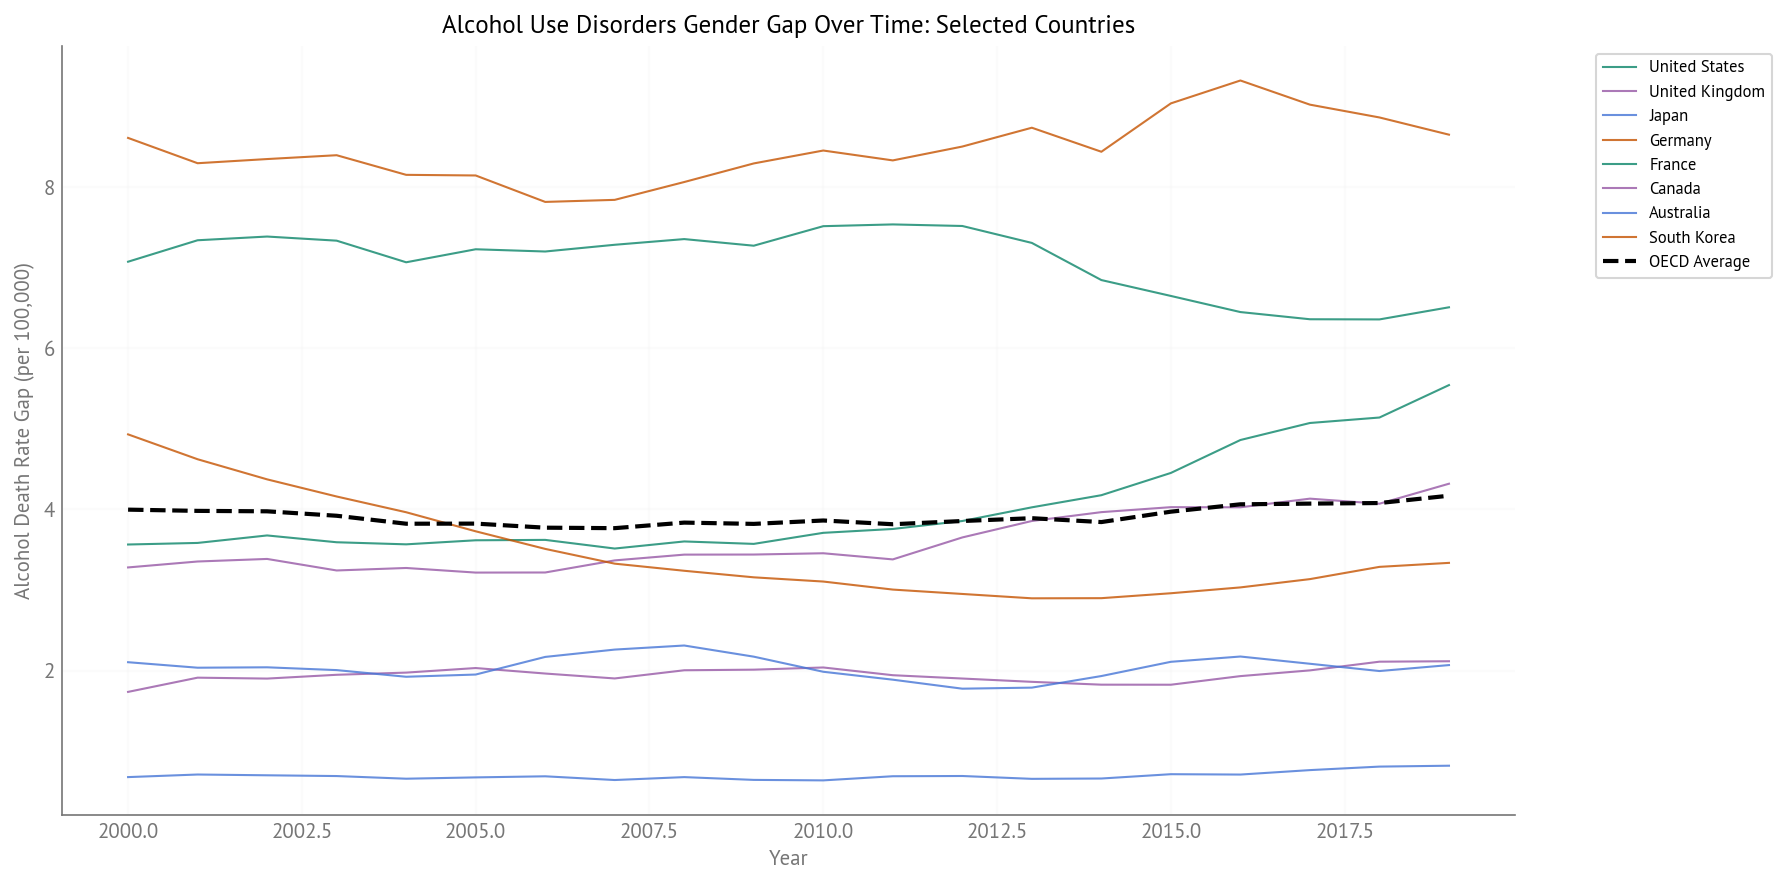
Figure 12:Alcohol Use Disorders Gender Gap Over Time (2000-2019) - Selected Countries
Key Observations:
High variation across countries: Rates range from very low (<5 per 100,000) to moderate (15-25 per 100,000)
Large gender gaps: Men consistently have much higher alcohol-related death rates than women
Declining trends in some countries: Several countries show decreasing rates over time, suggesting successful public health interventions
Cardiovascular Disease
Cardiovascular disease is one of the leading causes of death globally.
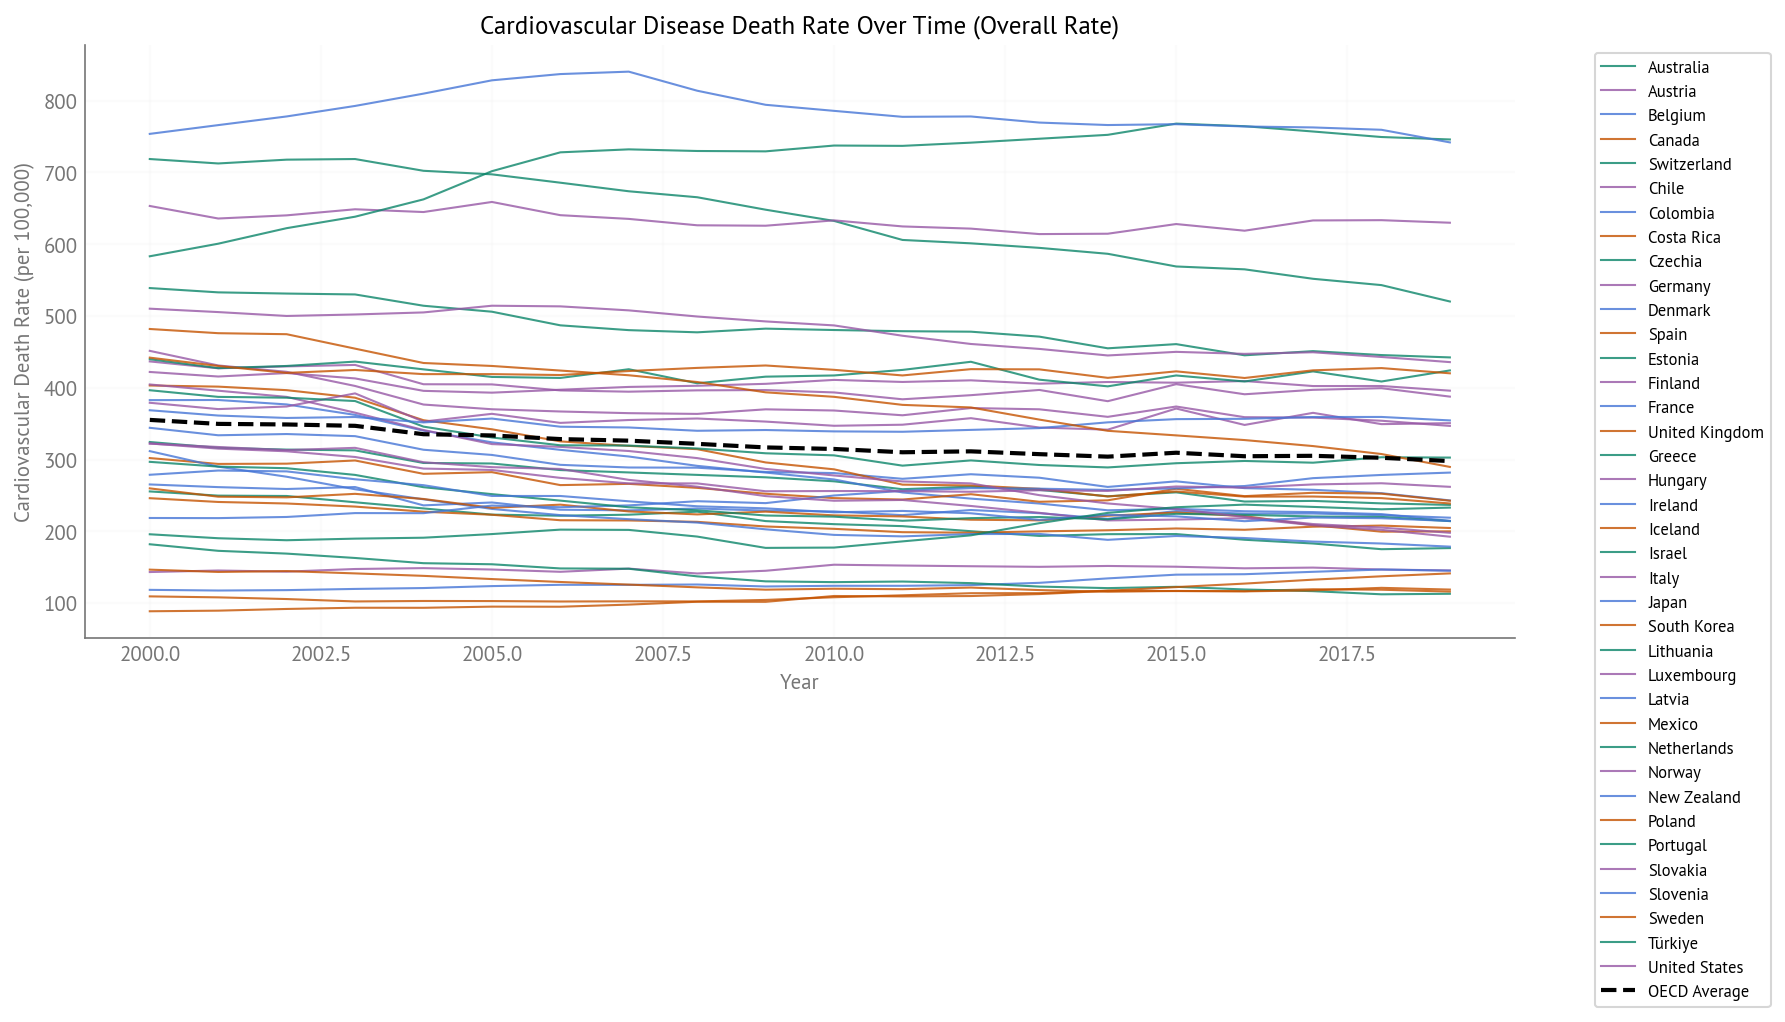
Figure 13:Cardiovascular Disease Death Rate Over Time (2000-2019) - All OECD Countries
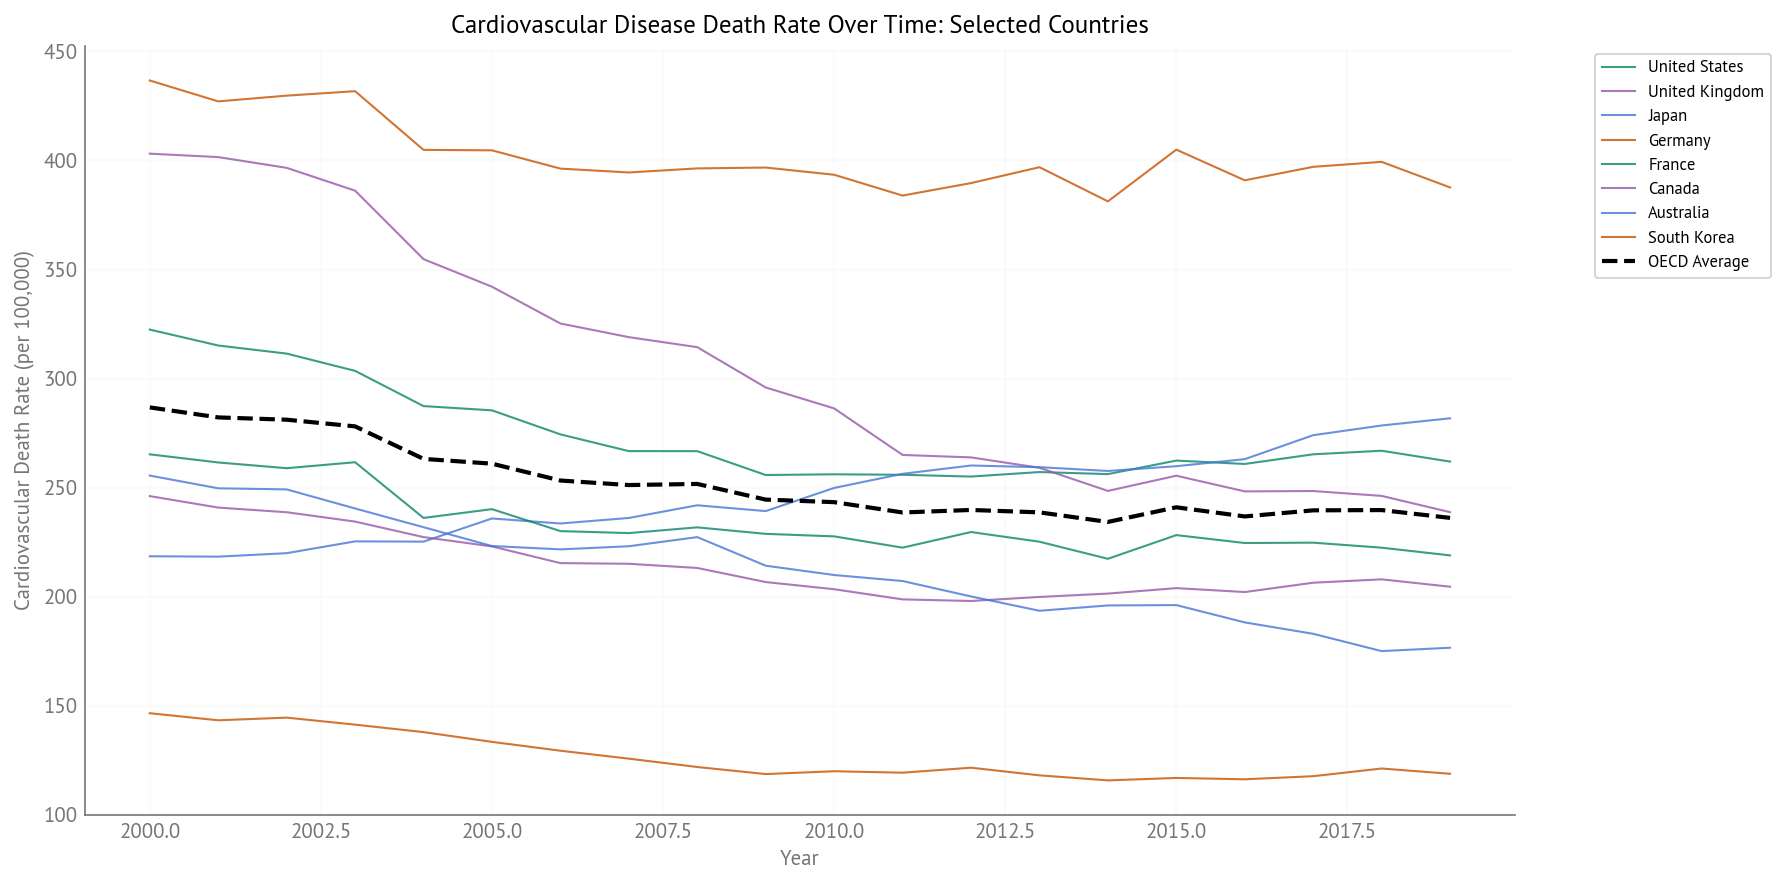
Figure 14:Cardiovascular Disease Death Rate Over Time (2000-2019) - Selected Countries
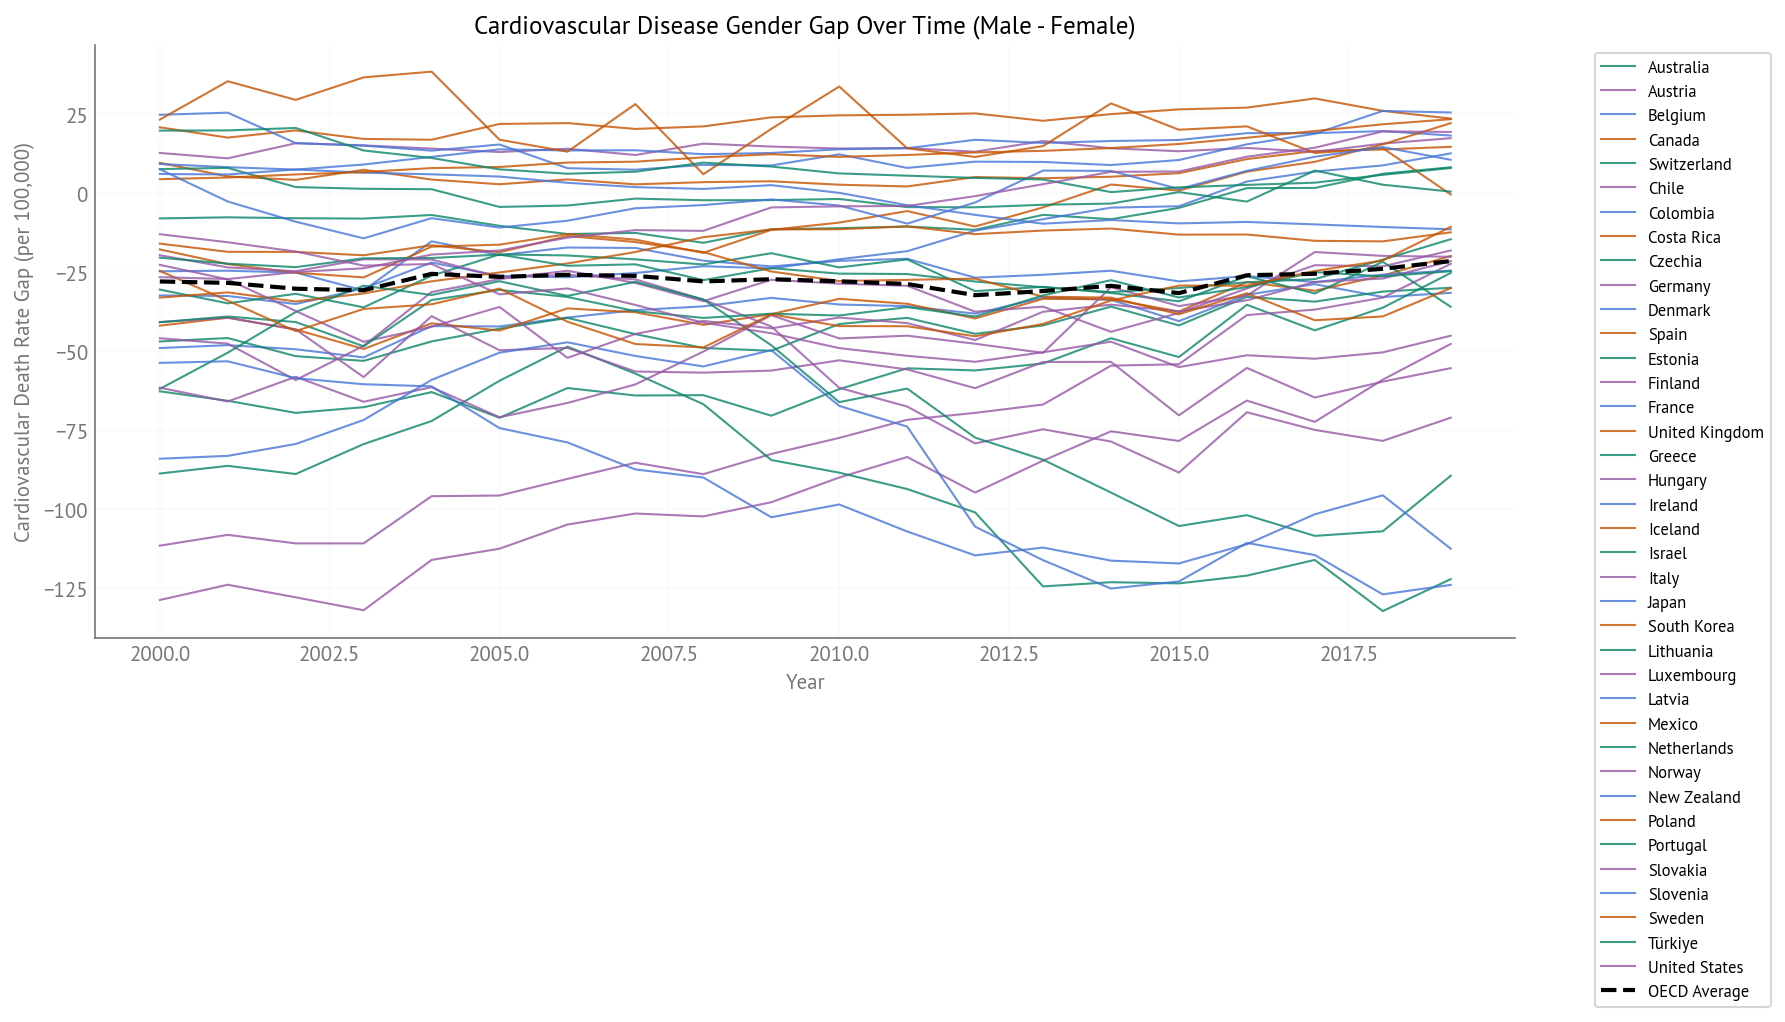
Figure 15:Cardiovascular Disease Gender Gap Over Time (2000-2019) - All OECD Countries
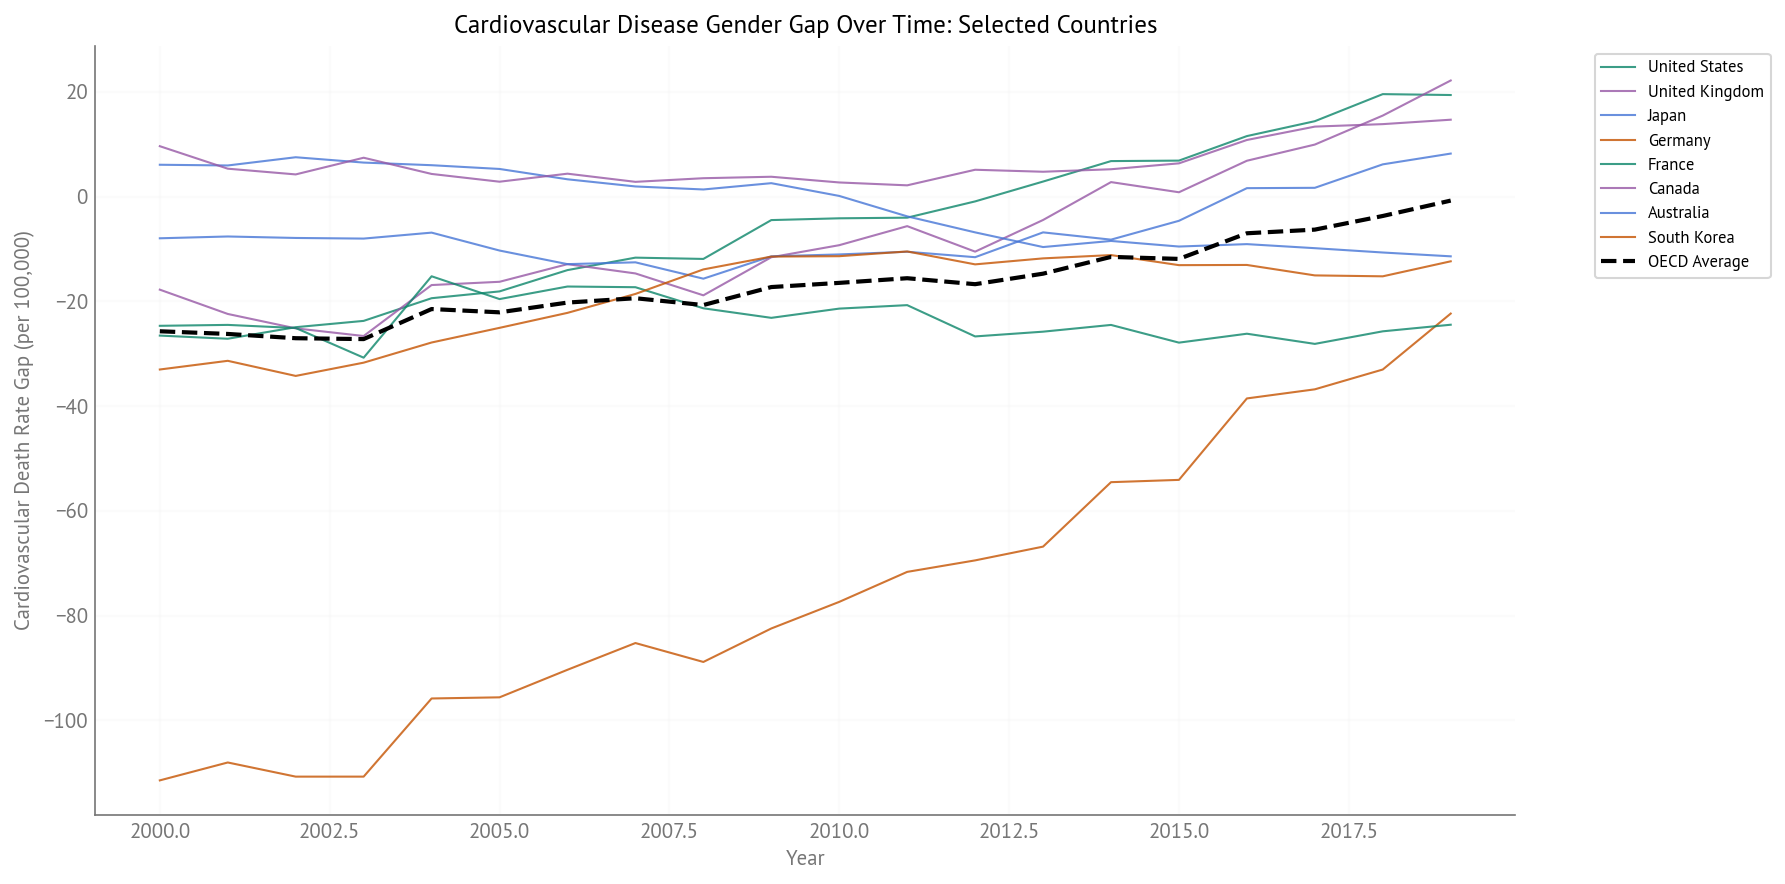
Figure 16:Cardiovascular Disease Gender Gap Over Time (2000-2019) - Selected Countries
Key Observations:
High overall rates: Cardiovascular disease has the highest death rates among all indicators
Declining trends: Most countries show substantial declines in cardiovascular death rates, reflecting successful prevention and treatment efforts
Moderate gender gaps: Men have higher rates, but the gap is smaller than for some other indicators (e.g., alcohol, suicide)
Narrowing gaps: Gender gaps have narrowed in many countries, suggesting improvements in men’s cardiovascular health
Chronic Respiratory Disease
Chronic respiratory diseases include conditions like COPD and asthma.
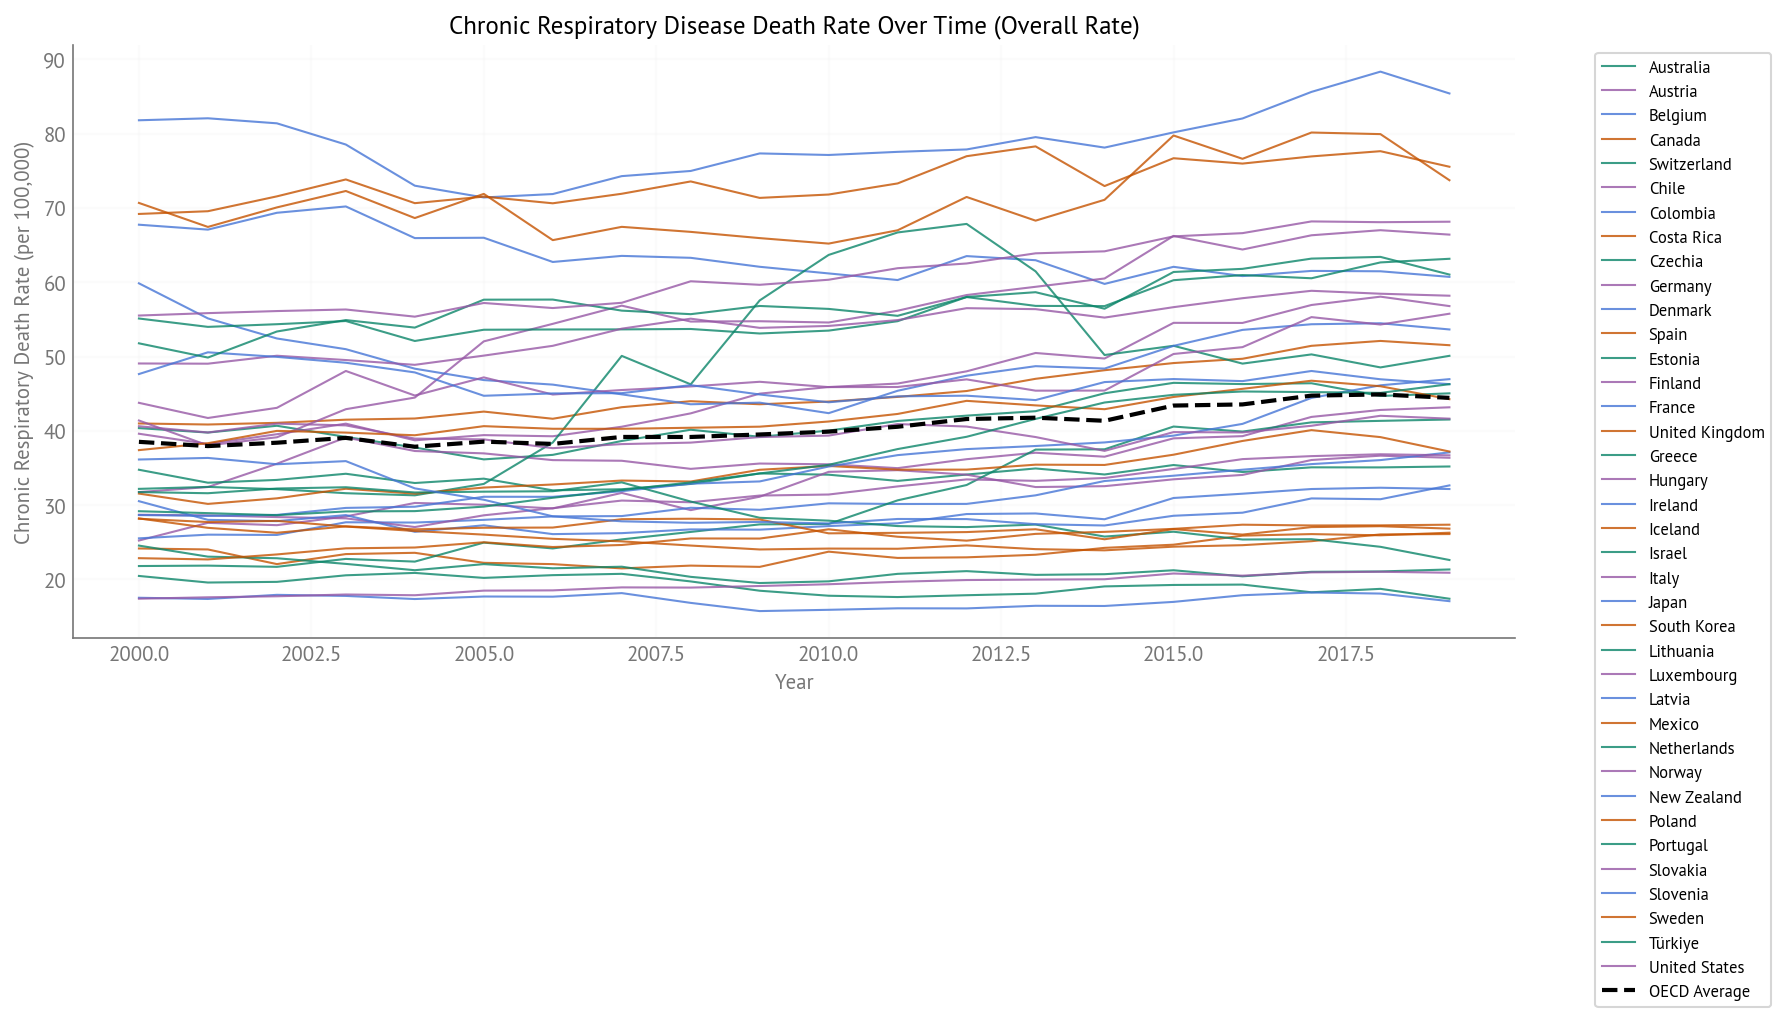
Figure 17:Chronic Respiratory Disease Death Rate Over Time (2000-2019) - All OECD Countries
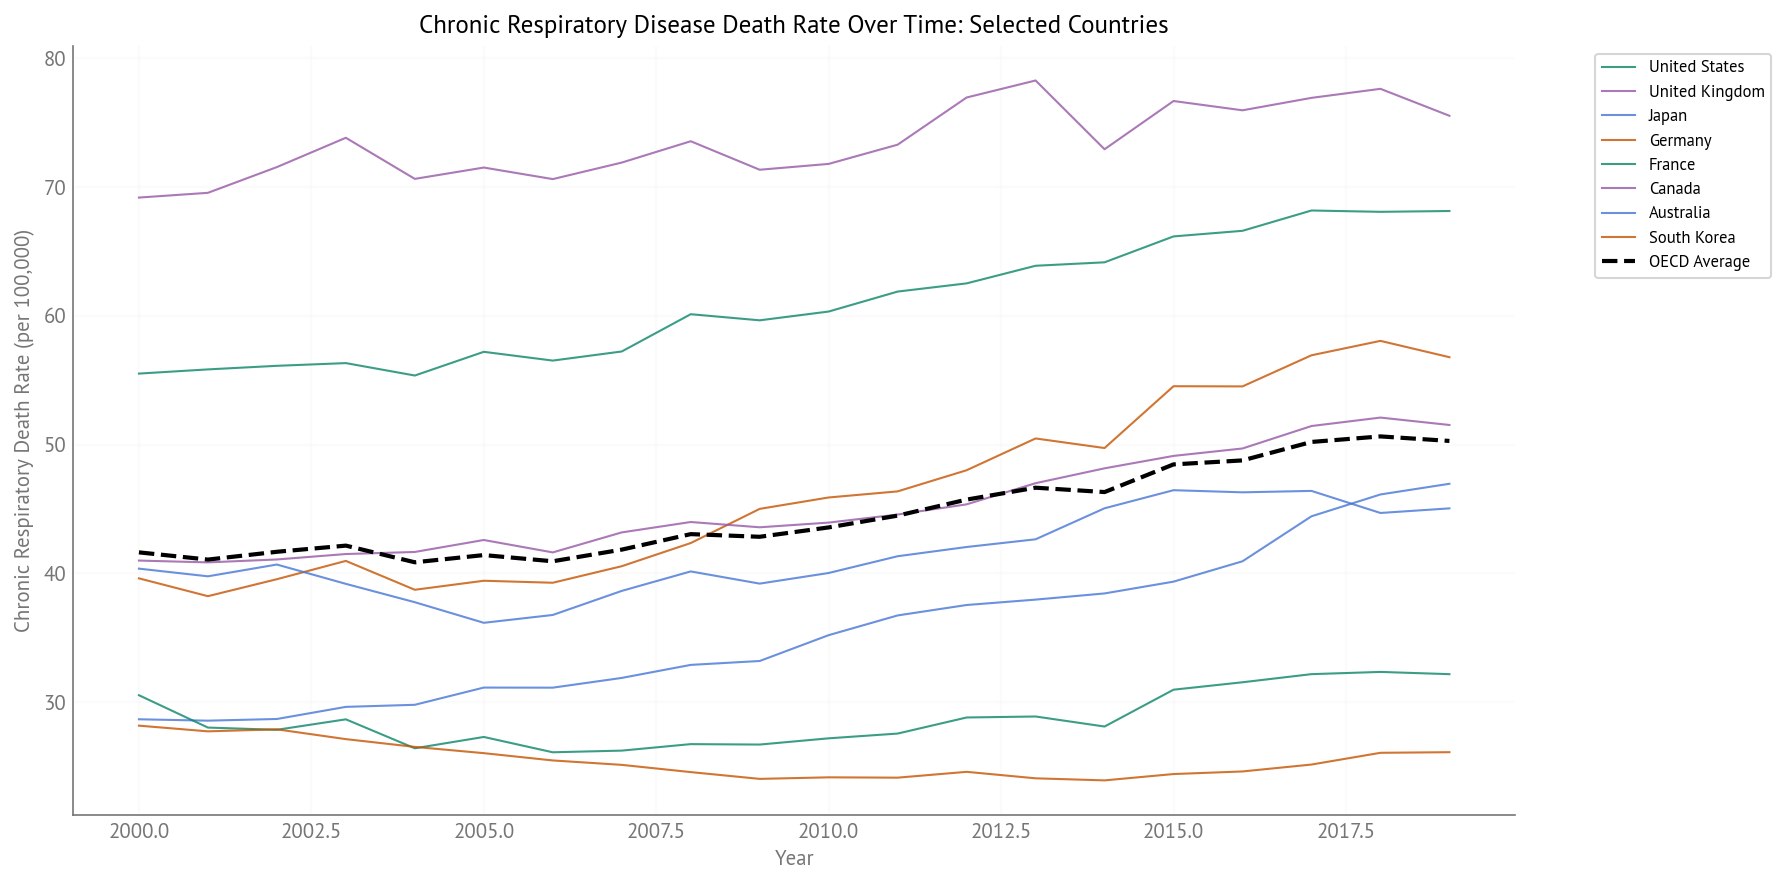
Figure 18:Chronic Respiratory Disease Death Rate Over Time (2000-2019) - Selected Countries
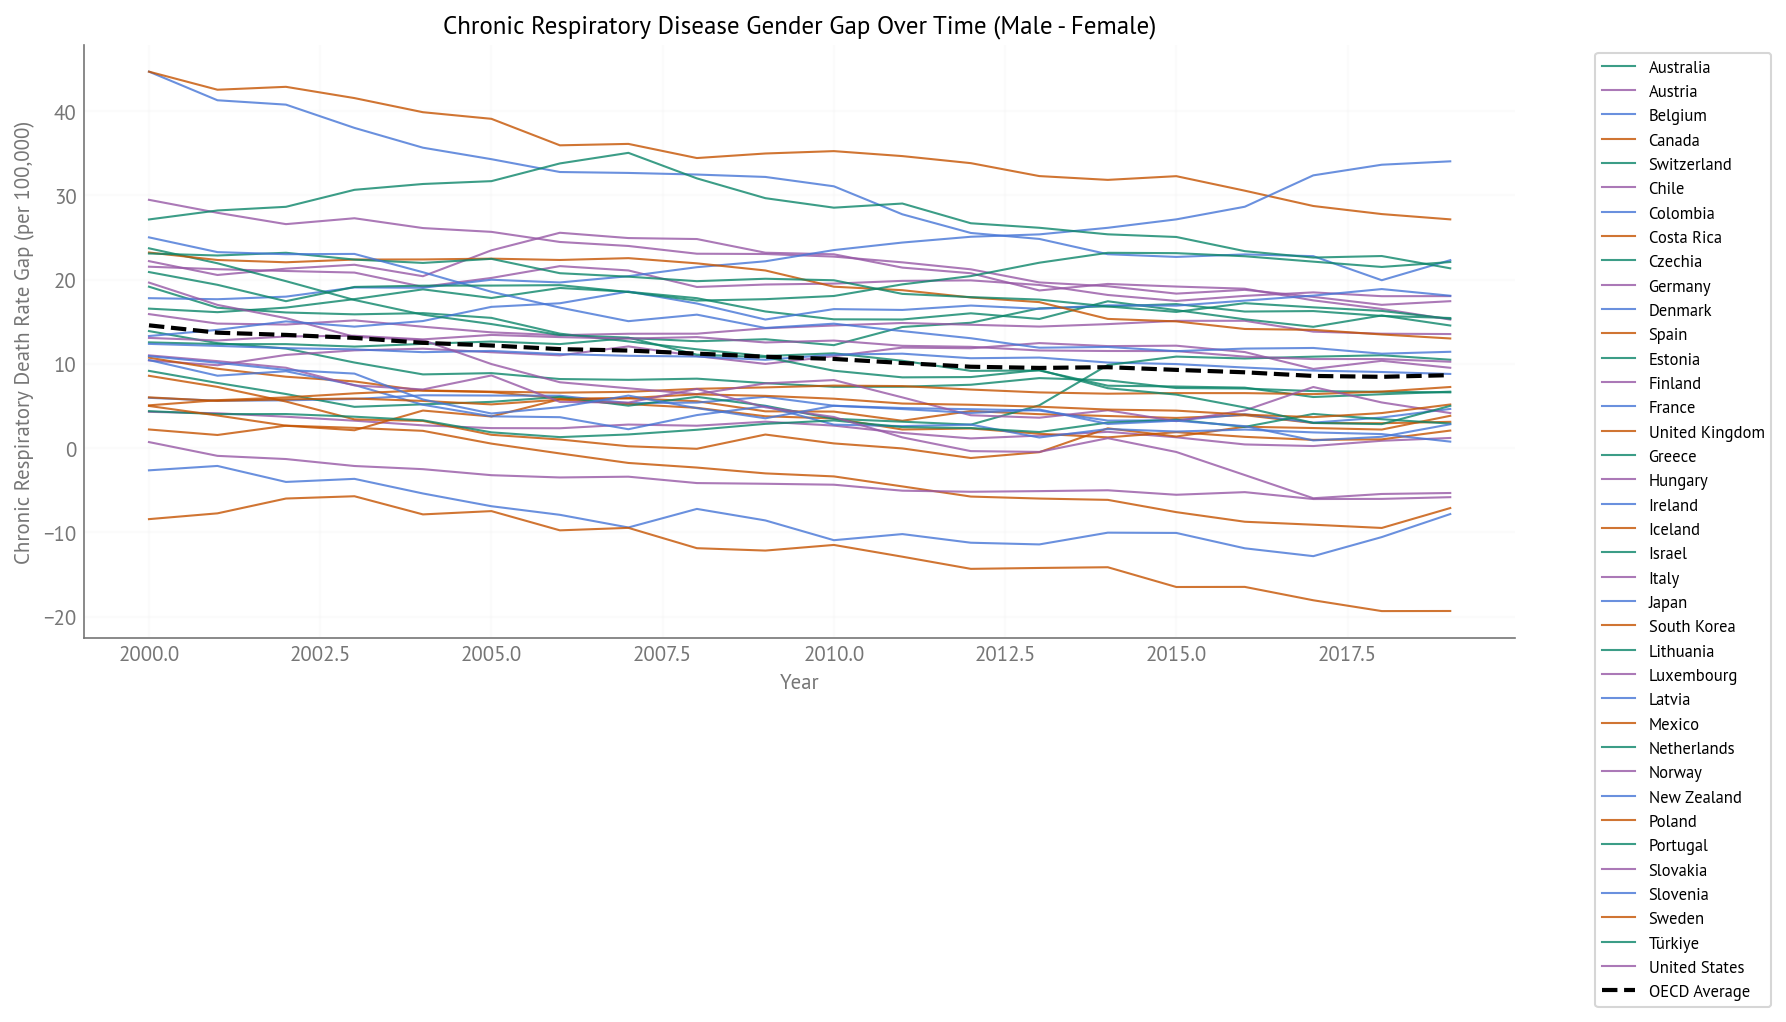
Figure 19:Chronic Respiratory Disease Gender Gap Over Time (2000-2019) - All OECD Countries
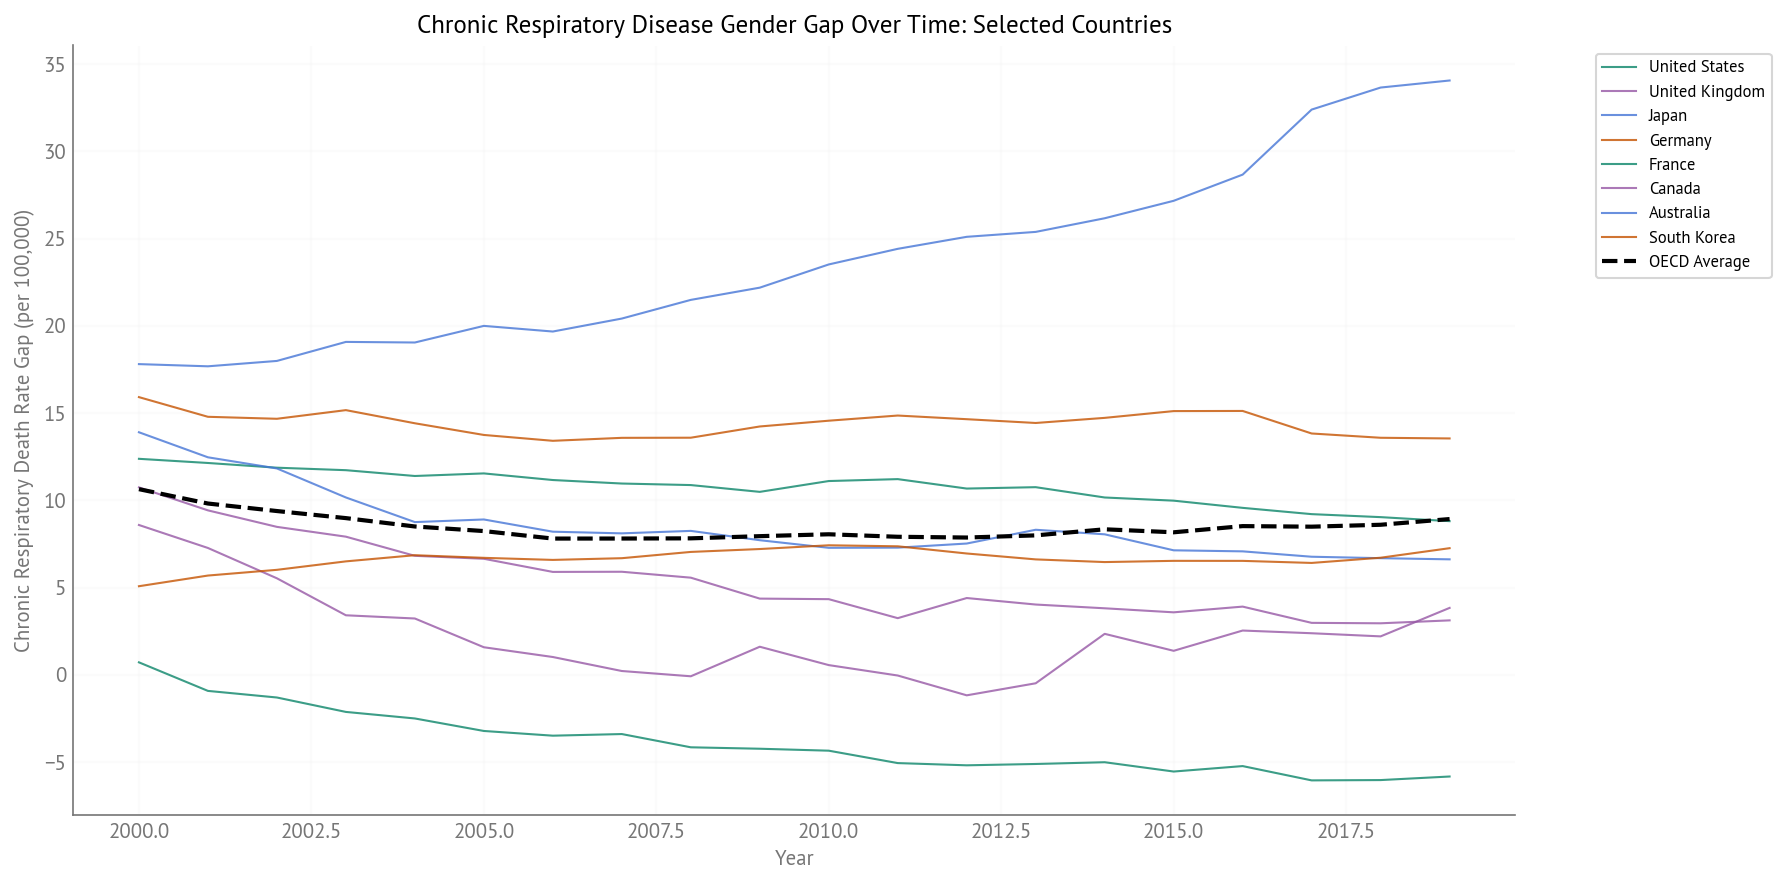
Figure 20:Chronic Respiratory Disease Gender Gap Over Time (2000-2019) - Selected Countries
Key Observations:
Moderate rates: Lower than cardiovascular but still significant
Declining trends: Most countries show decreasing rates over time
Gender gaps: Men generally have higher rates, with gaps varying by country
Suicide (Self-Harm)
Suicide represents intentional self-harm deaths.
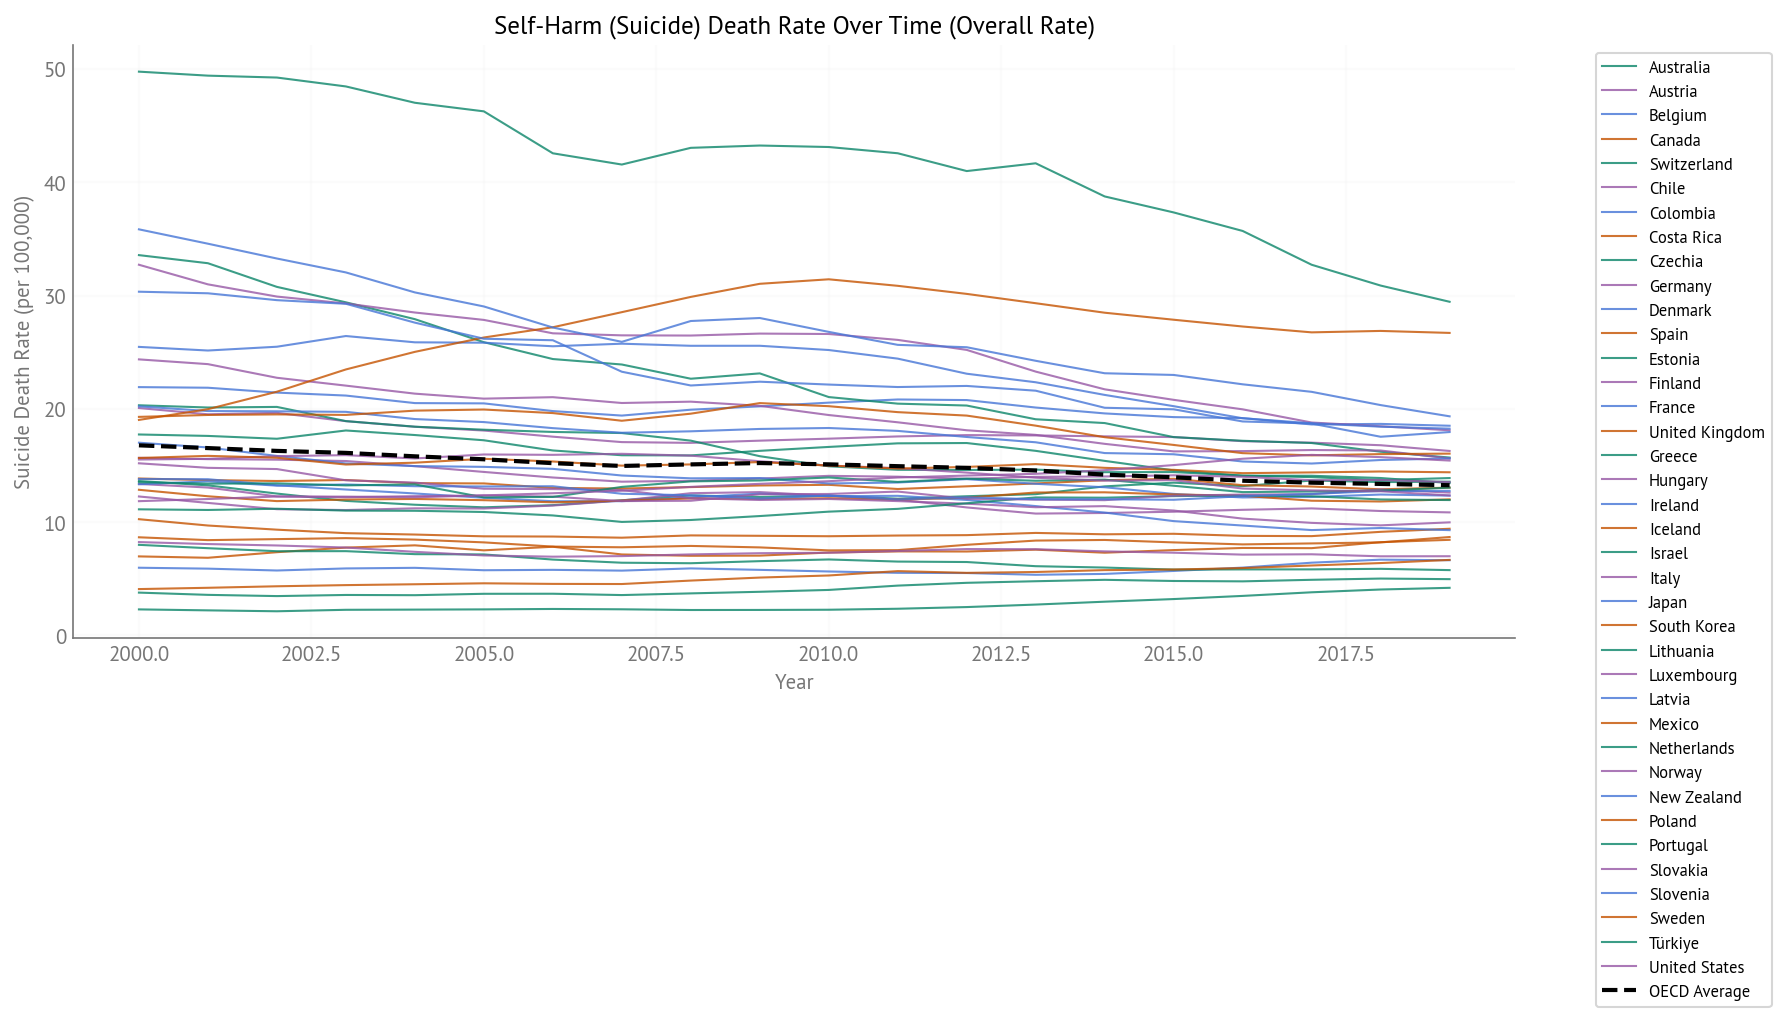
Figure 21:Suicide Death Rate Over Time (2000-2019) - All OECD Countries
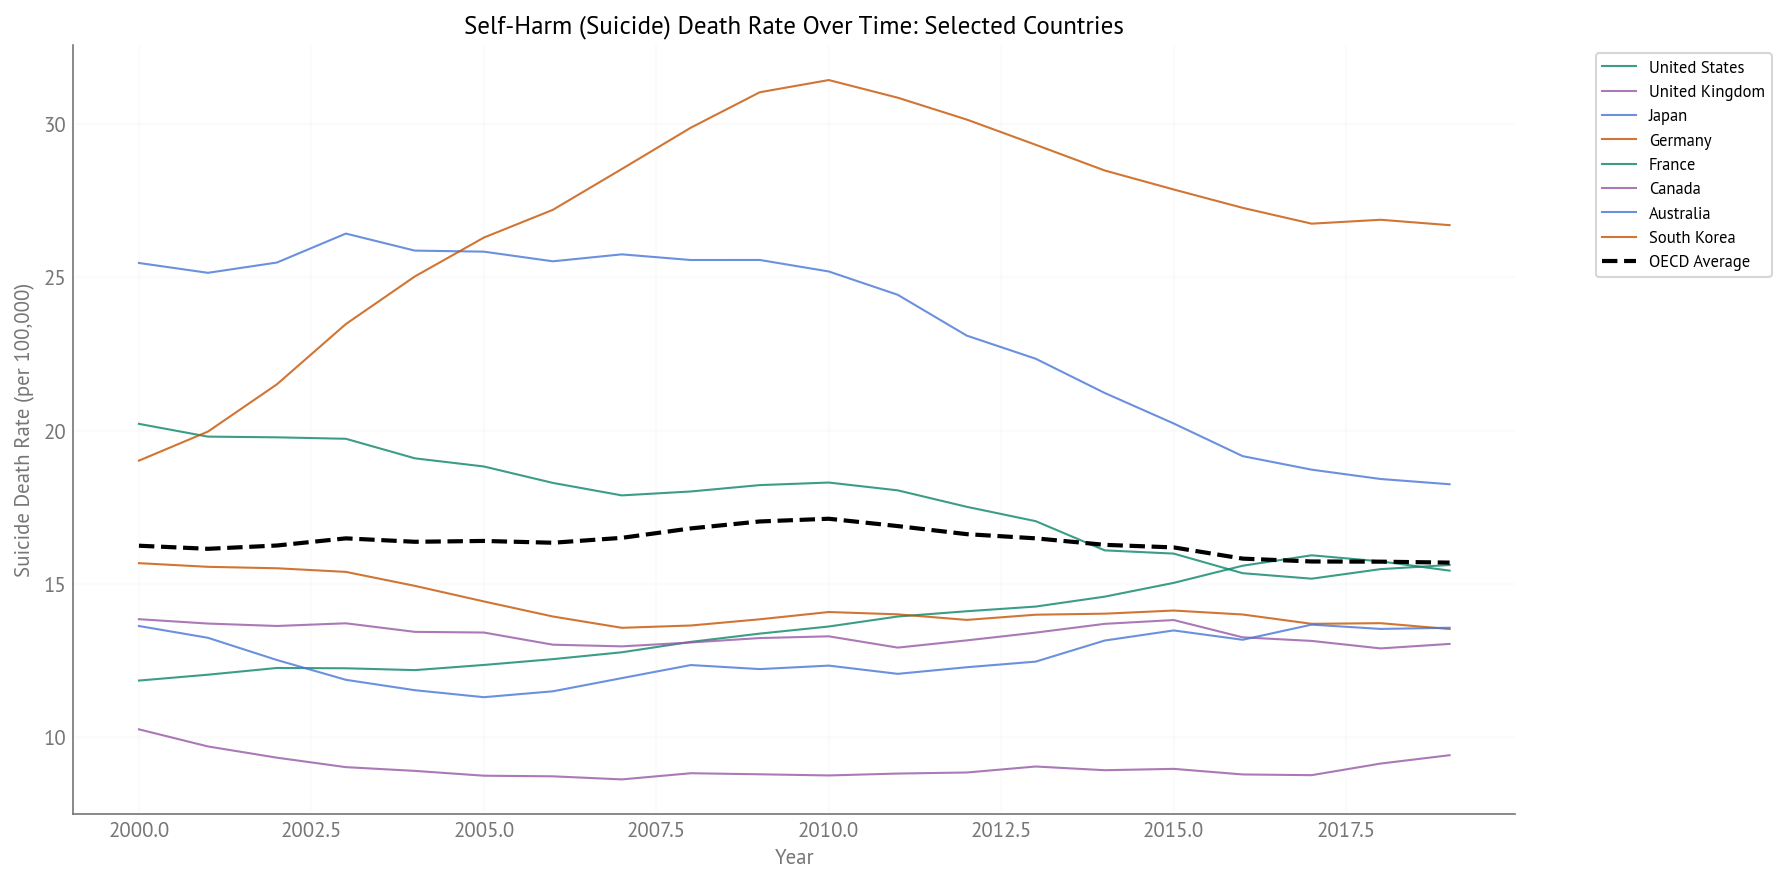
Figure 22:Suicide Death Rate Over Time (2000-2019) - Selected Countries
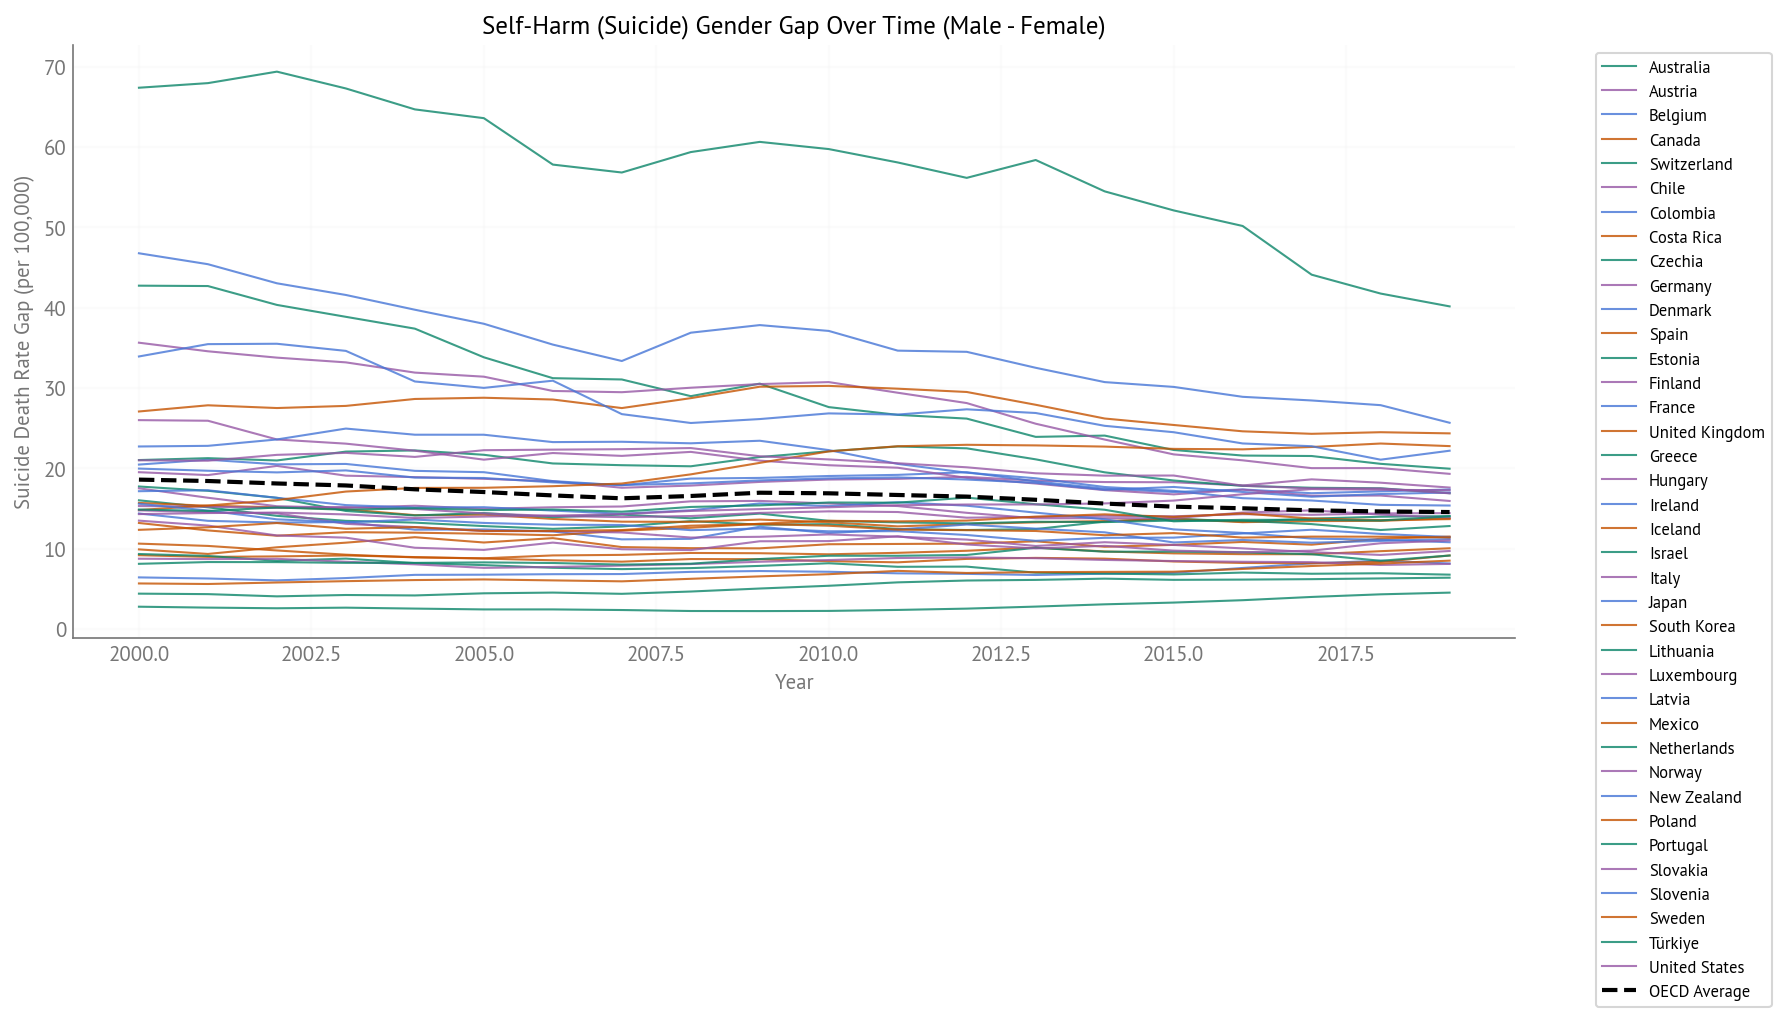
Figure 23:Suicide Gender Gap Over Time (2000-2019) - All OECD Countries
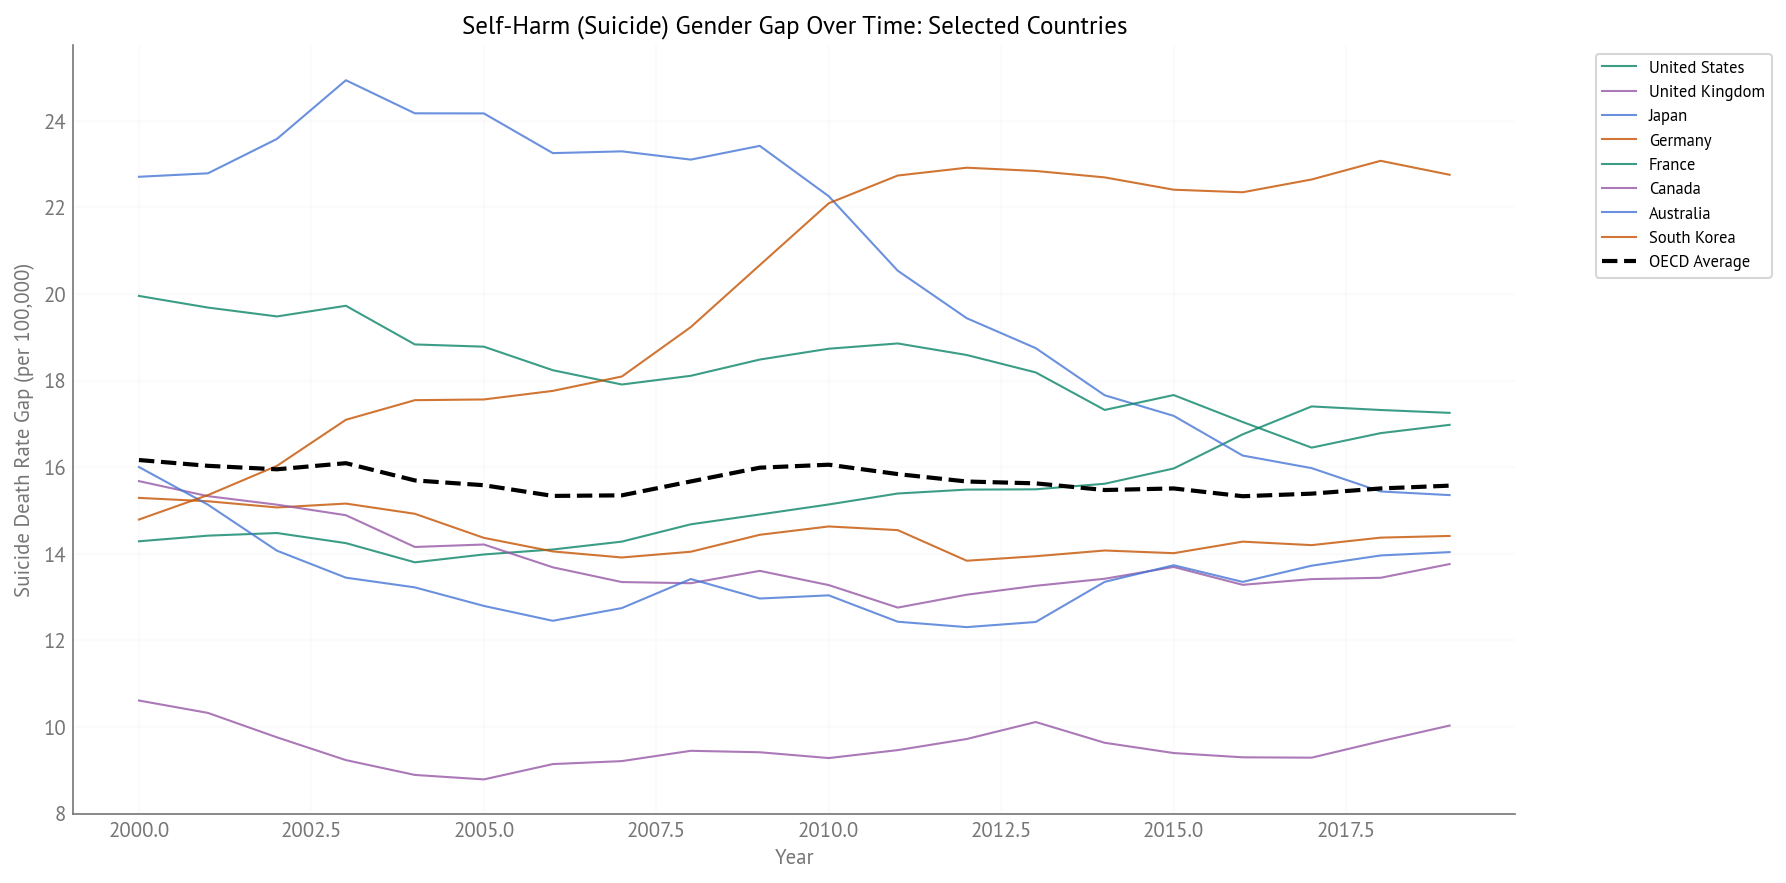
Figure 24:Suicide Gender Gap Over Time (2000-2019) - Selected Countries
Key Observations:
Large gender gaps: Men have much higher suicide rates than women in all countries
Variation across countries: Rates vary substantially, with some countries showing much higher rates
Mixed trends: Some countries show declining rates (successful prevention), while others show increases (concerning trend)
Critical intervention target: Given the large gaps and their importance in explaining HALE/LE gaps, suicide prevention is a high priority
Homicide (Interpersonal Violence)
Homicide represents deaths from intentional interpersonal violence.
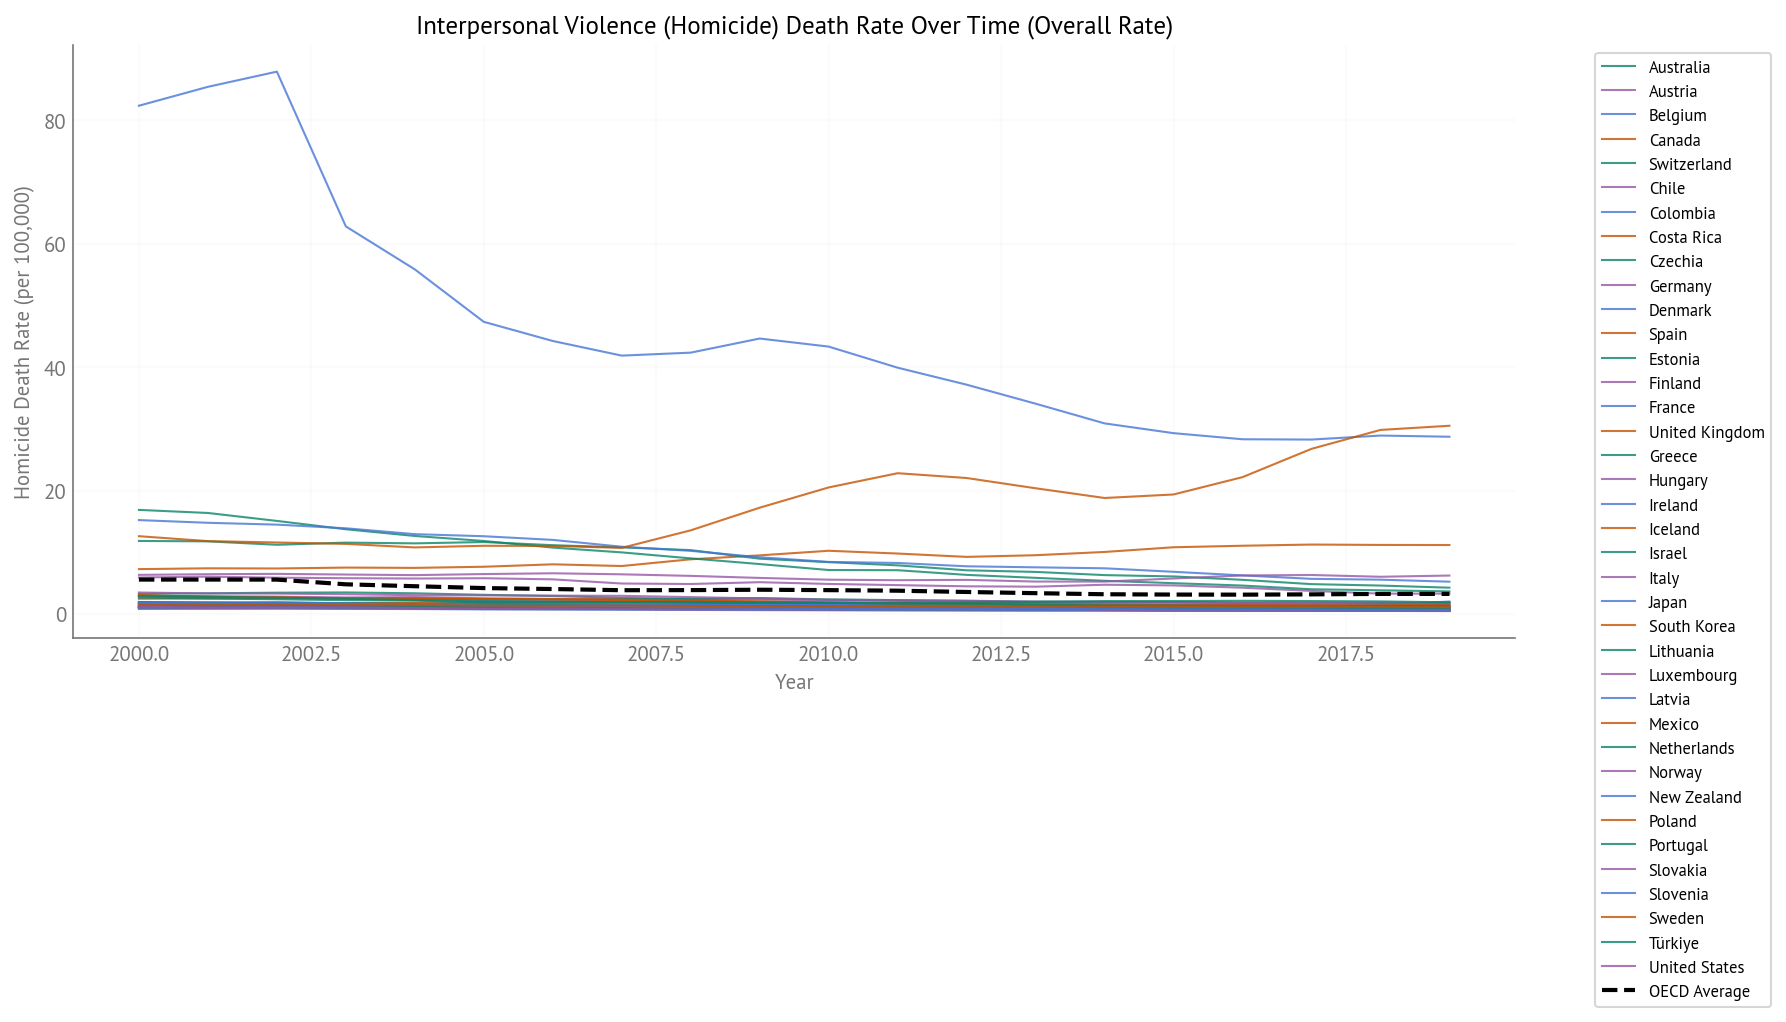
Figure 25:Homicide Death Rate Over Time (2000-2019) - All OECD Countries
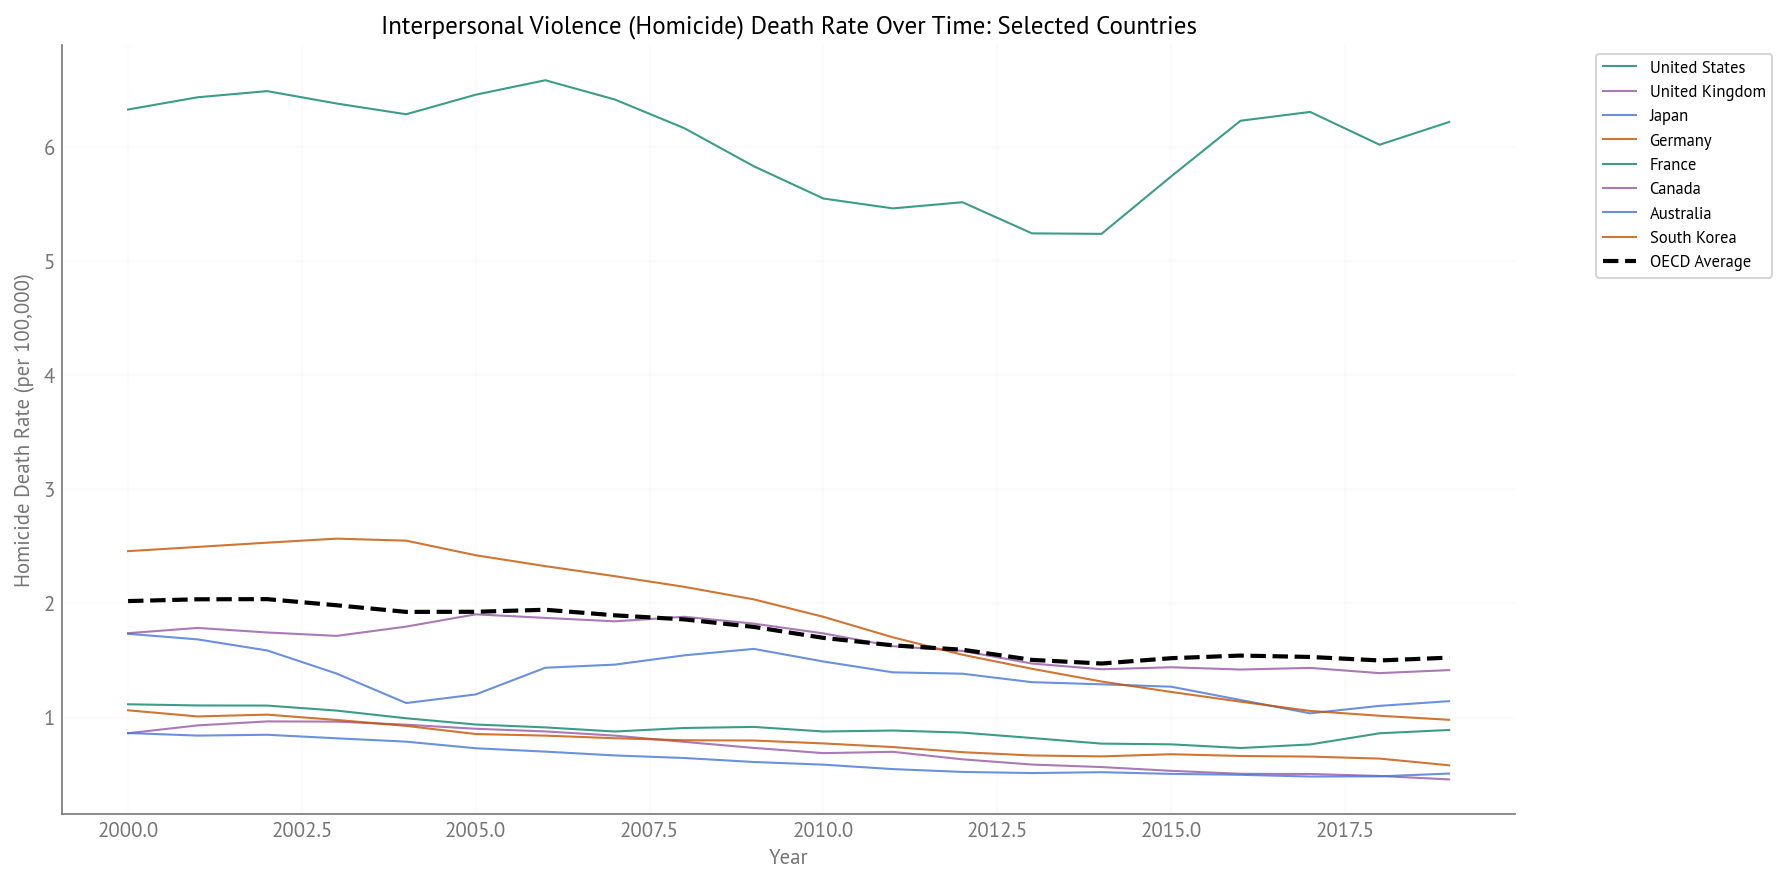
Figure 26:Homicide Death Rate Over Time (2000-2019) - Selected Countries
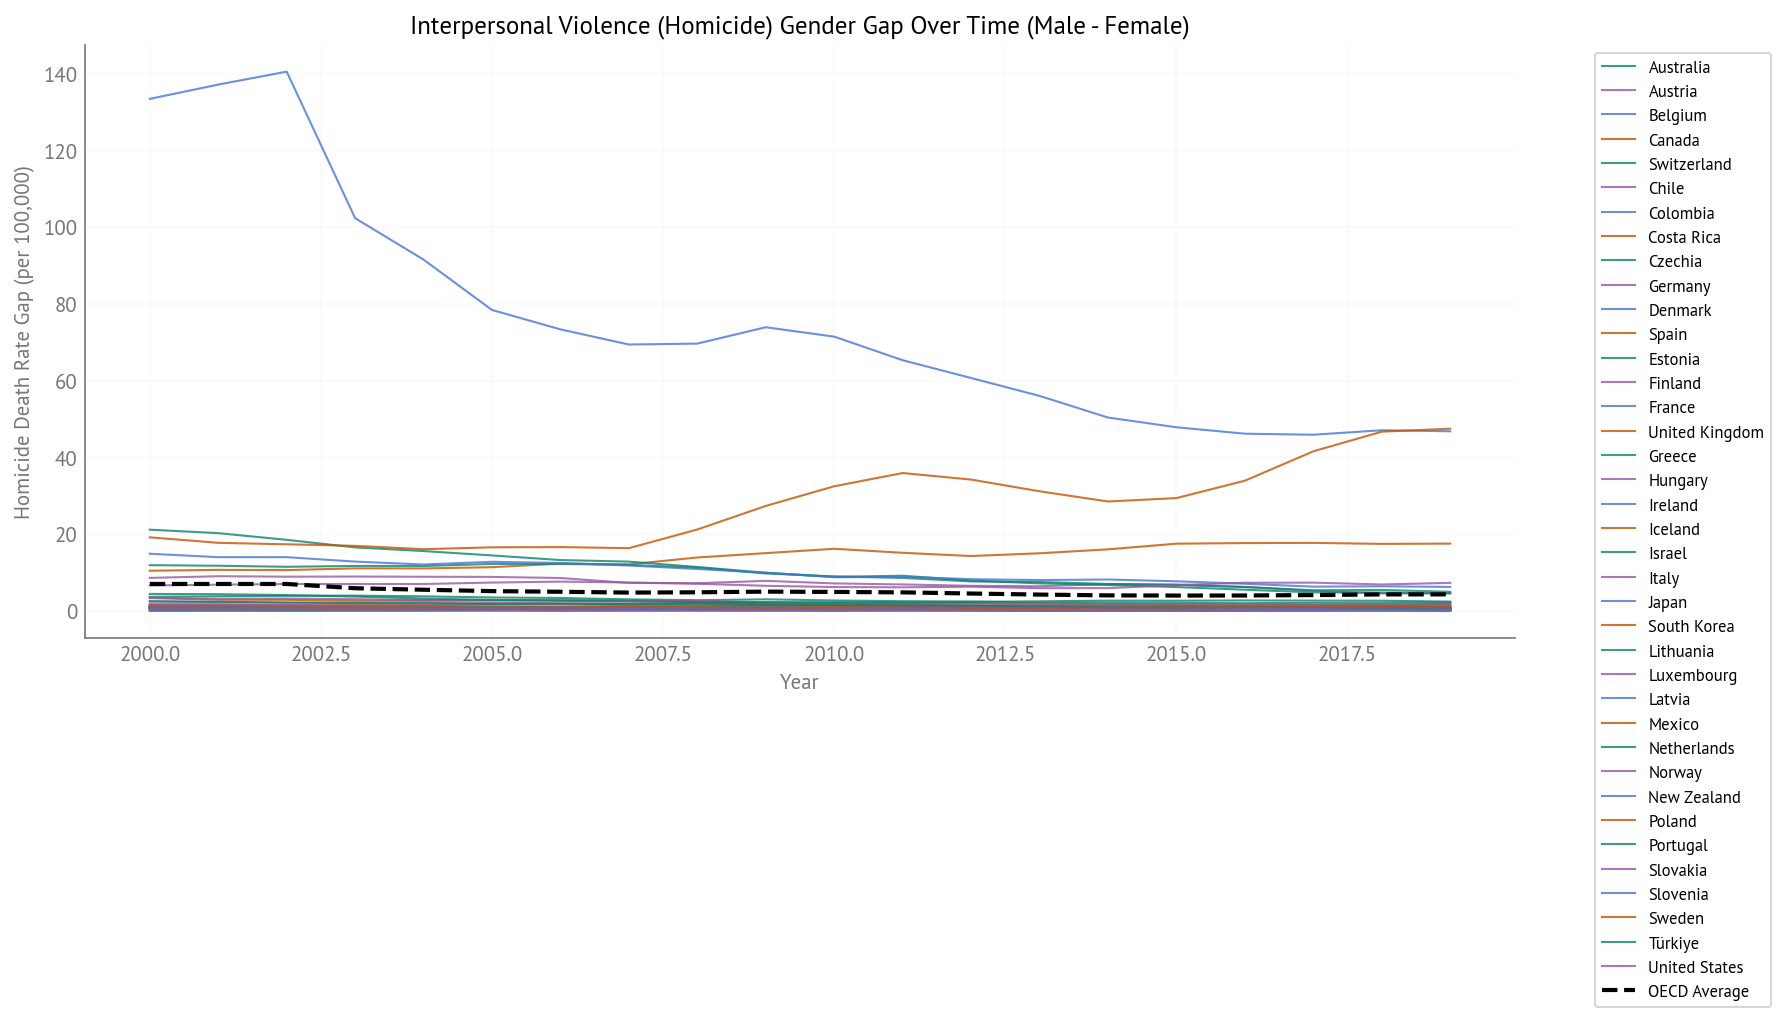
Figure 27:Homicide Gender Gap Over Time (2000-2019) - All OECD Countries
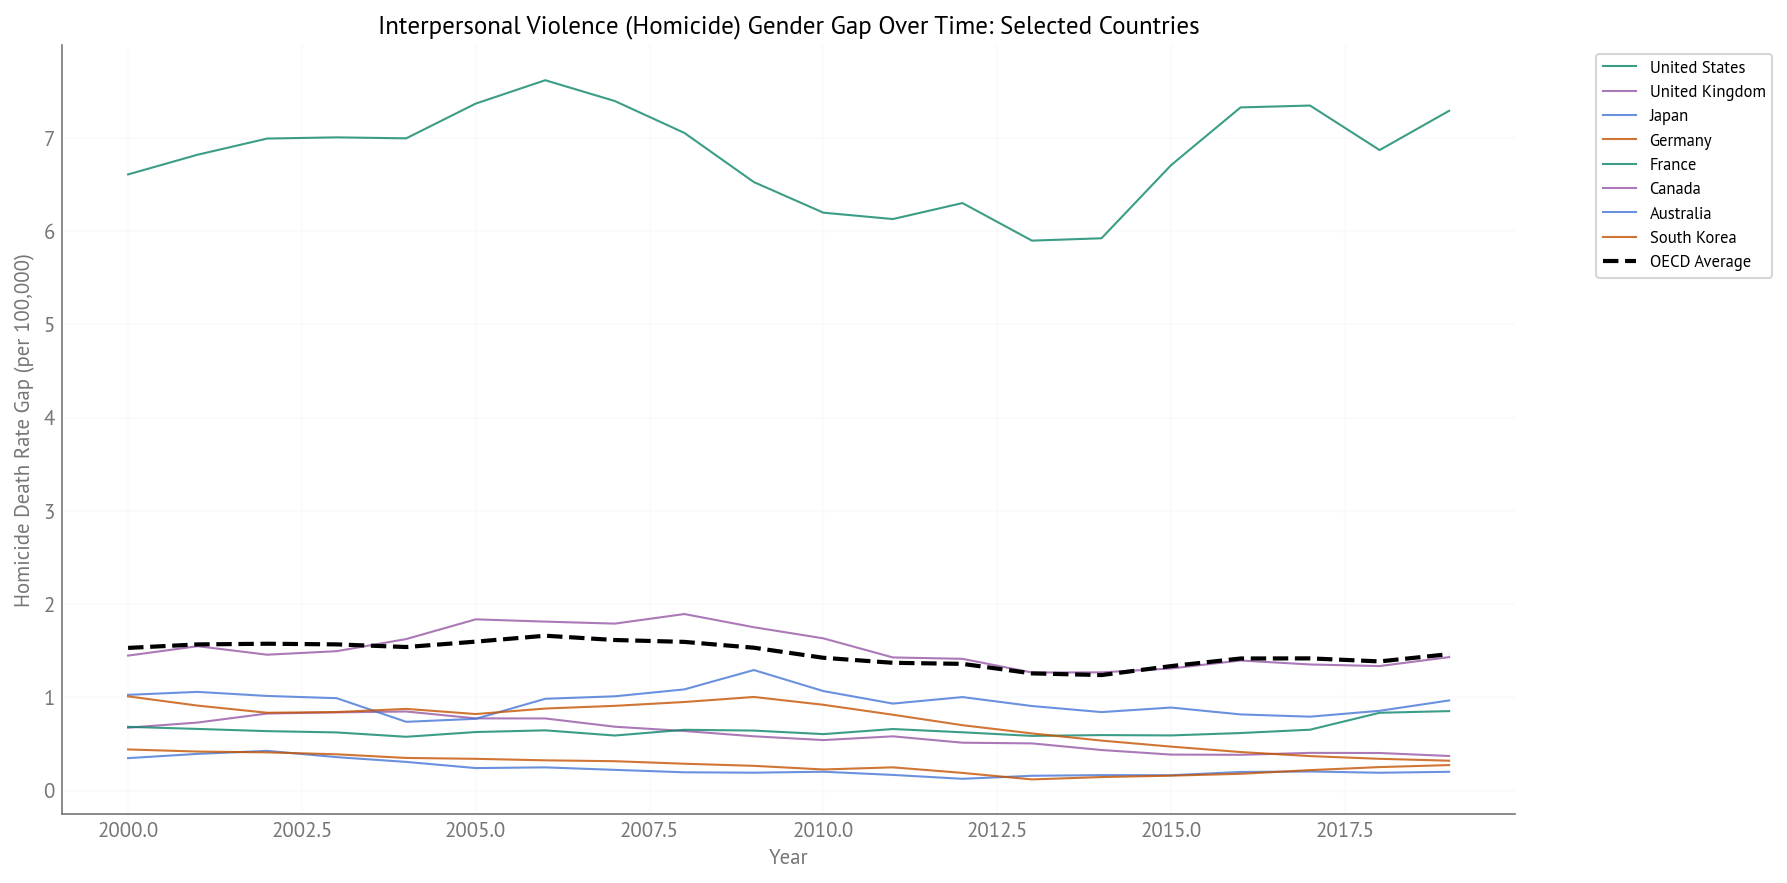
Figure 28:Homicide Gender Gap Over Time (2000-2019) - Selected Countries
Key Observations:
Low overall rates: Homicide rates are generally low in OECD countries (<5 per 100,000 in most)
Large gender gaps: Men have much higher homicide rates than women
Declining trends: Most countries show substantial declines, reflecting improvements in public safety
High variation: Some countries (e.g., Mexico, United States) have notably higher rates
Road Traffic Injuries
Road traffic injuries represent deaths from motor vehicle accidents.
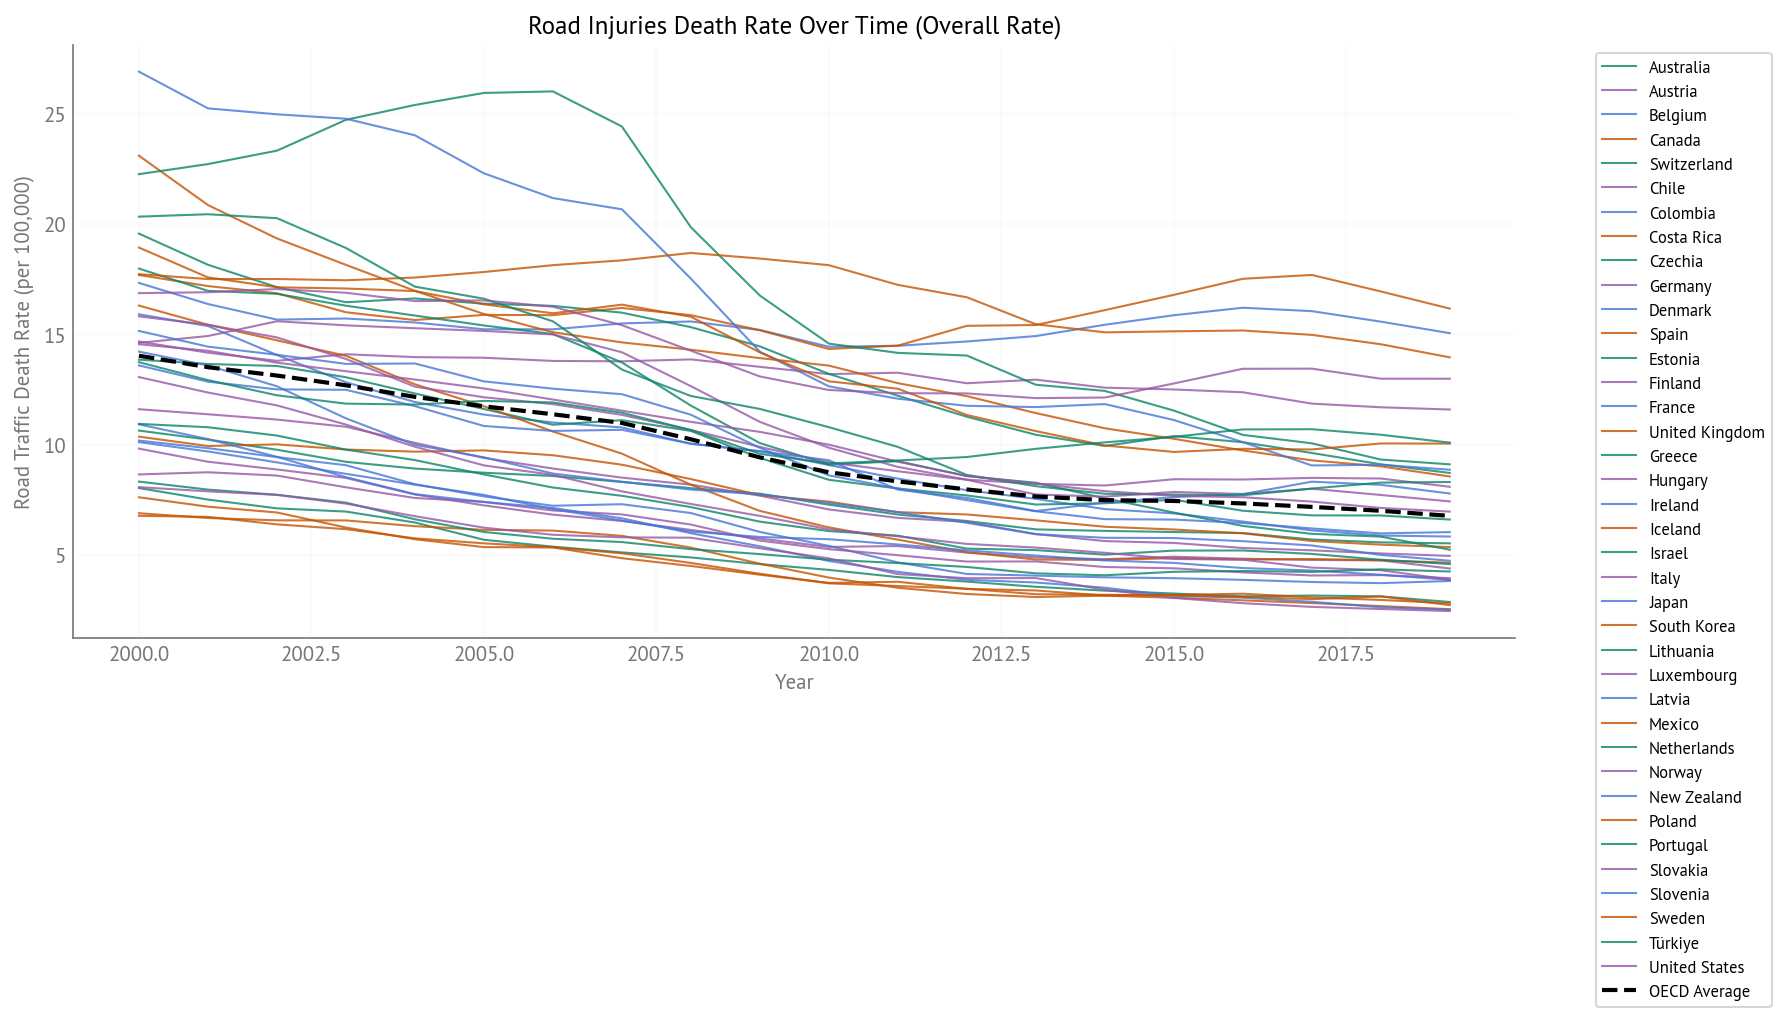
Figure 29:Road Traffic Injury Death Rate Over Time (2000-2019) - All OECD Countries
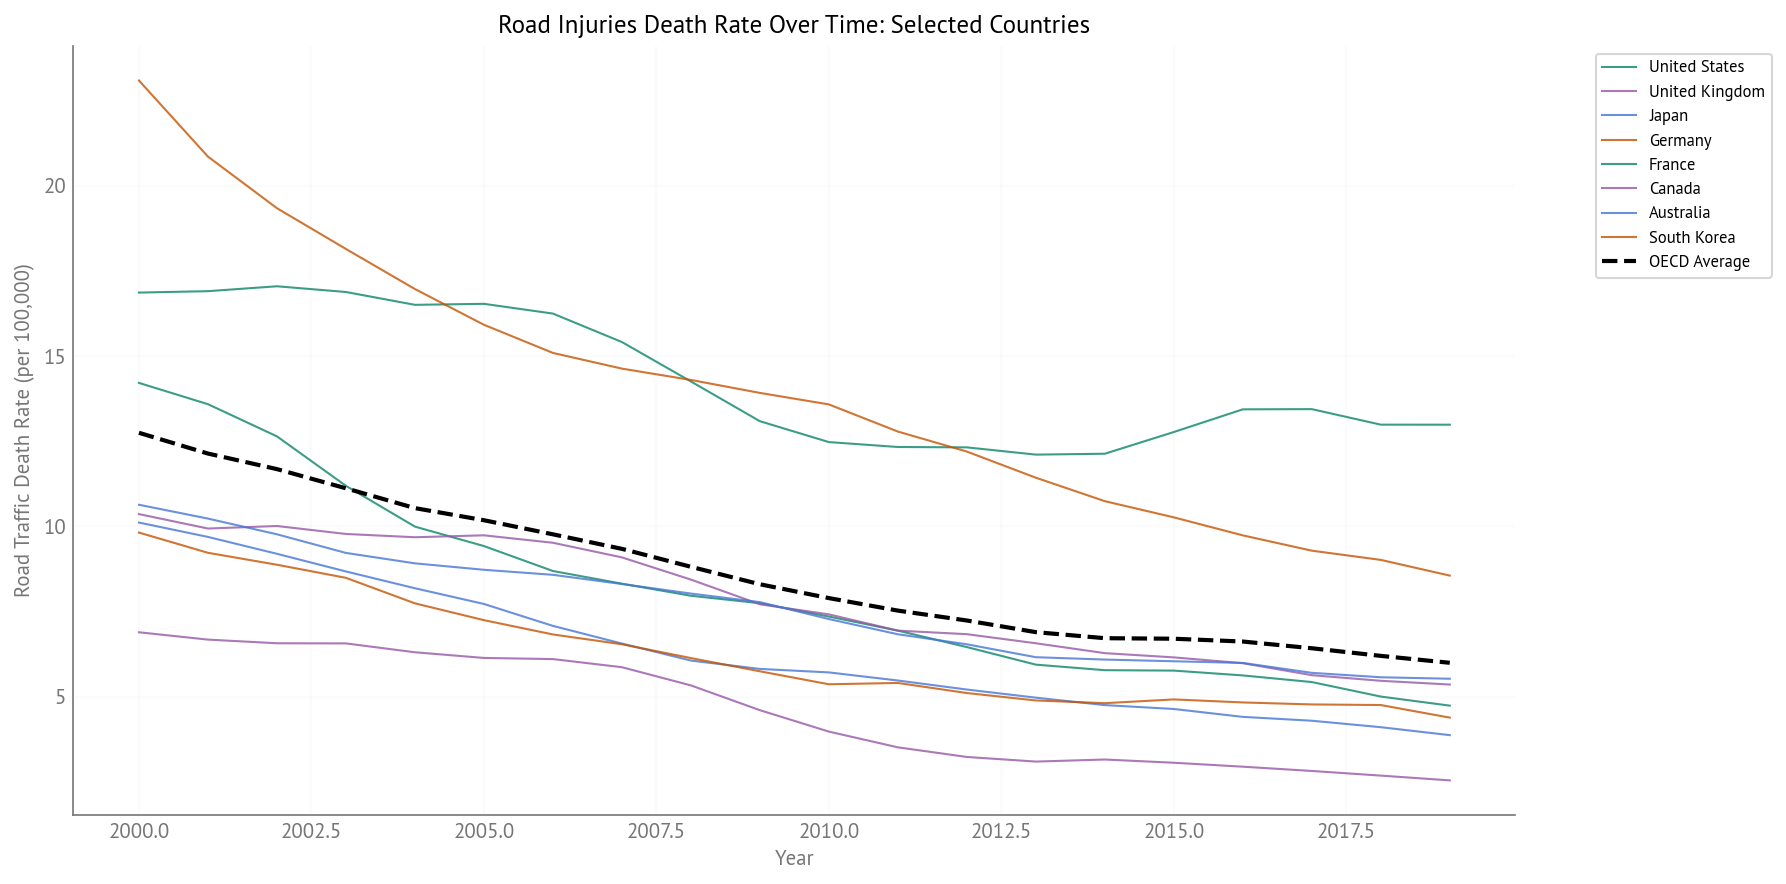
Figure 30:Road Traffic Injury Death Rate Over Time (2000-2019) - Selected Countries
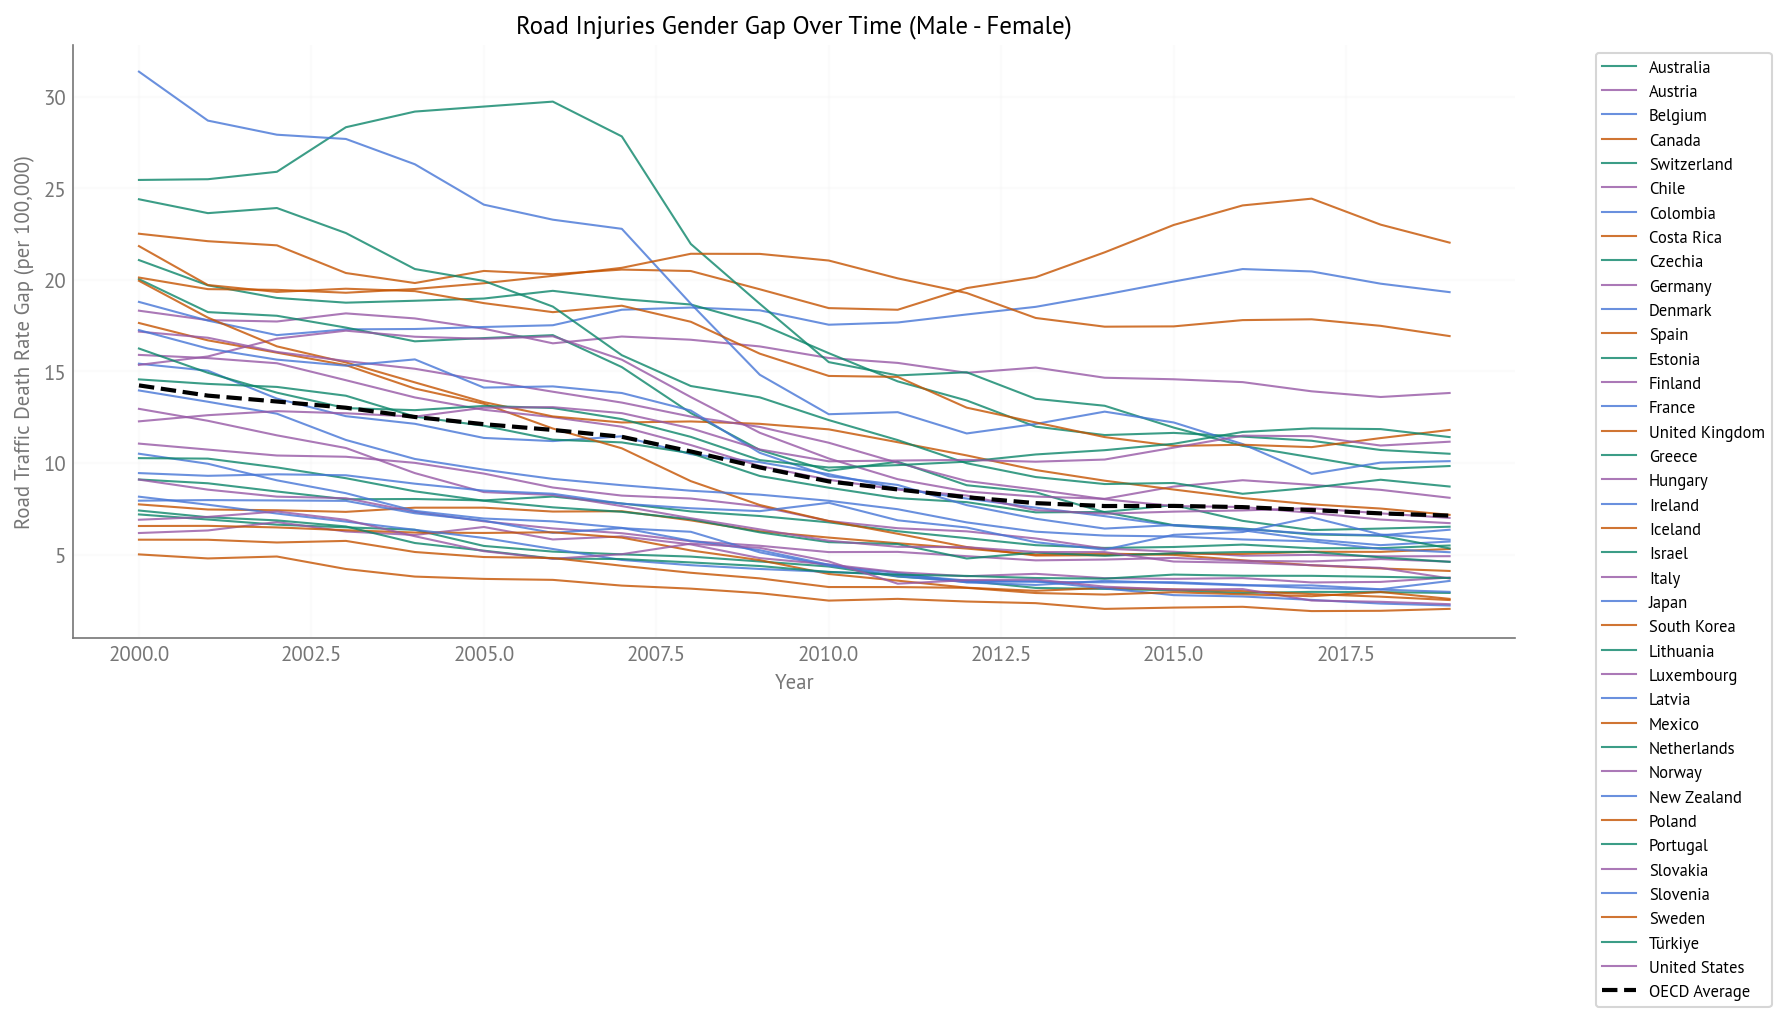
Figure 31:Road Traffic Injury Gender Gap Over Time (2000-2019) - All OECD Countries
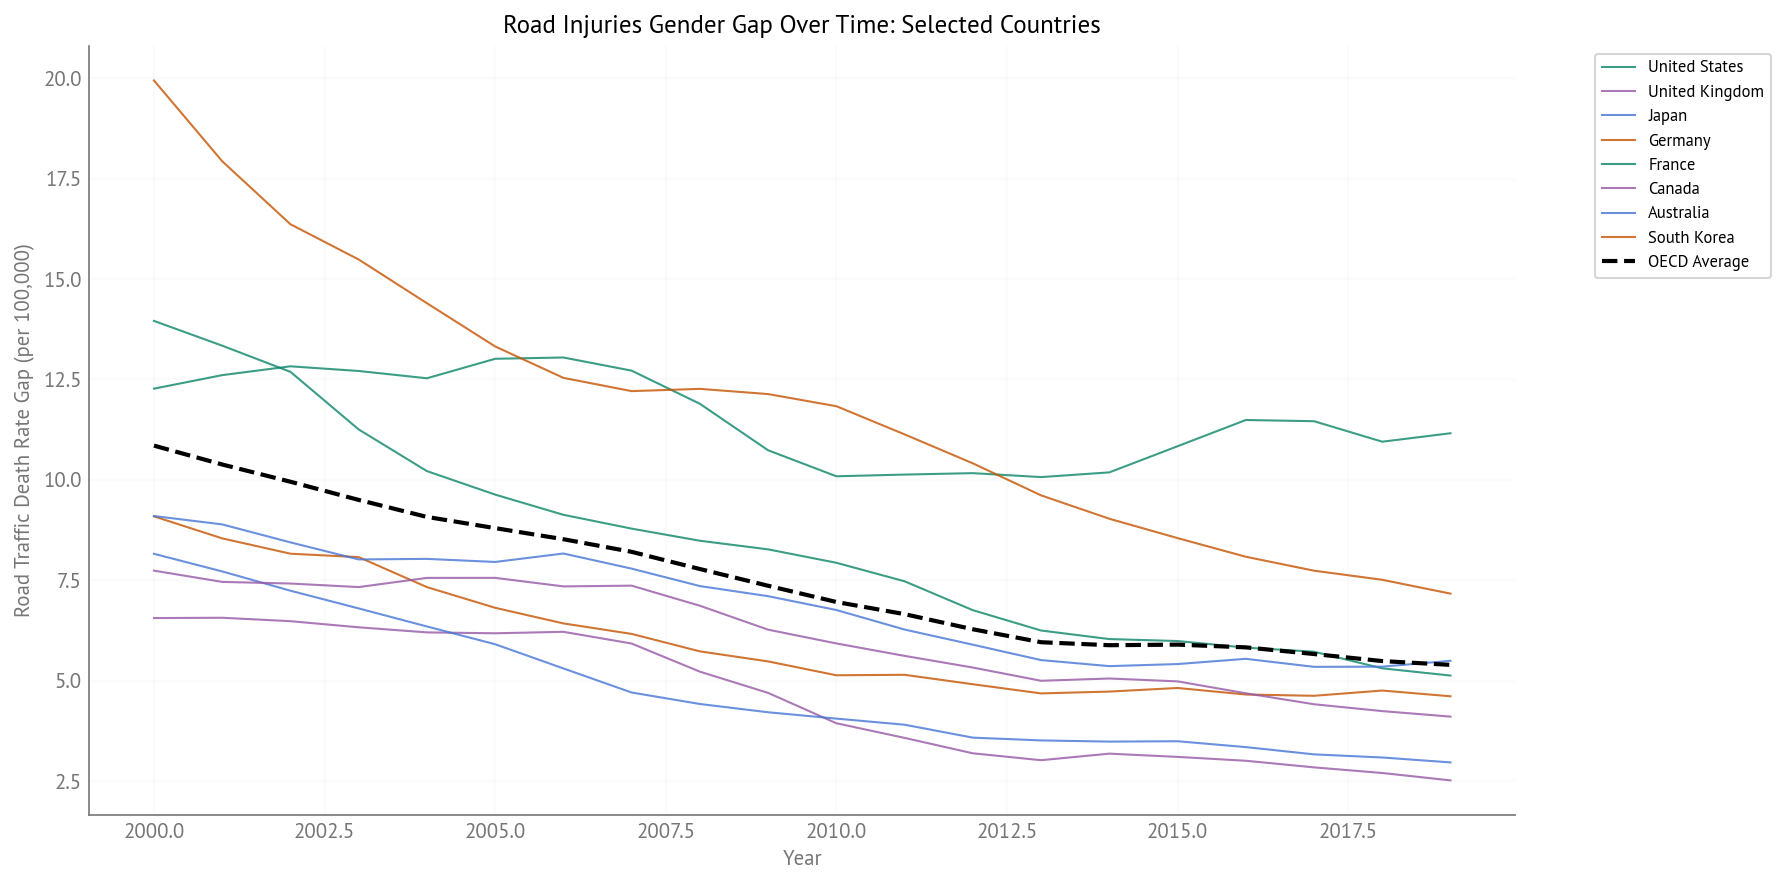
Figure 32:Road Traffic Injury Gender Gap Over Time (2000-2019) - Selected Countries
Key Observations:
Declining trends: Most countries show substantial declines in road traffic deaths, reflecting improvements in vehicle safety, road infrastructure, and traffic laws
Large gender gaps: Men have much higher rates than women
Success story: Road traffic injuries have become less important in explaining gender gaps over time, suggesting successful interventions
Liver Disease
Liver disease includes deaths from cirrhosis, hepatitis, and other liver conditions.
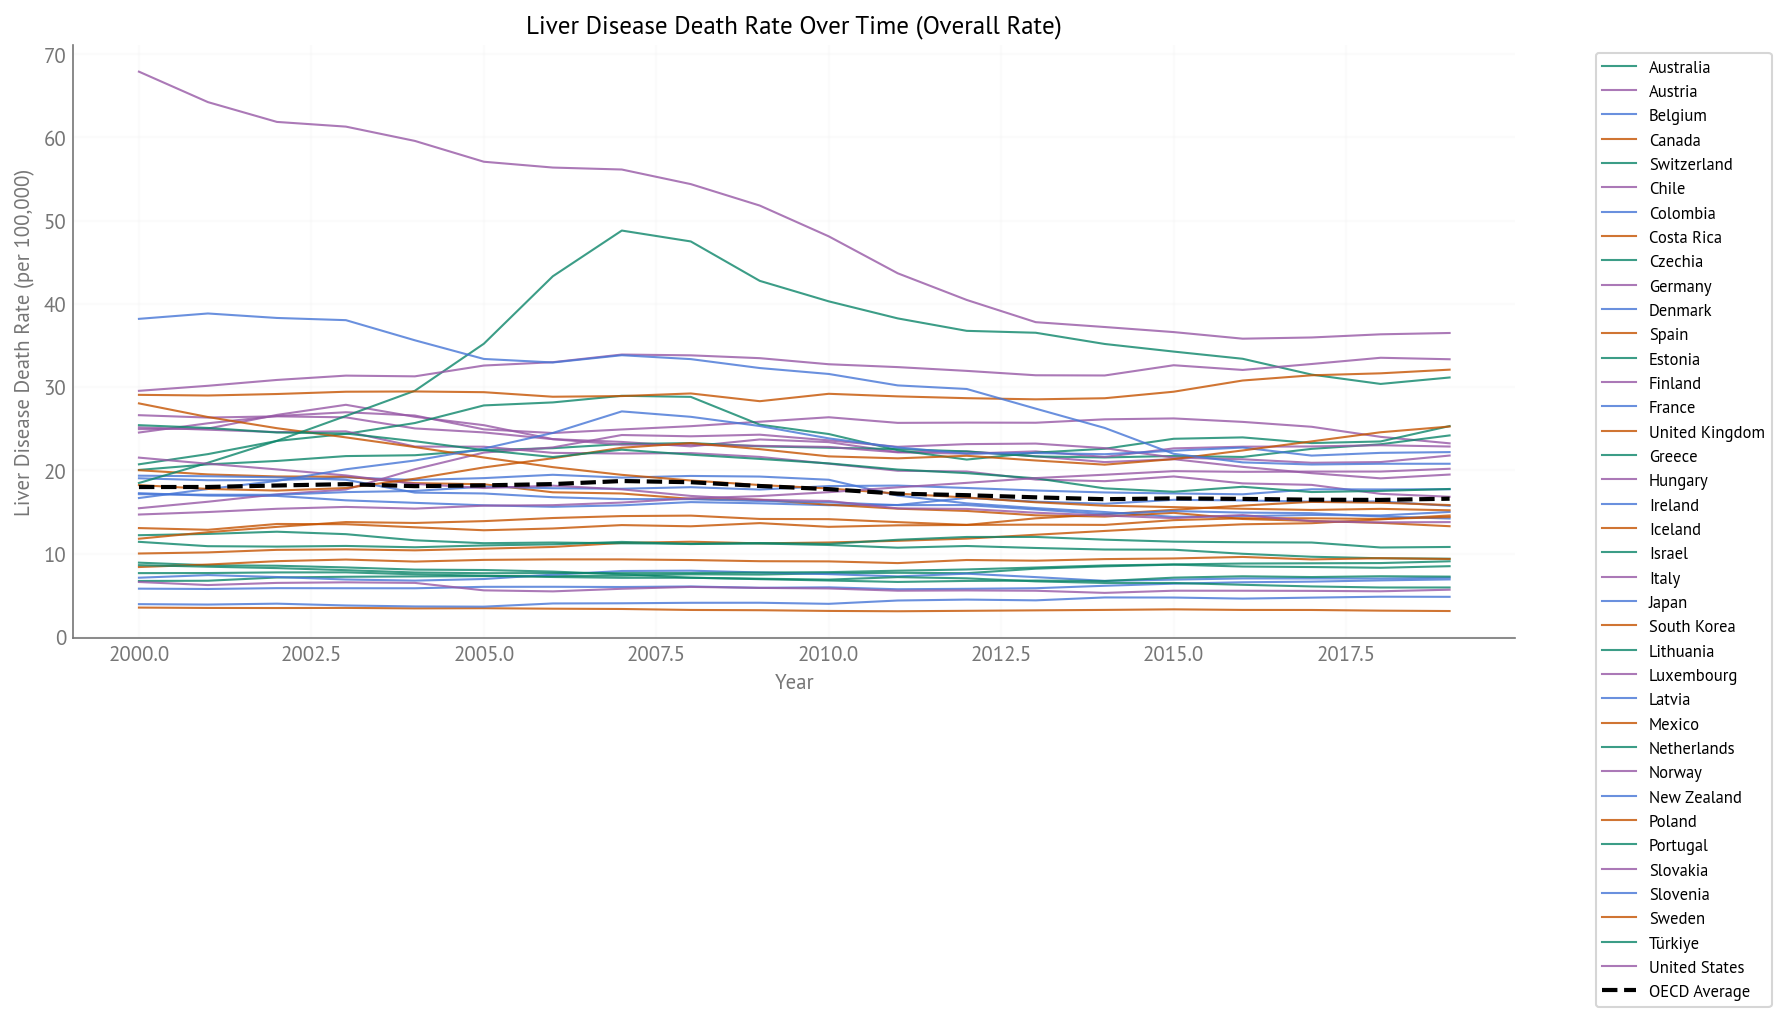
Figure 33:Liver Disease Death Rate Over Time (2000-2019) - All OECD Countries
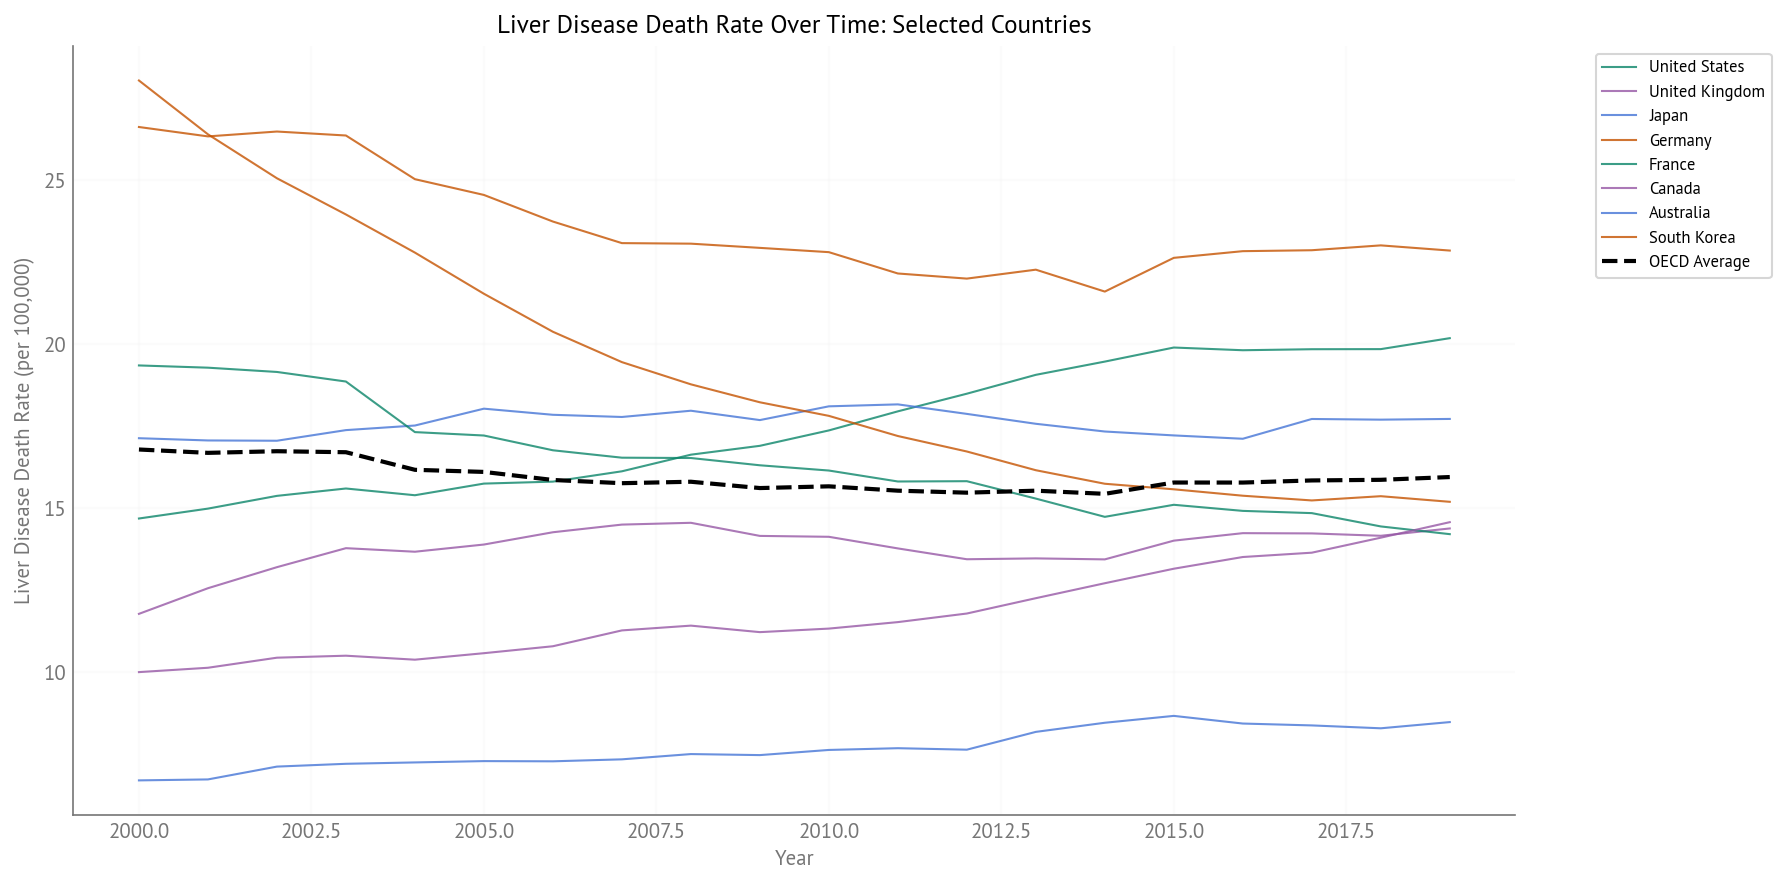
Figure 34:Liver Disease Death Rate Over Time (2000-2019) - Selected Countries
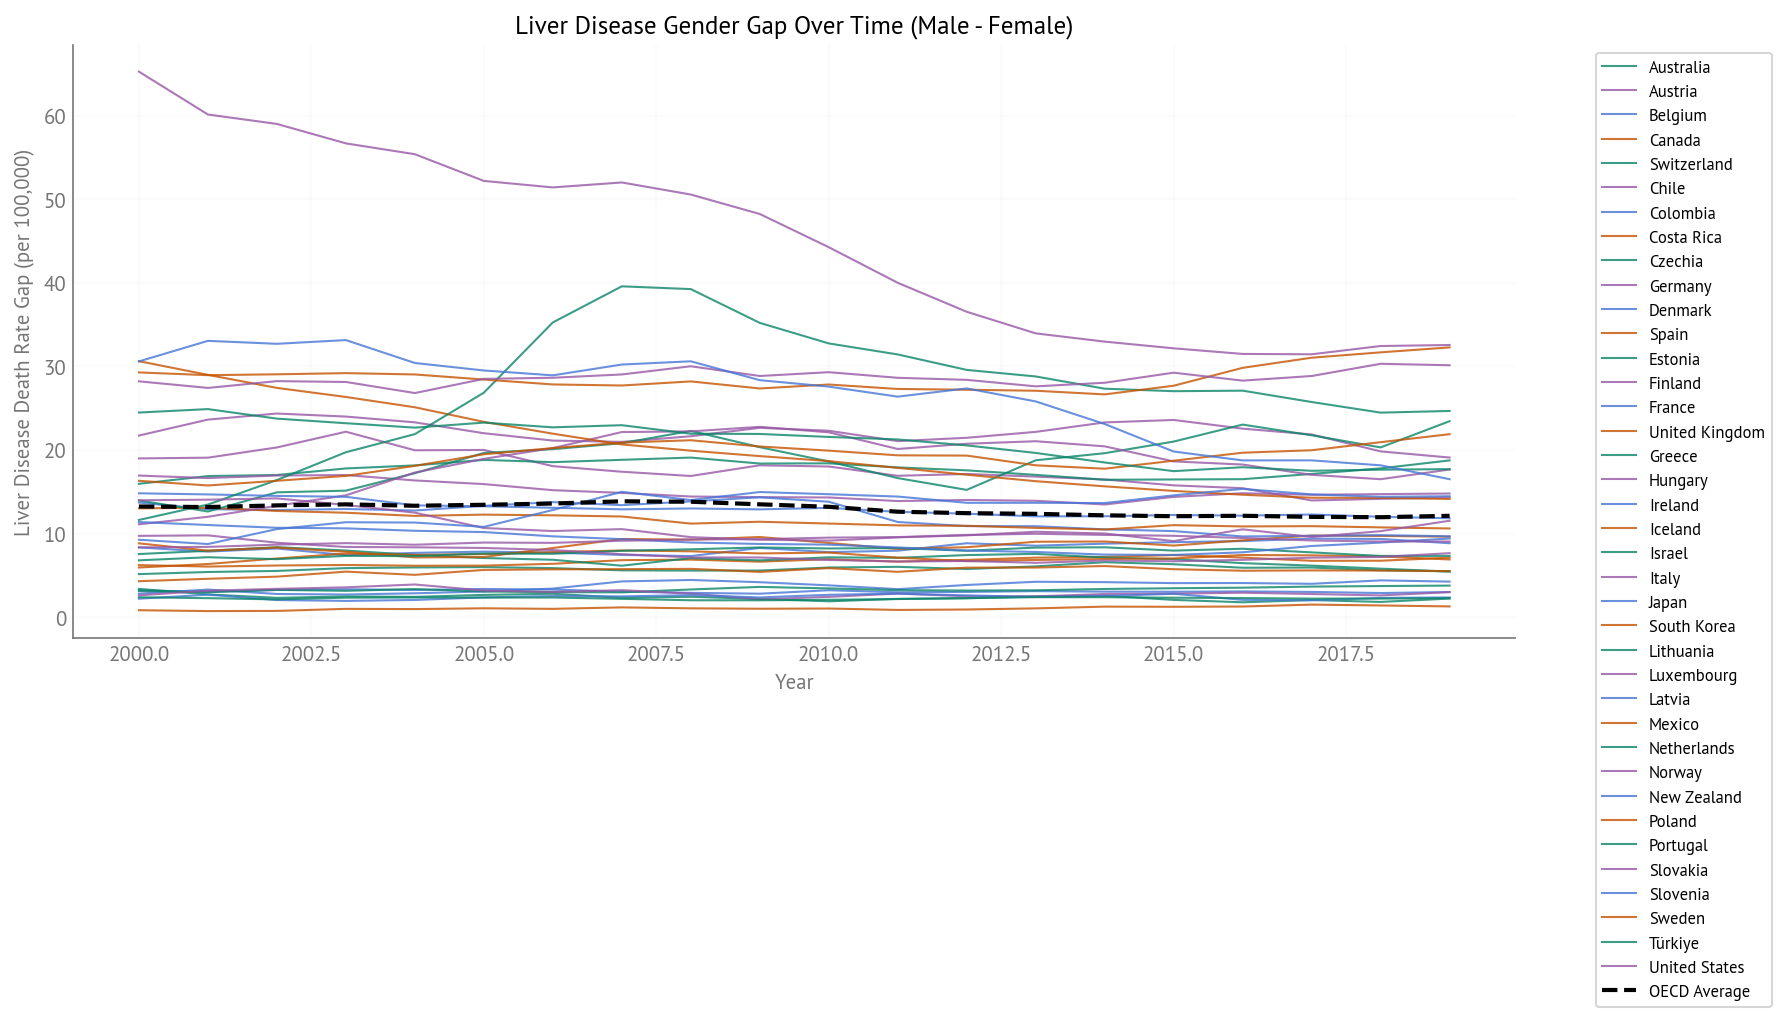
Figure 35:Liver Disease Gender Gap Over Time (2000-2019) - All OECD Countries
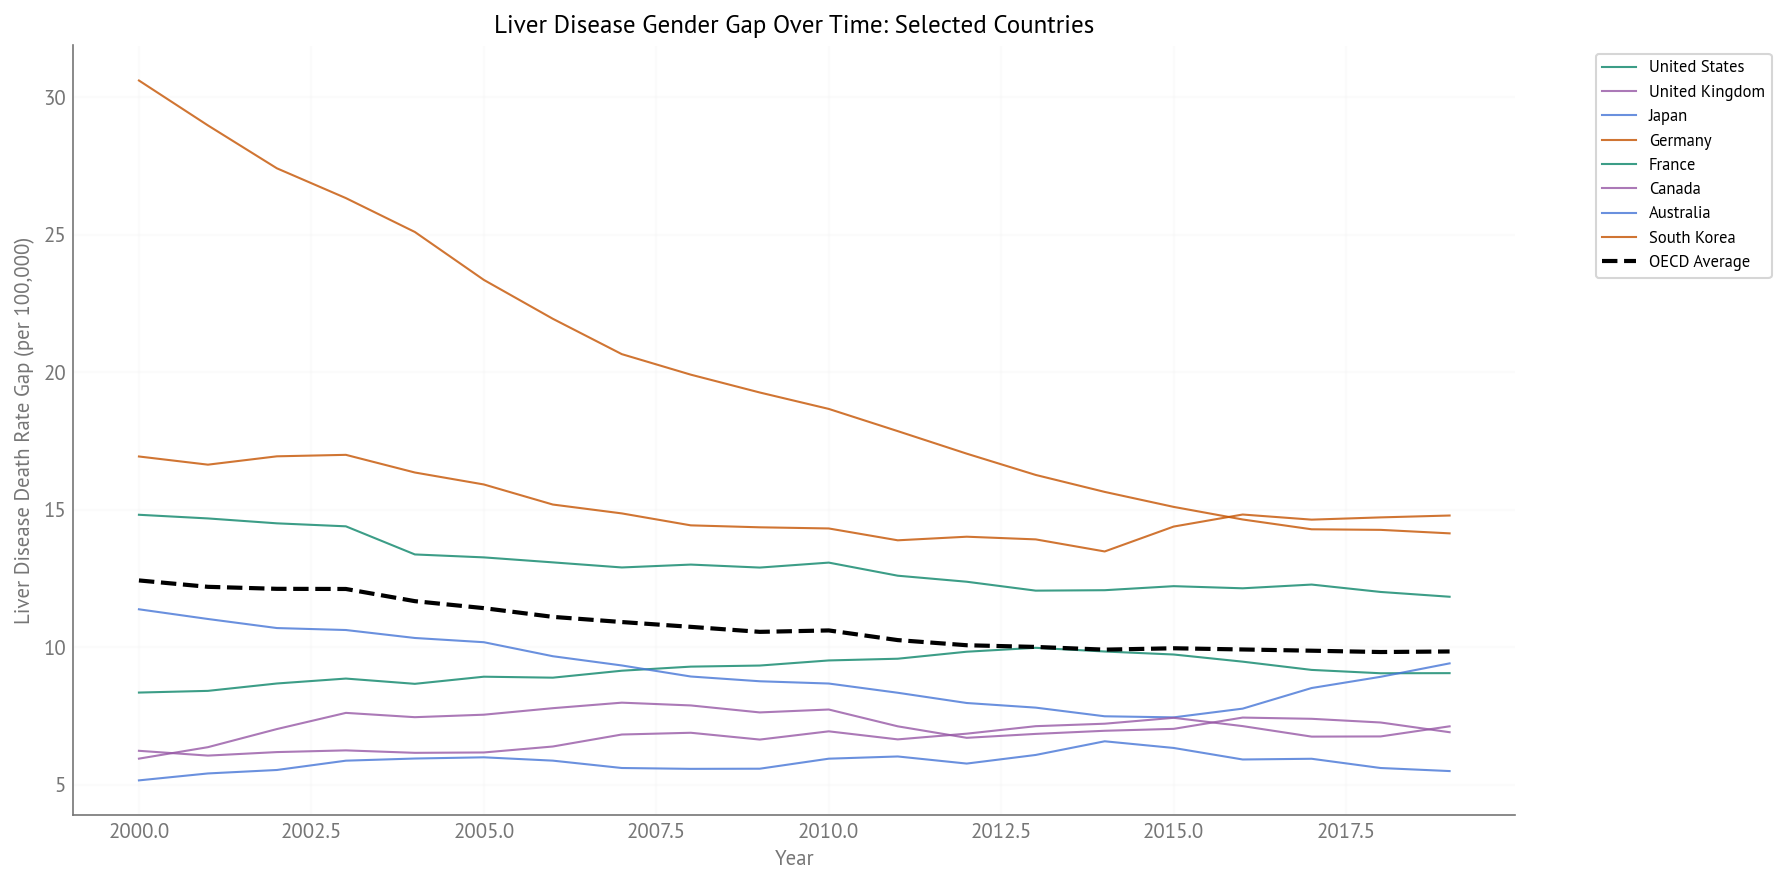
Figure 36:Liver Disease Gender Gap Over Time (2000-2019) - Selected Countries
Key Observations:
Moderate rates: Lower than cardiovascular but still significant
Gender gaps: Men generally have higher rates
Mixed trends: Some countries show declining rates, while others are stable or increasing
Neoplasms (Cancer)
Neoplasms represent deaths from all types of cancer.
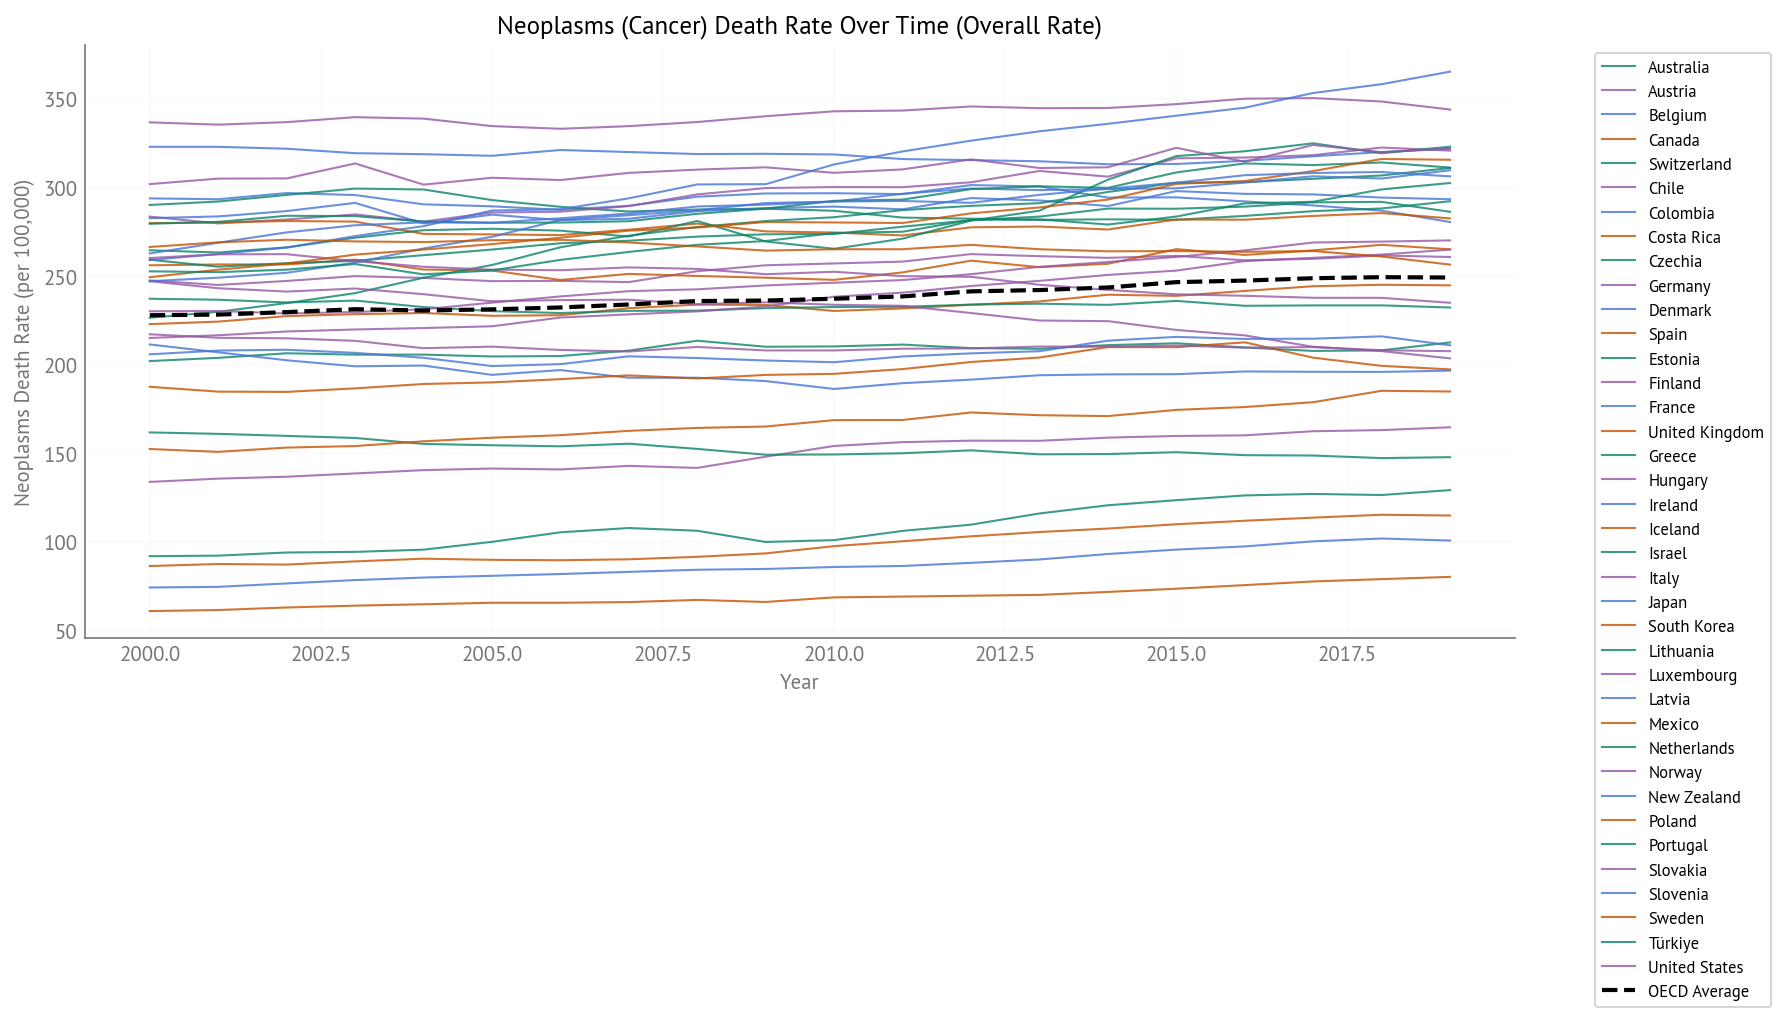
Figure 37:Cancer Death Rate Over Time (2000-2019) - All OECD Countries
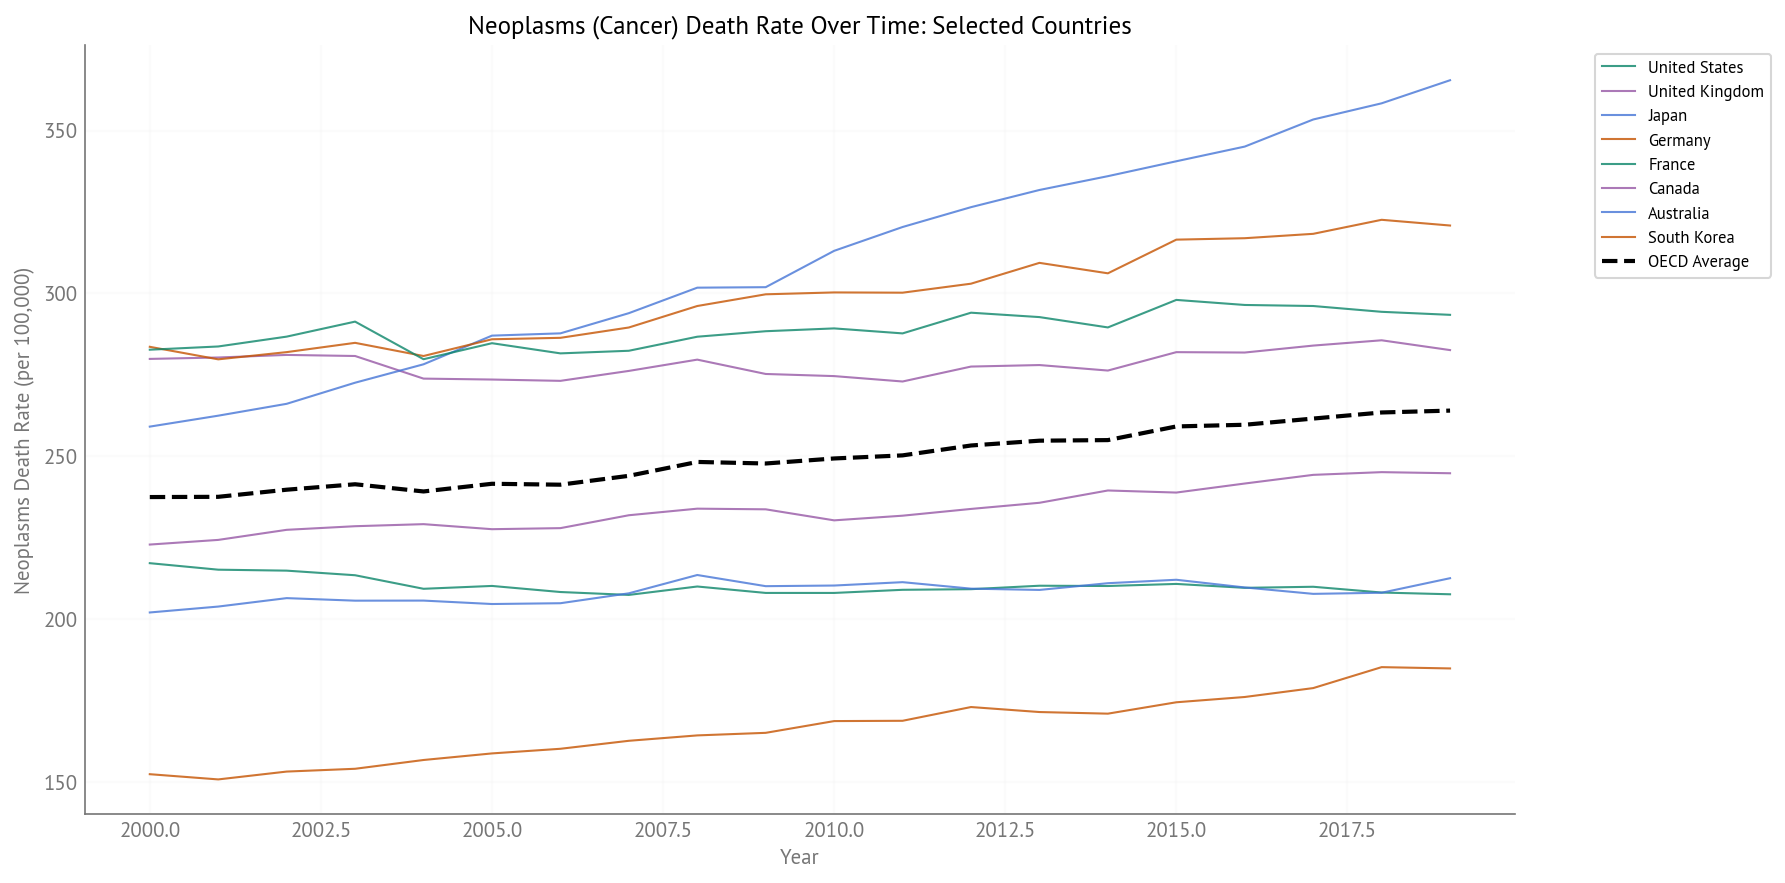
Figure 38:Cancer Death Rate Over Time (2000-2019) - Selected Countries
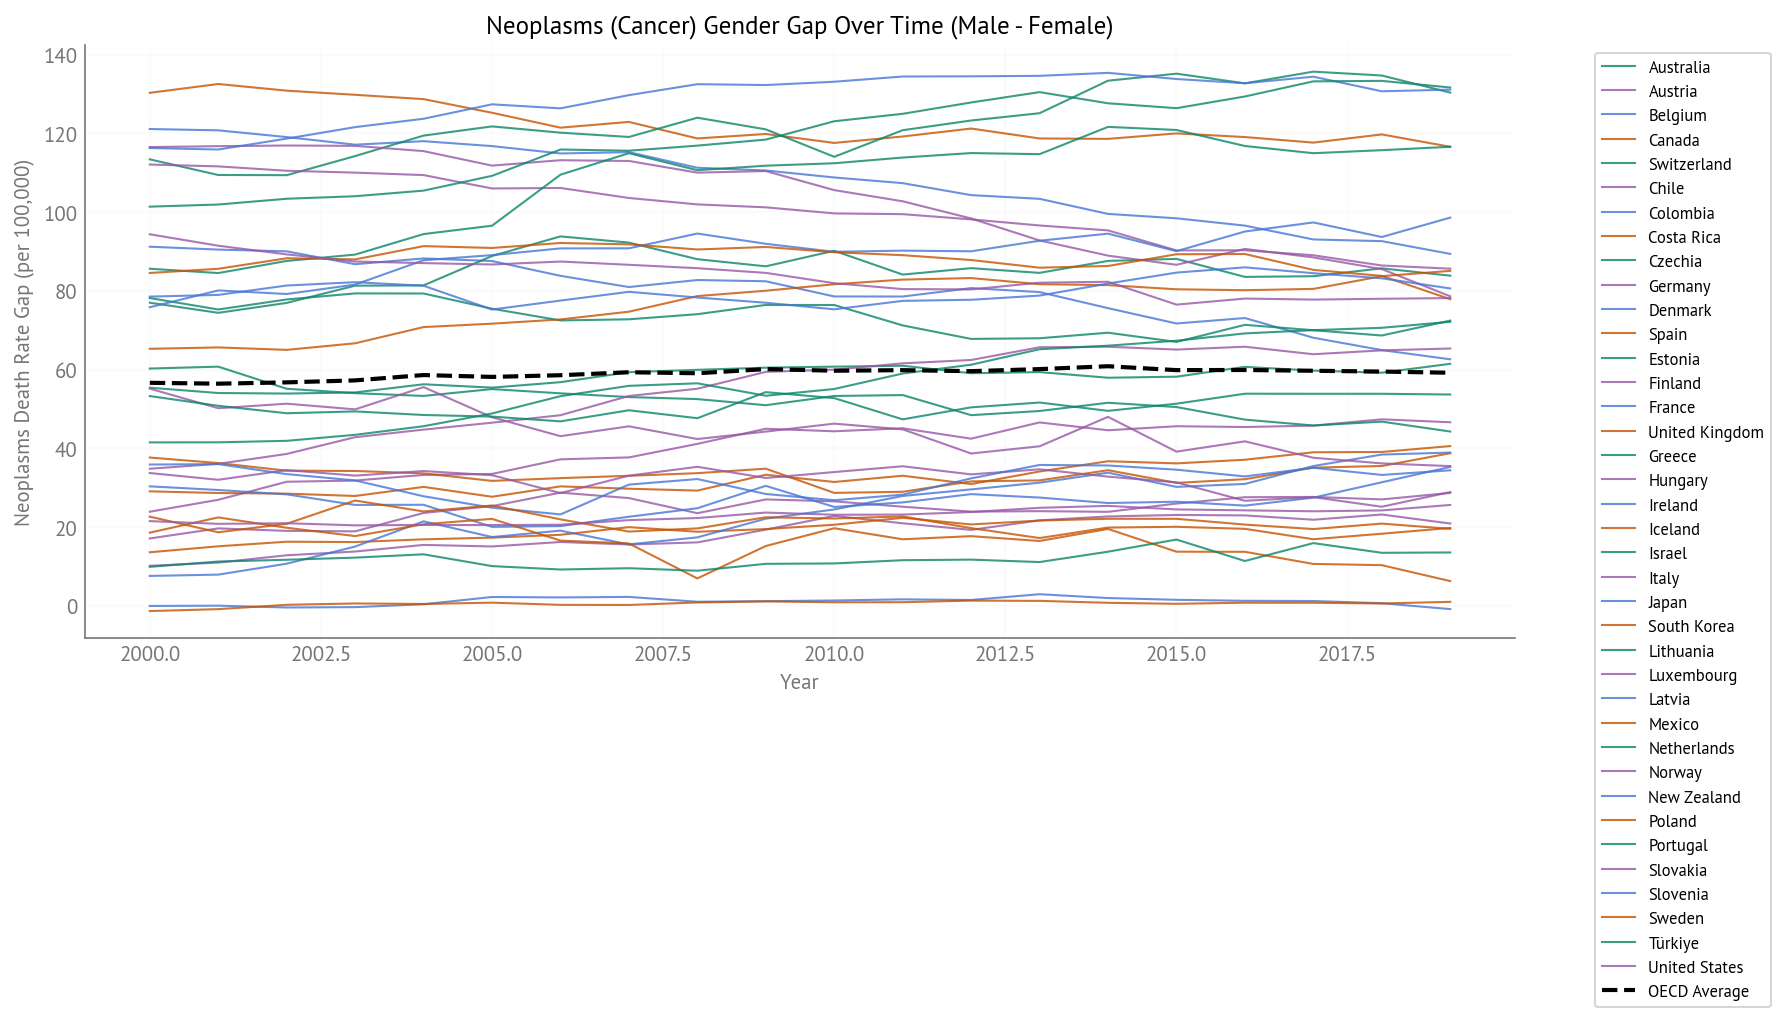
Figure 39:Cancer Gender Gap Over Time (2000-2019) - All OECD Countries
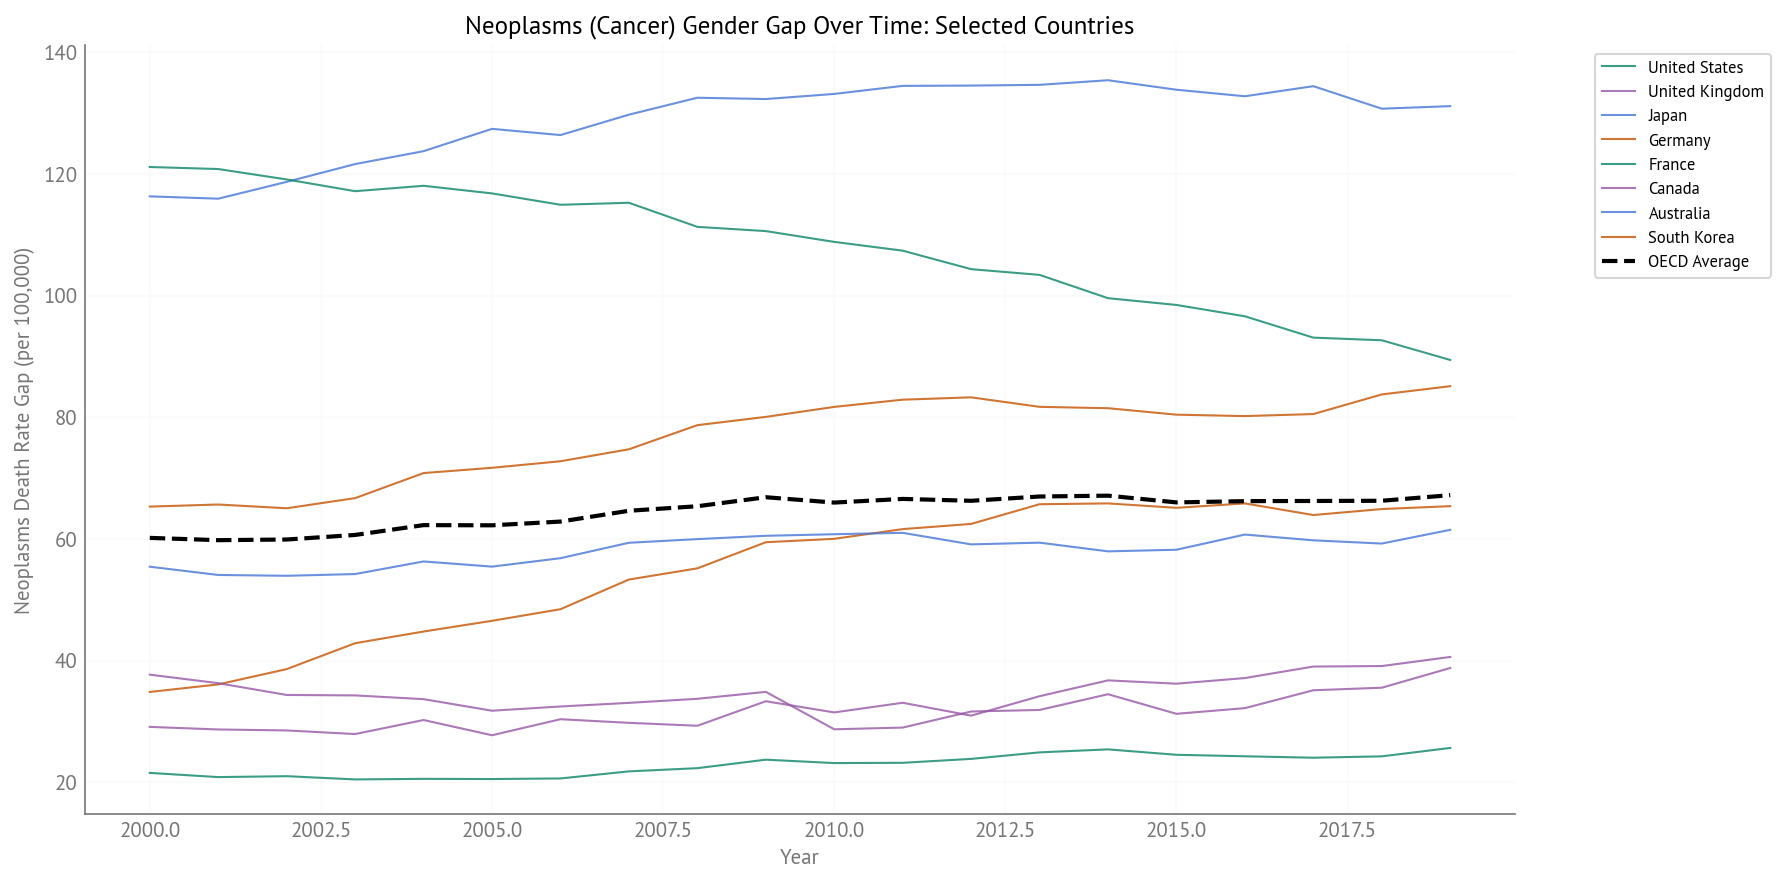
Figure 40:Cancer Gender Gap Over Time (2000-2019) - Selected Countries
Key Observations:
High overall rates: Cancer is one of the leading causes of death
Declining trends: Many countries show declining cancer death rates, reflecting improvements in prevention, screening, and treatment
Gender gaps vary: Some countries show higher male rates, while others show higher female rates (depending on cancer types)
Increasing importance: Cancer has become the dominant factor in explaining gender gaps in HALE and LE (see temporal analysis report)
Unintentional Injuries
Unintentional injuries include deaths from accidents not classified elsewhere (falls, poisonings, etc.).
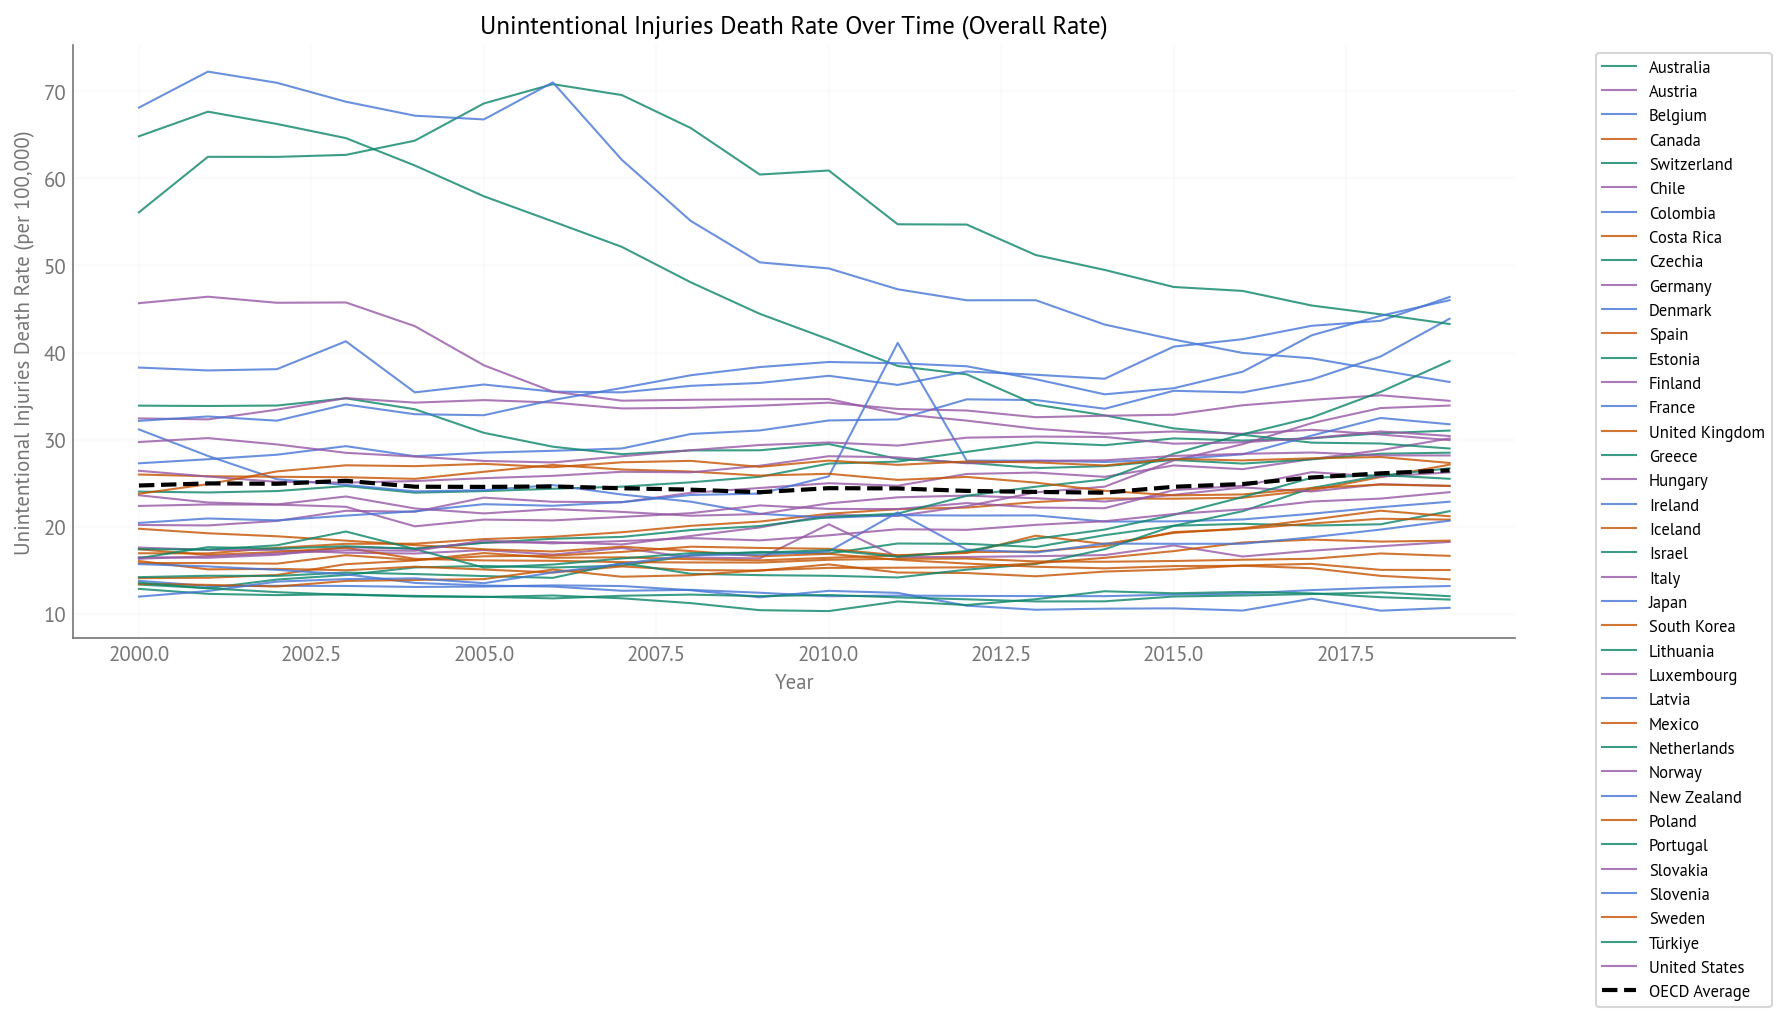
Figure 41:Unintentional Injury Death Rate Over Time (2000-2019) - All OECD Countries
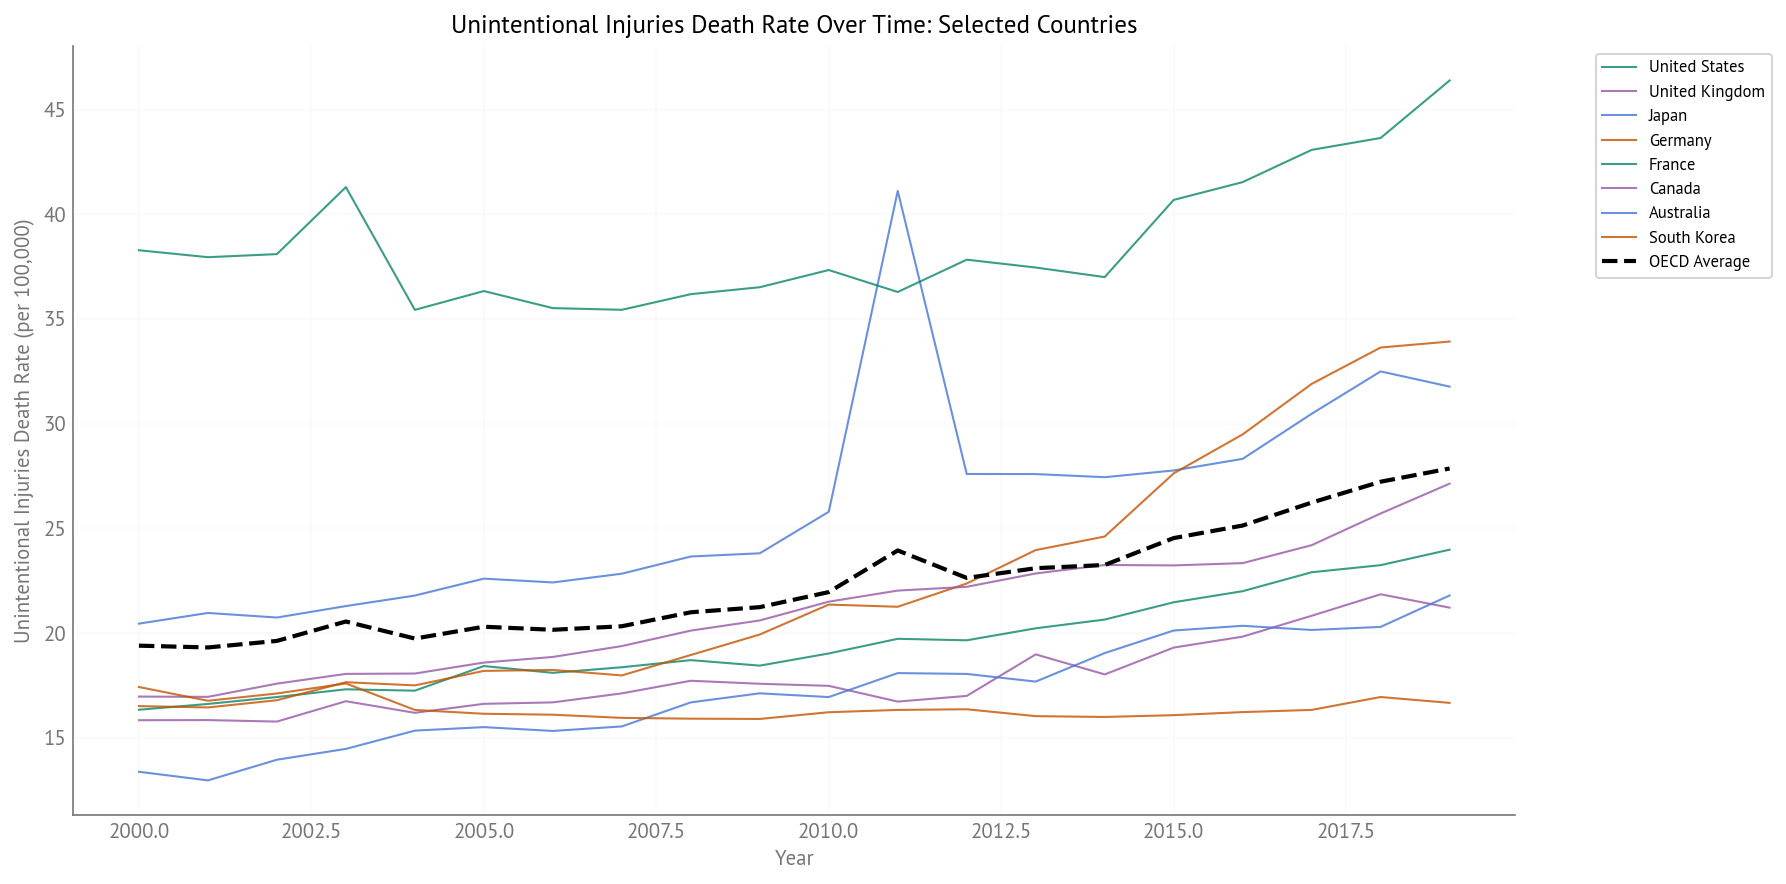
Figure 42:Unintentional Injury Death Rate Over Time (2000-2019) - Selected Countries
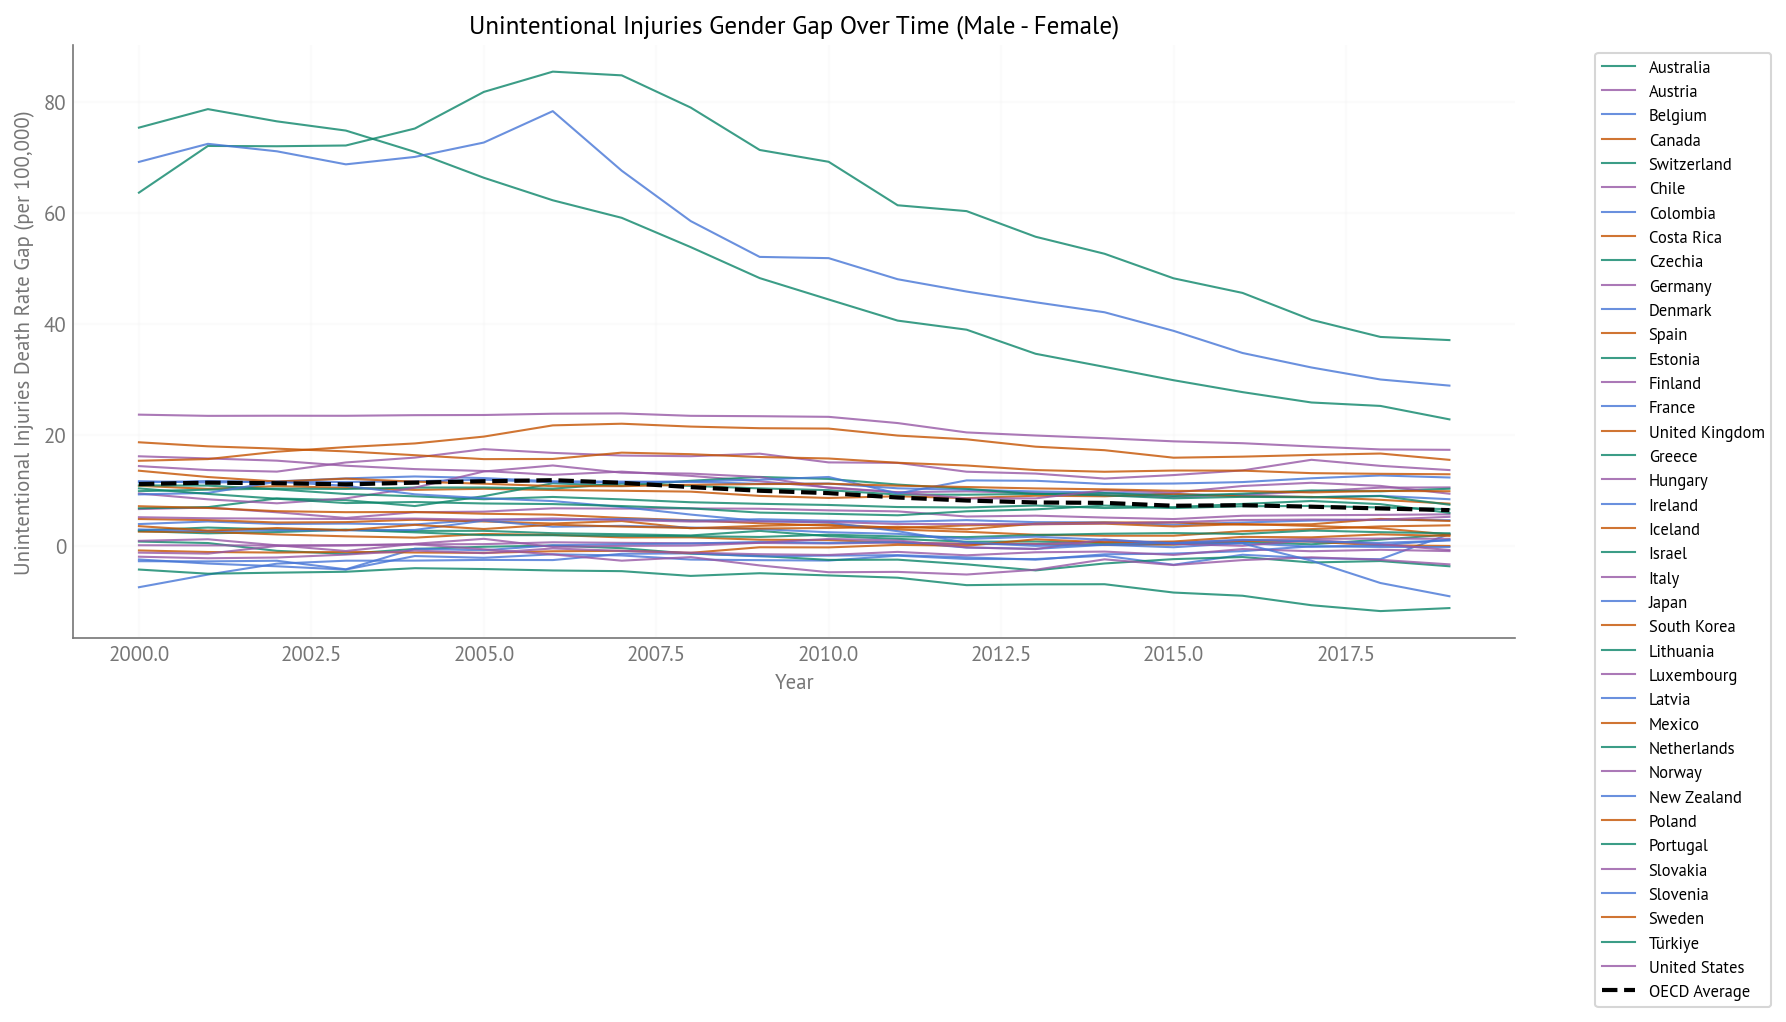
Figure 43:Unintentional Injury Gender Gap Over Time (2000-2019) - All OECD Countries
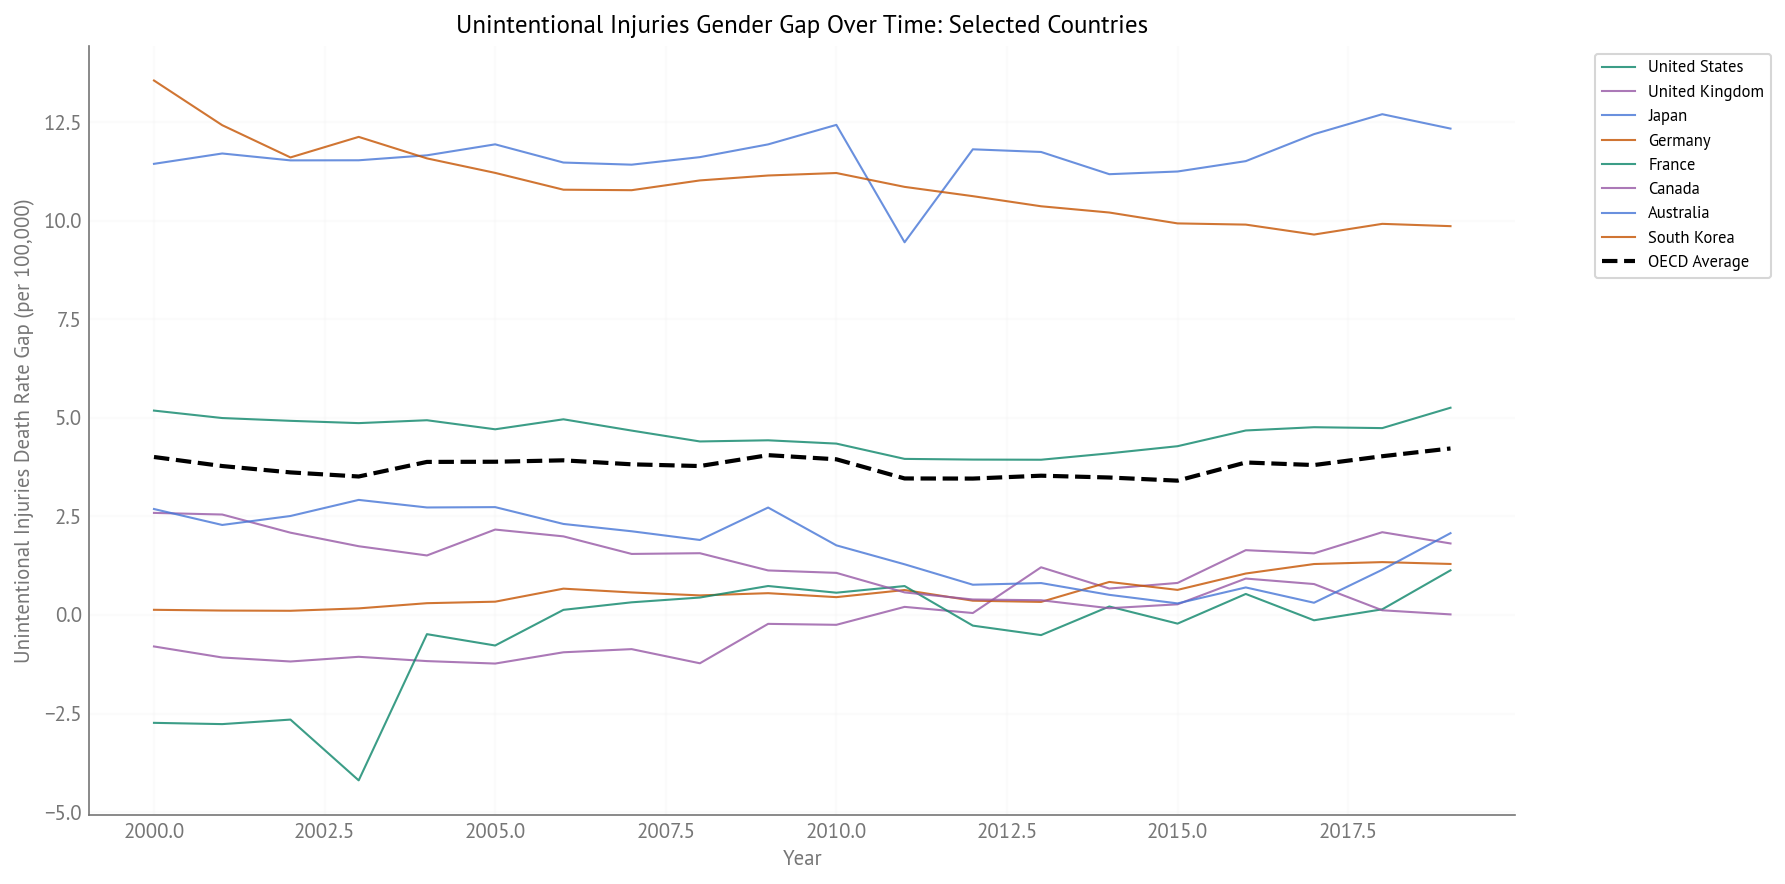
Figure 44:Unintentional Injury Gender Gap Over Time (2000-2019) - Selected Countries
Key Observations:
Moderate rates: Significant but lower than cardiovascular and cancer
Large gender gaps: Men have much higher rates than women
Declining trends: Most countries show declining rates, suggesting improvements in safety
Diabetes
Diabetes represents deaths from diabetes mellitus (primarily type 2).
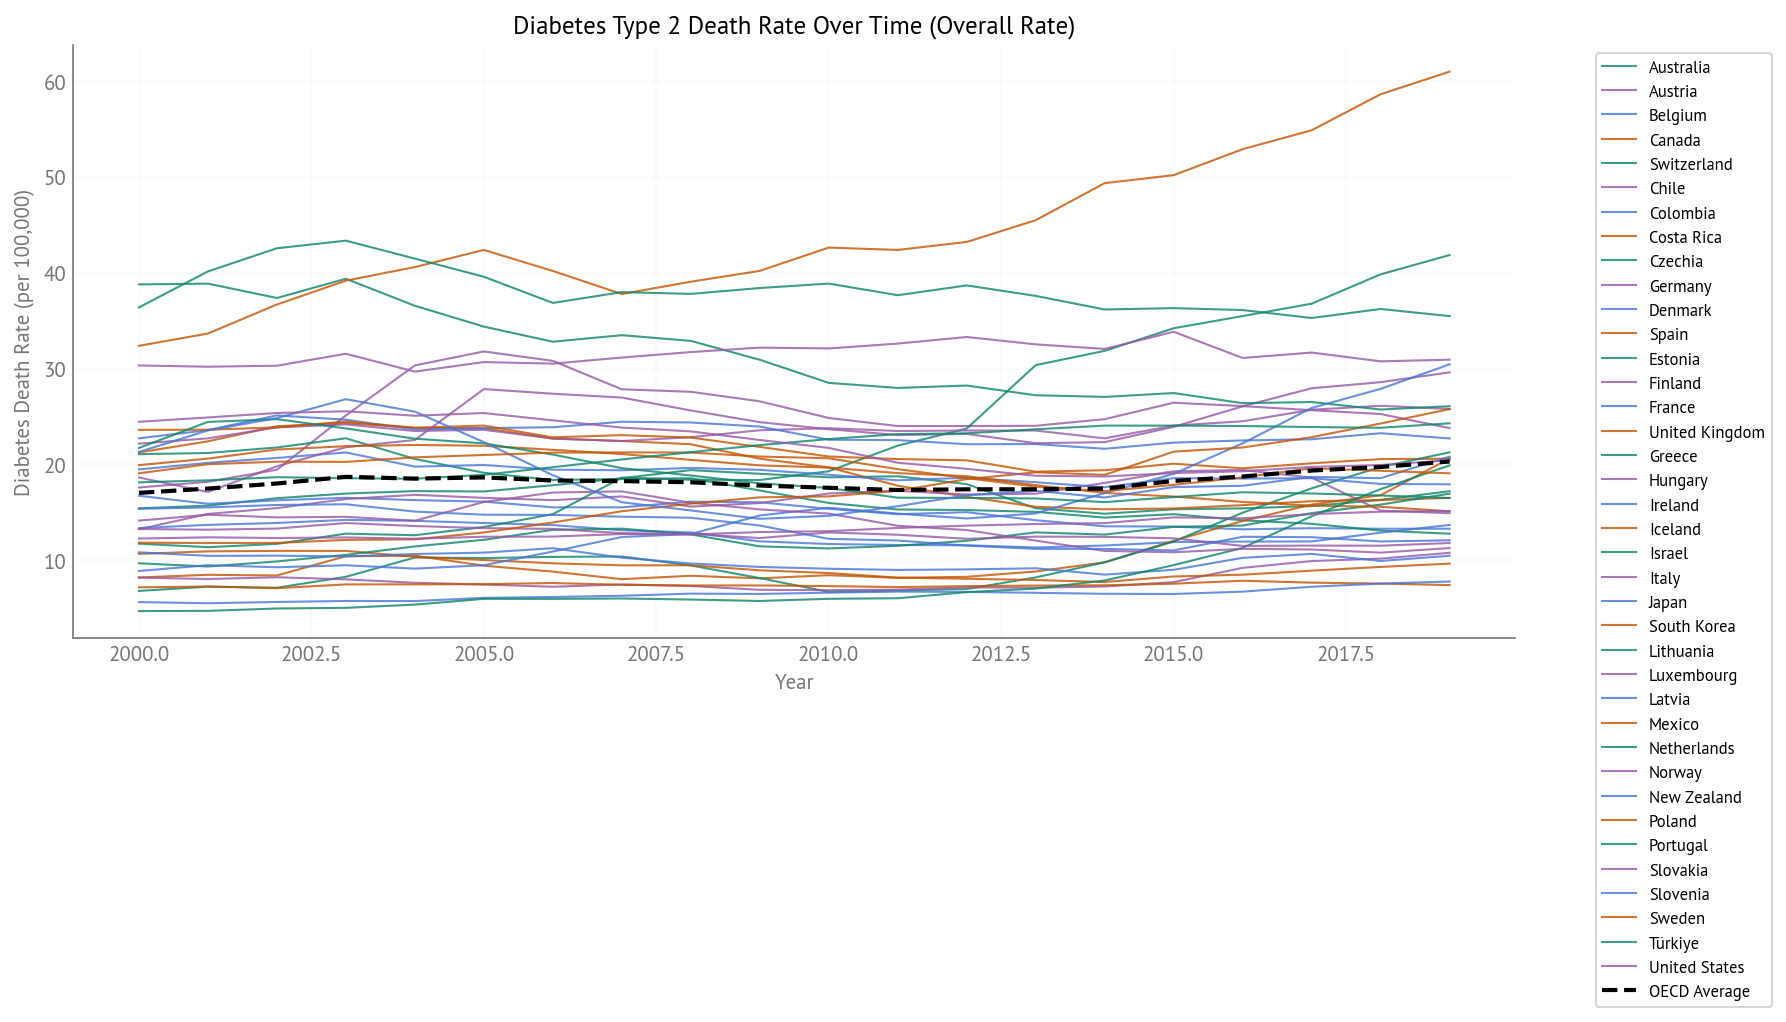
Figure 45:Diabetes Death Rate Over Time (2000-2019) - All OECD Countries
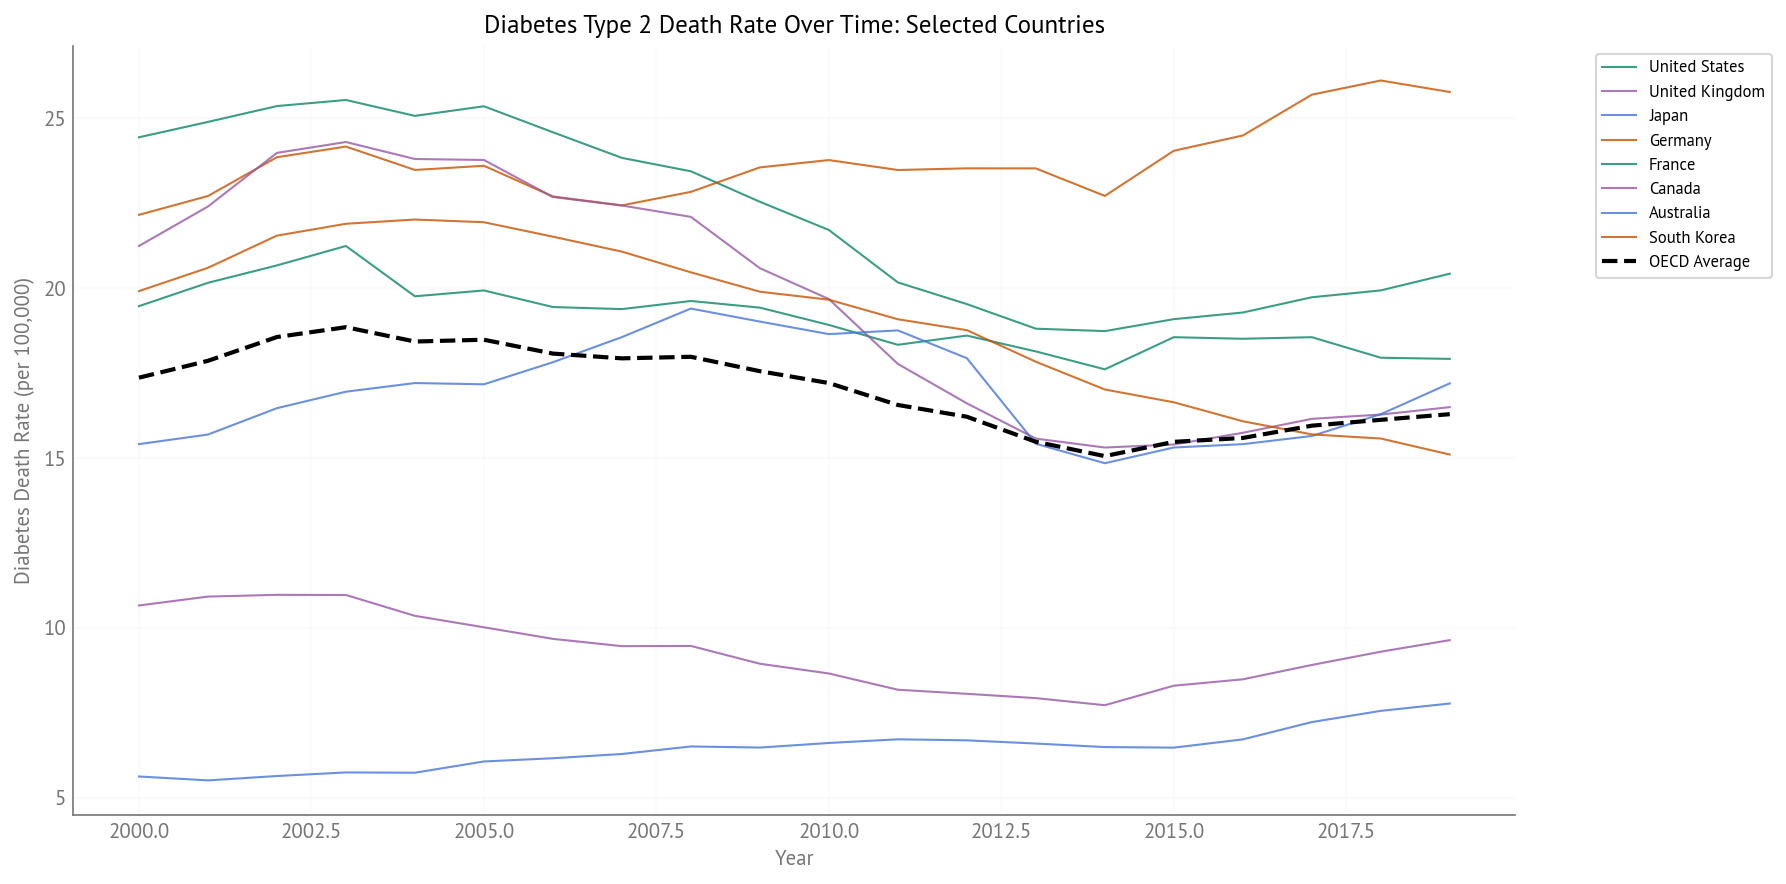
Figure 46:Diabetes Death Rate Over Time (2000-2019) - Selected Countries
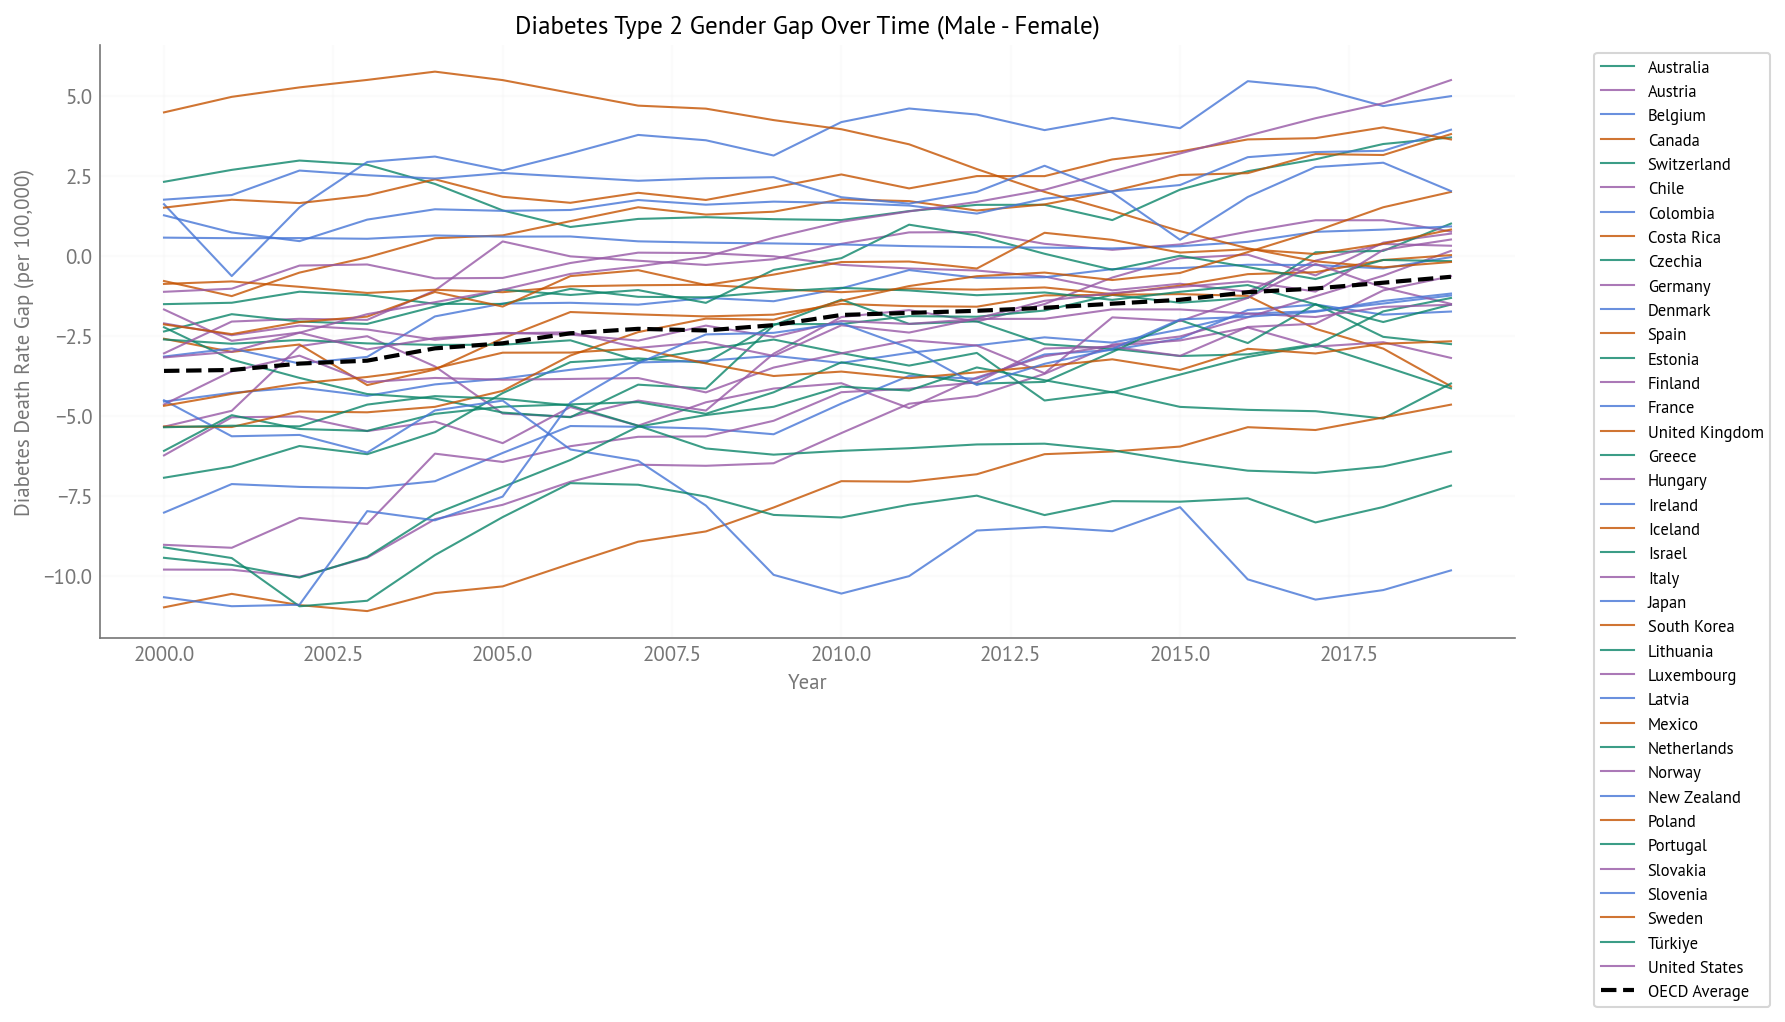
Figure 47:Diabetes Gender Gap Over Time (2000-2019) - All OECD Countries
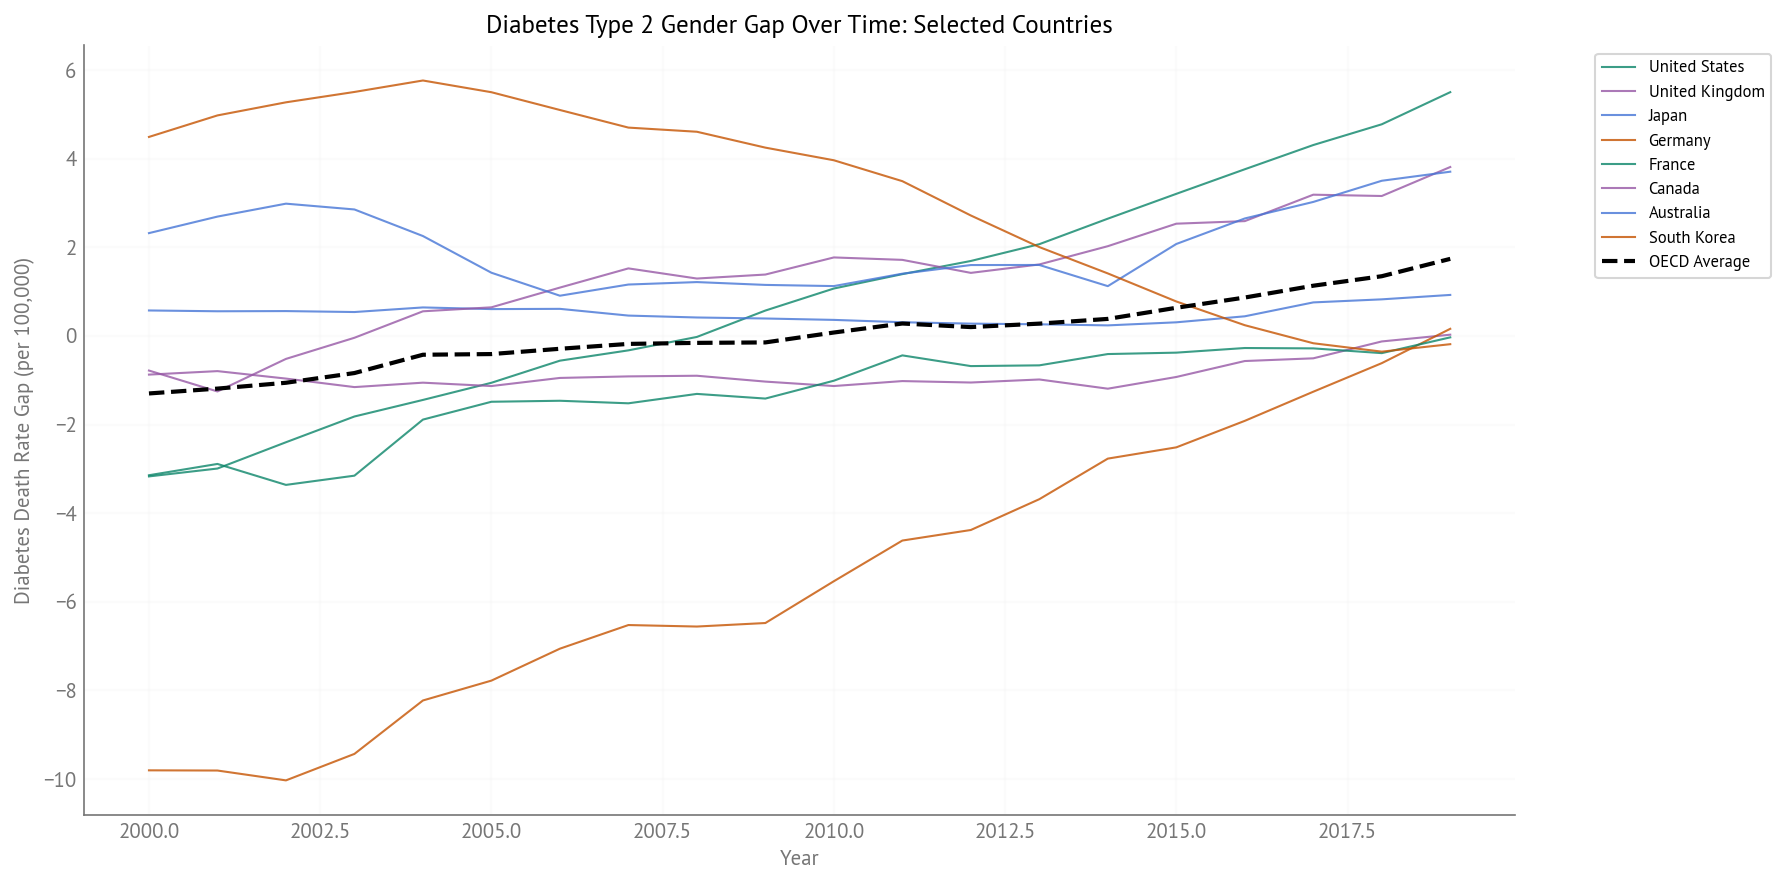
Figure 48:Diabetes Gender Gap Over Time (2000-2019) - All OECD Countries
Key Observations:
Moderate rates: Lower than cardiovascular and cancer but still significant
Increasing trends: Many countries show increasing diabetes rates, reflecting the global diabetes epidemic
Gender gaps vary: Gaps vary by country and may be narrowing in some areas
Summary: Indicator Superlatives
The following tables summarize which countries have the highest and lowest means and slopes for each indicator, providing insights into:
Which countries have the best/worst outcomes (highest/lowest means)
Which countries are improving most/least (highest/lowest slopes)
Overall Rates (Mid Values)
| Indicator | Highest Mean Country | Highest Mean Value | Lowest Mean Country | Lowest Mean Value | Highest Slope Country | Highest Slope Value | Lowest Slope Country | Lowest Slope Value |
|---|---|---|---|---|---|---|---|---|
| Alcohol | Estonia | 19.7 | Colombia | 0.196 | Slovenia | 0.341 | Estonia | -0.889 |
| Cardiovascular | Latvia | 784 | Mexico | 108 | Lithuania | 8.35 | Estonia | -11.1 |
| ChronicRespiratory | Denmark | 78.9 | Latvia | 17.2 | Hungary | 1.52 | Lithuania | -0.507 |
| Suicide | Lithuania | 41.7 | Türkiye | 2.71 | South Korea | 0.352 | Lithuania | -0.977 |
| Homicide | Colombia | 46.2 | Japan | 0.634 | Mexico | 1 | Colombia | -2.91 |
| RoadTraffic | Lithuania | 17.5 | Sweden | 4.44 | Costa Rica | 0.00107 | Latvia | -1.06 |
| LiverDisease | Hungary | 49 | Iceland | 3.27 | Lithuania | 0.394 | Hungary | -1.85 |
| Neoplasms | Hungary | 342 | Mexico | 69.1 | Japan | 5.69 | Luxembourg | -2.02 |
| UnintentionalInjury | Lithuania | 57.1 | Türkiye | 11.9 | Netherlands | 1.04 | Estonia | -2.35 |
| Diabetes | Mexico | 44.1 | Japan | 6.43 | Czechia | 1.71 | Israel | -0.786 |
Key Insights from Rates Summary:
Cardiovascular disease: Shows the highest overall rates, but most countries have declining trends (negative slopes)
Cancer (Neoplasms): High rates with mixed trends—some countries improving, others stable
Road traffic injuries: Generally show strong declining trends, reflecting successful safety interventions
Suicide: Mixed trends—some countries showing concerning increases, others showing improvements
Diabetes: Many countries show increasing trends, reflecting the global diabetes epidemic
Gender Gaps (Gap Values)
| Indicator | Highest Mean Country | Highest Mean Value | Lowest Mean Country | Lowest Mean Value | Highest Slope Country | Highest Slope Value | Lowest Slope Country | Lowest Slope Value |
|---|---|---|---|---|---|---|---|---|
| Alcohol | Estonia | 25.3 | Colombia | 0.297 | Slovenia | 0.596 | Estonia | -0.9 |
| Cardiovascular | Costa Rica | 22.9 | Austria | -94.9 | Germany | 4.62 | Lithuania | -4.21 |
| ChronicRespiratory | Spain | 35.3 | Iceland | -12.2 | Japan | 0.857 | Belgium | -1.21 |
| Suicide | Lithuania | 57.5 | Türkiye | 2.87 | South Korea | 0.467 | Lithuania | -1.35 |
| Homicide | Colombia | 75.3 | Switzerland | 0.0575 | Mexico | 1.59 | Colombia | -4.69 |
| RoadTraffic | Costa Rica | 21.1 | Iceland | 3.07 | Colombia | 0.14 | Latvia | -1.22 |
| LiverDisease | Hungary | 44.9 | Iceland | 1.07 | Lithuania | 0.459 | Hungary | -1.88 |
| Neoplasms | Japan | 129 | Mexico | 0.609 | Portugal | 1.86 | Hungary | -2.09 |
| UnintentionalInjury | Lithuania | 63.3 | Netherlands | -6.44 | Denmark | 0.234 | Estonia | -3.29 |
| Diabetes | Denmark | 3.54 | Portugal | -8.27 | Germany | 0.544 | South Korea | -0.343 |
Key Insights from Gaps Summary:
Large gaps persist: Most indicators show substantial gender gaps, with men having higher rates
Suicide and homicide: Show the largest gender gaps, with men having much higher rates
Mixed trends: Some indicators show narrowing gaps (improvement), while others show widening gaps (concern)
Alcohol and liver disease: Show large gaps with varying trends across countries
Key Findings and Conclusions
Overall Trends
Gender gaps are narrowing: Both HALE and Life Expectancy gaps show gradual narrowing trends across OECD countries, suggesting overall improvement in gender equity in health outcomes.
Success stories: Several countries (notably Netherlands, Switzerland) have achieved or maintained near-zero gender gaps in HALE, demonstrating that large gaps are not inevitable.
Variation persists: Despite overall improvement, substantial variation remains across countries, with gaps ranging from near zero to over 6 years.
Indicator-Specific Findings
Cardiovascular disease:
Declining rates across most countries (success story)
Gender gaps narrowing (improvement in men’s cardiovascular health)
Declining importance in explaining gender gaps over time
Cancer (Neoplasms):
Increasing importance in explaining gender gaps (now dominant factor)
Declining rates in many countries (improvements in prevention/treatment)
Gender gaps vary by country and cancer type
Suicide:
Large gender gaps persist (men have much higher rates)
Mixed trends across countries (some improving, some worsening)
Critical intervention target given its importance in explaining gaps
Road traffic injuries:
Strong declining trends (successful safety interventions)
Declining importance in explaining gender gaps
Demonstrates that targeted interventions can be effective
Diabetes:
Increasing rates in many countries (global epidemic)
Requires continued attention and intervention
Policy Implications
Priority interventions:
Suicide prevention: Highest potential impact on gender gaps
Cancer prevention and treatment: Dominant factor in explaining gaps
Unintentional injury prevention: Consistently important across time periods
Success stories to learn from:
Cardiovascular disease: Successful prevention and treatment programs
Road traffic injuries: Effective safety regulations and infrastructure improvements
Countries with near-zero gaps: Netherlands, Switzerland provide models for other countries
Areas of concern:
Diabetes: Increasing rates require attention
Suicide: Mixed trends suggest need for targeted prevention programs
Persistent gaps: Large gender gaps in several indicators suggest need for gender-specific interventions
Notes
All analyses use data from 2000-2019, excluding 2020+ to avoid COVID-19 pandemic distortions
OECD countries (38 countries) are included for consistency and data quality
Gender gaps are calculated as Male - Female for predictors, Female - Male for targets (HALE/LE)
Linear trends (slopes) provide a simple summary but may not capture non-linear patterns
Mean values provide overall burden but may mask important temporal variation