Purpose
This report summarizes the exploratory data analysis of gender gaps in Healthy Life Expectancy (HALE) and Life Expectancy, along with the predictors used in the Bayesian panel data model. The analysis focuses on OECD countries using the most recent available data up to 2019 (excluding 2020+ to avoid COVID-19 pandemic distortions).
Target Variables
Healthy Life Expectancy (HALE)
HALE at birth measures the average number of years that a person can expect to live in “full health” by taking into account years lived in less than full health due to disease and/or injury. This is the primary target variable for the analysis.
The gender gap is calculated as Female HALE - Male HALE (positive values indicate women live longer in full health).
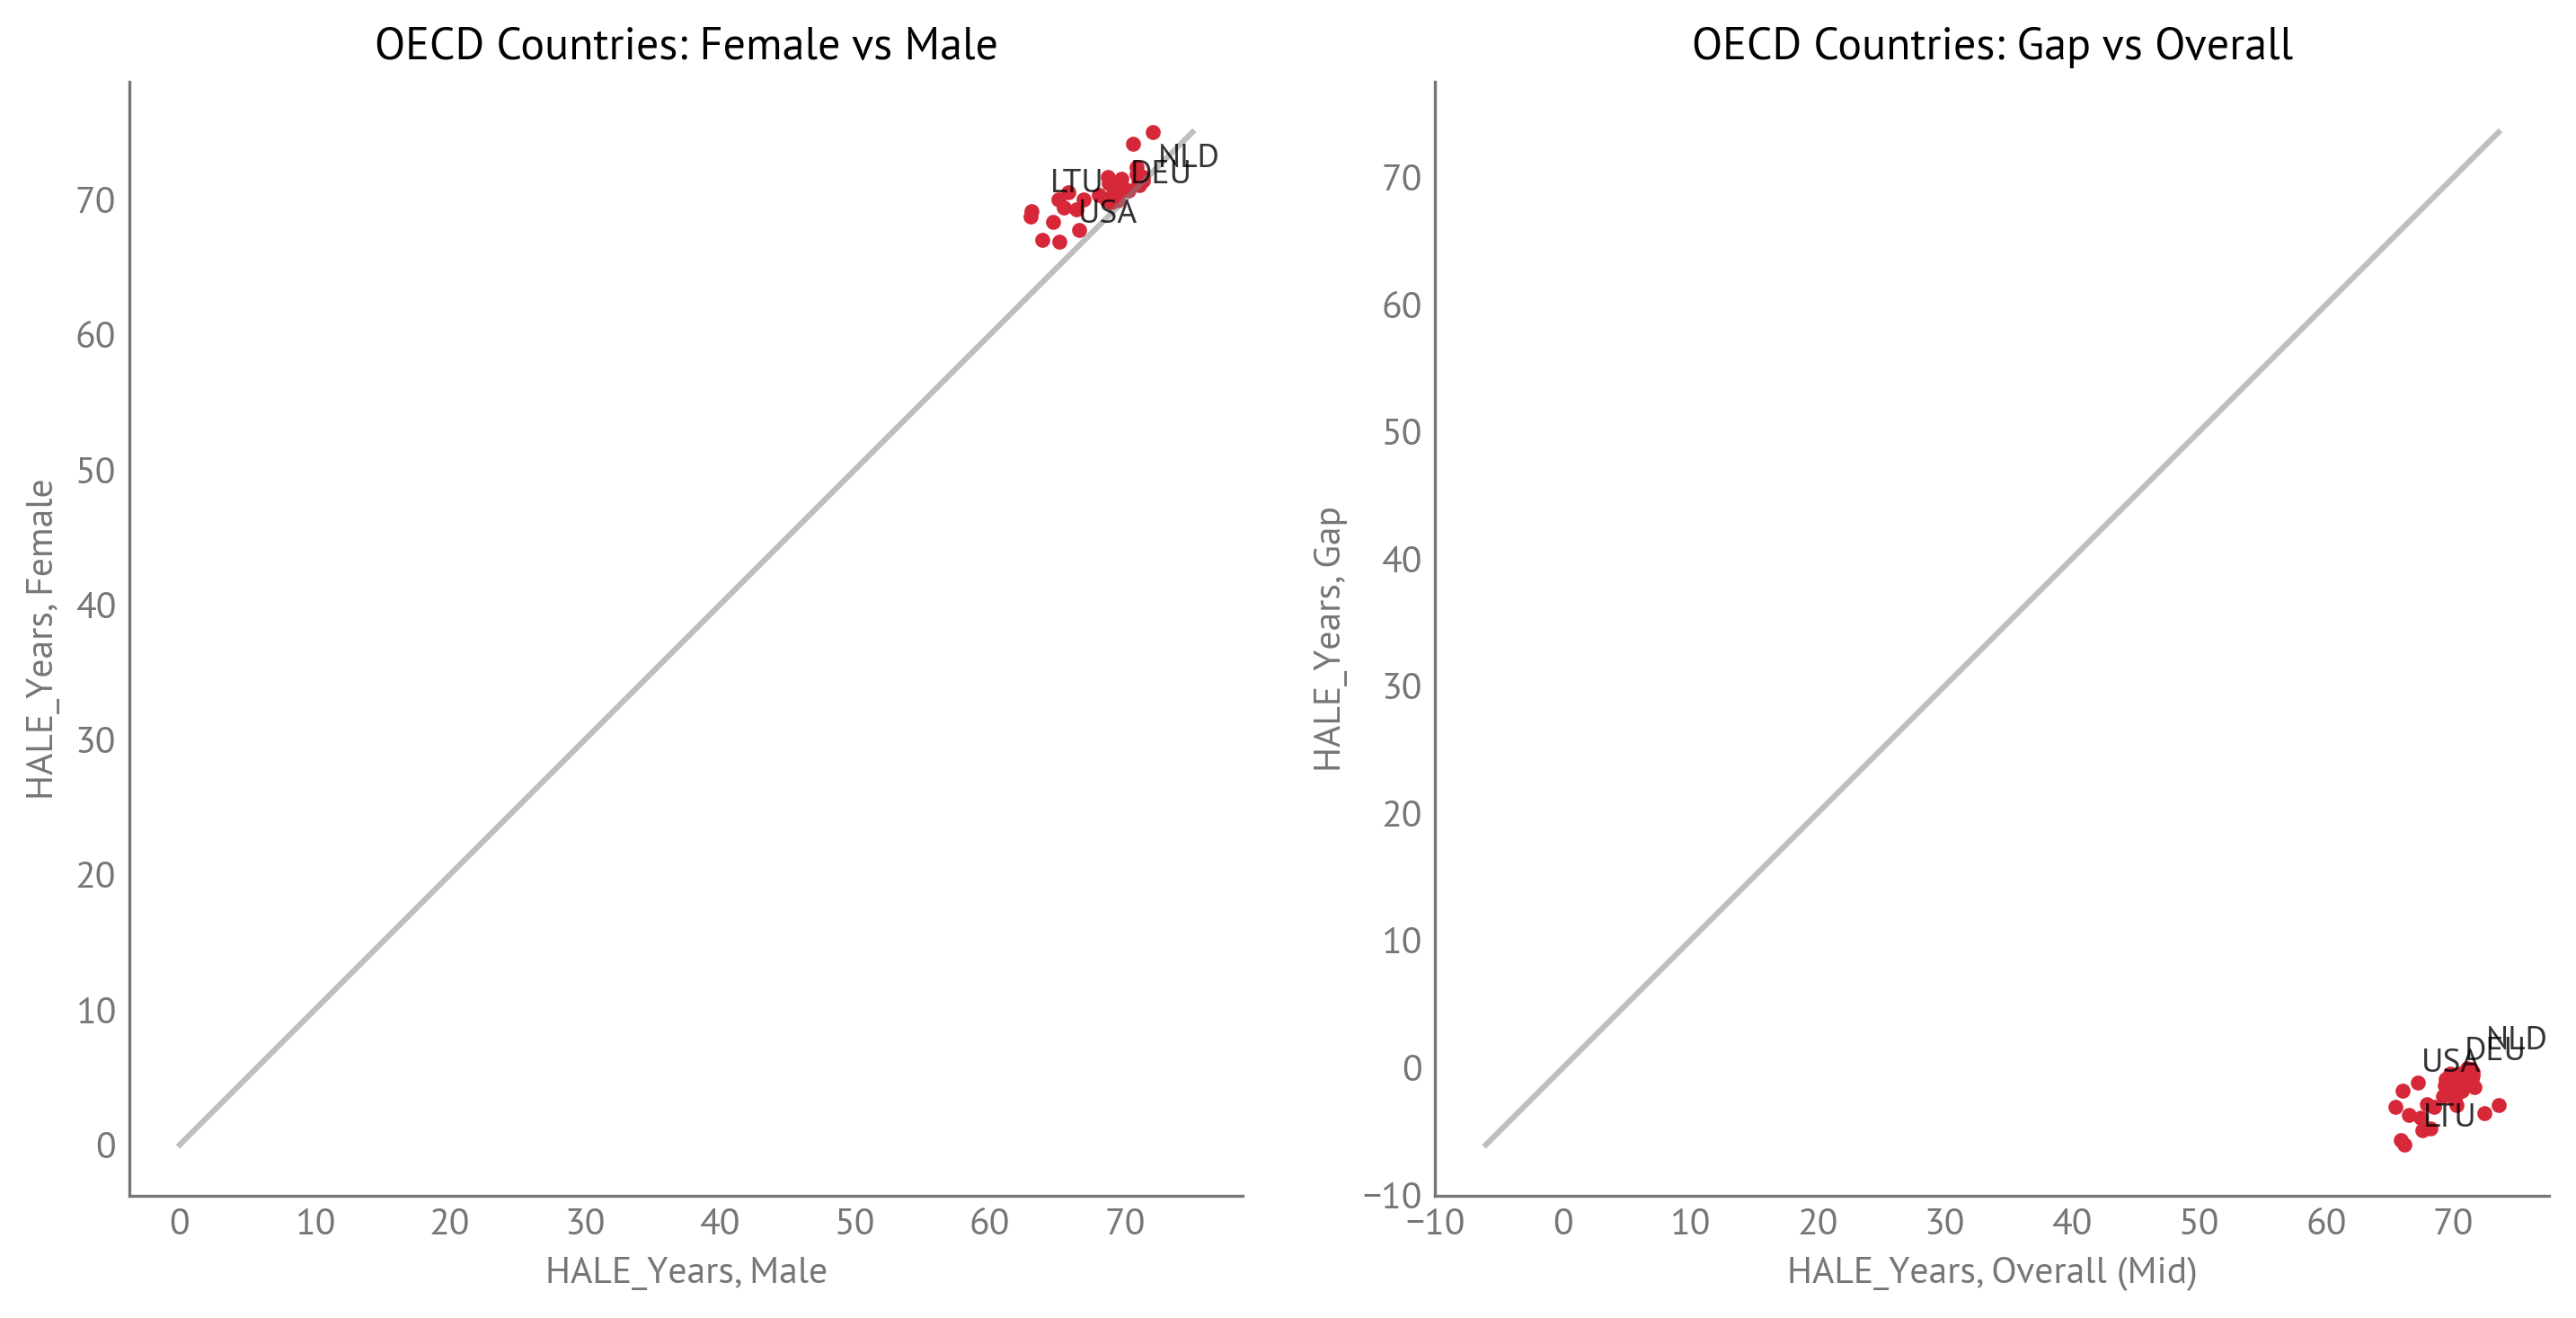
Figure 1:HALE: Female vs Male and Gap vs Overall (OECD Countries)
Life Expectancy
Life Expectancy at birth measures the average number of years that a person can expect to live, regardless of health status. This is the secondary target variable, allowing comparison of which factors explain the gender gap in overall life expectancy versus healthy life expectancy.
The gender gap is calculated as Female Life Expectancy - Male Life Expectancy (positive values indicate women live longer).
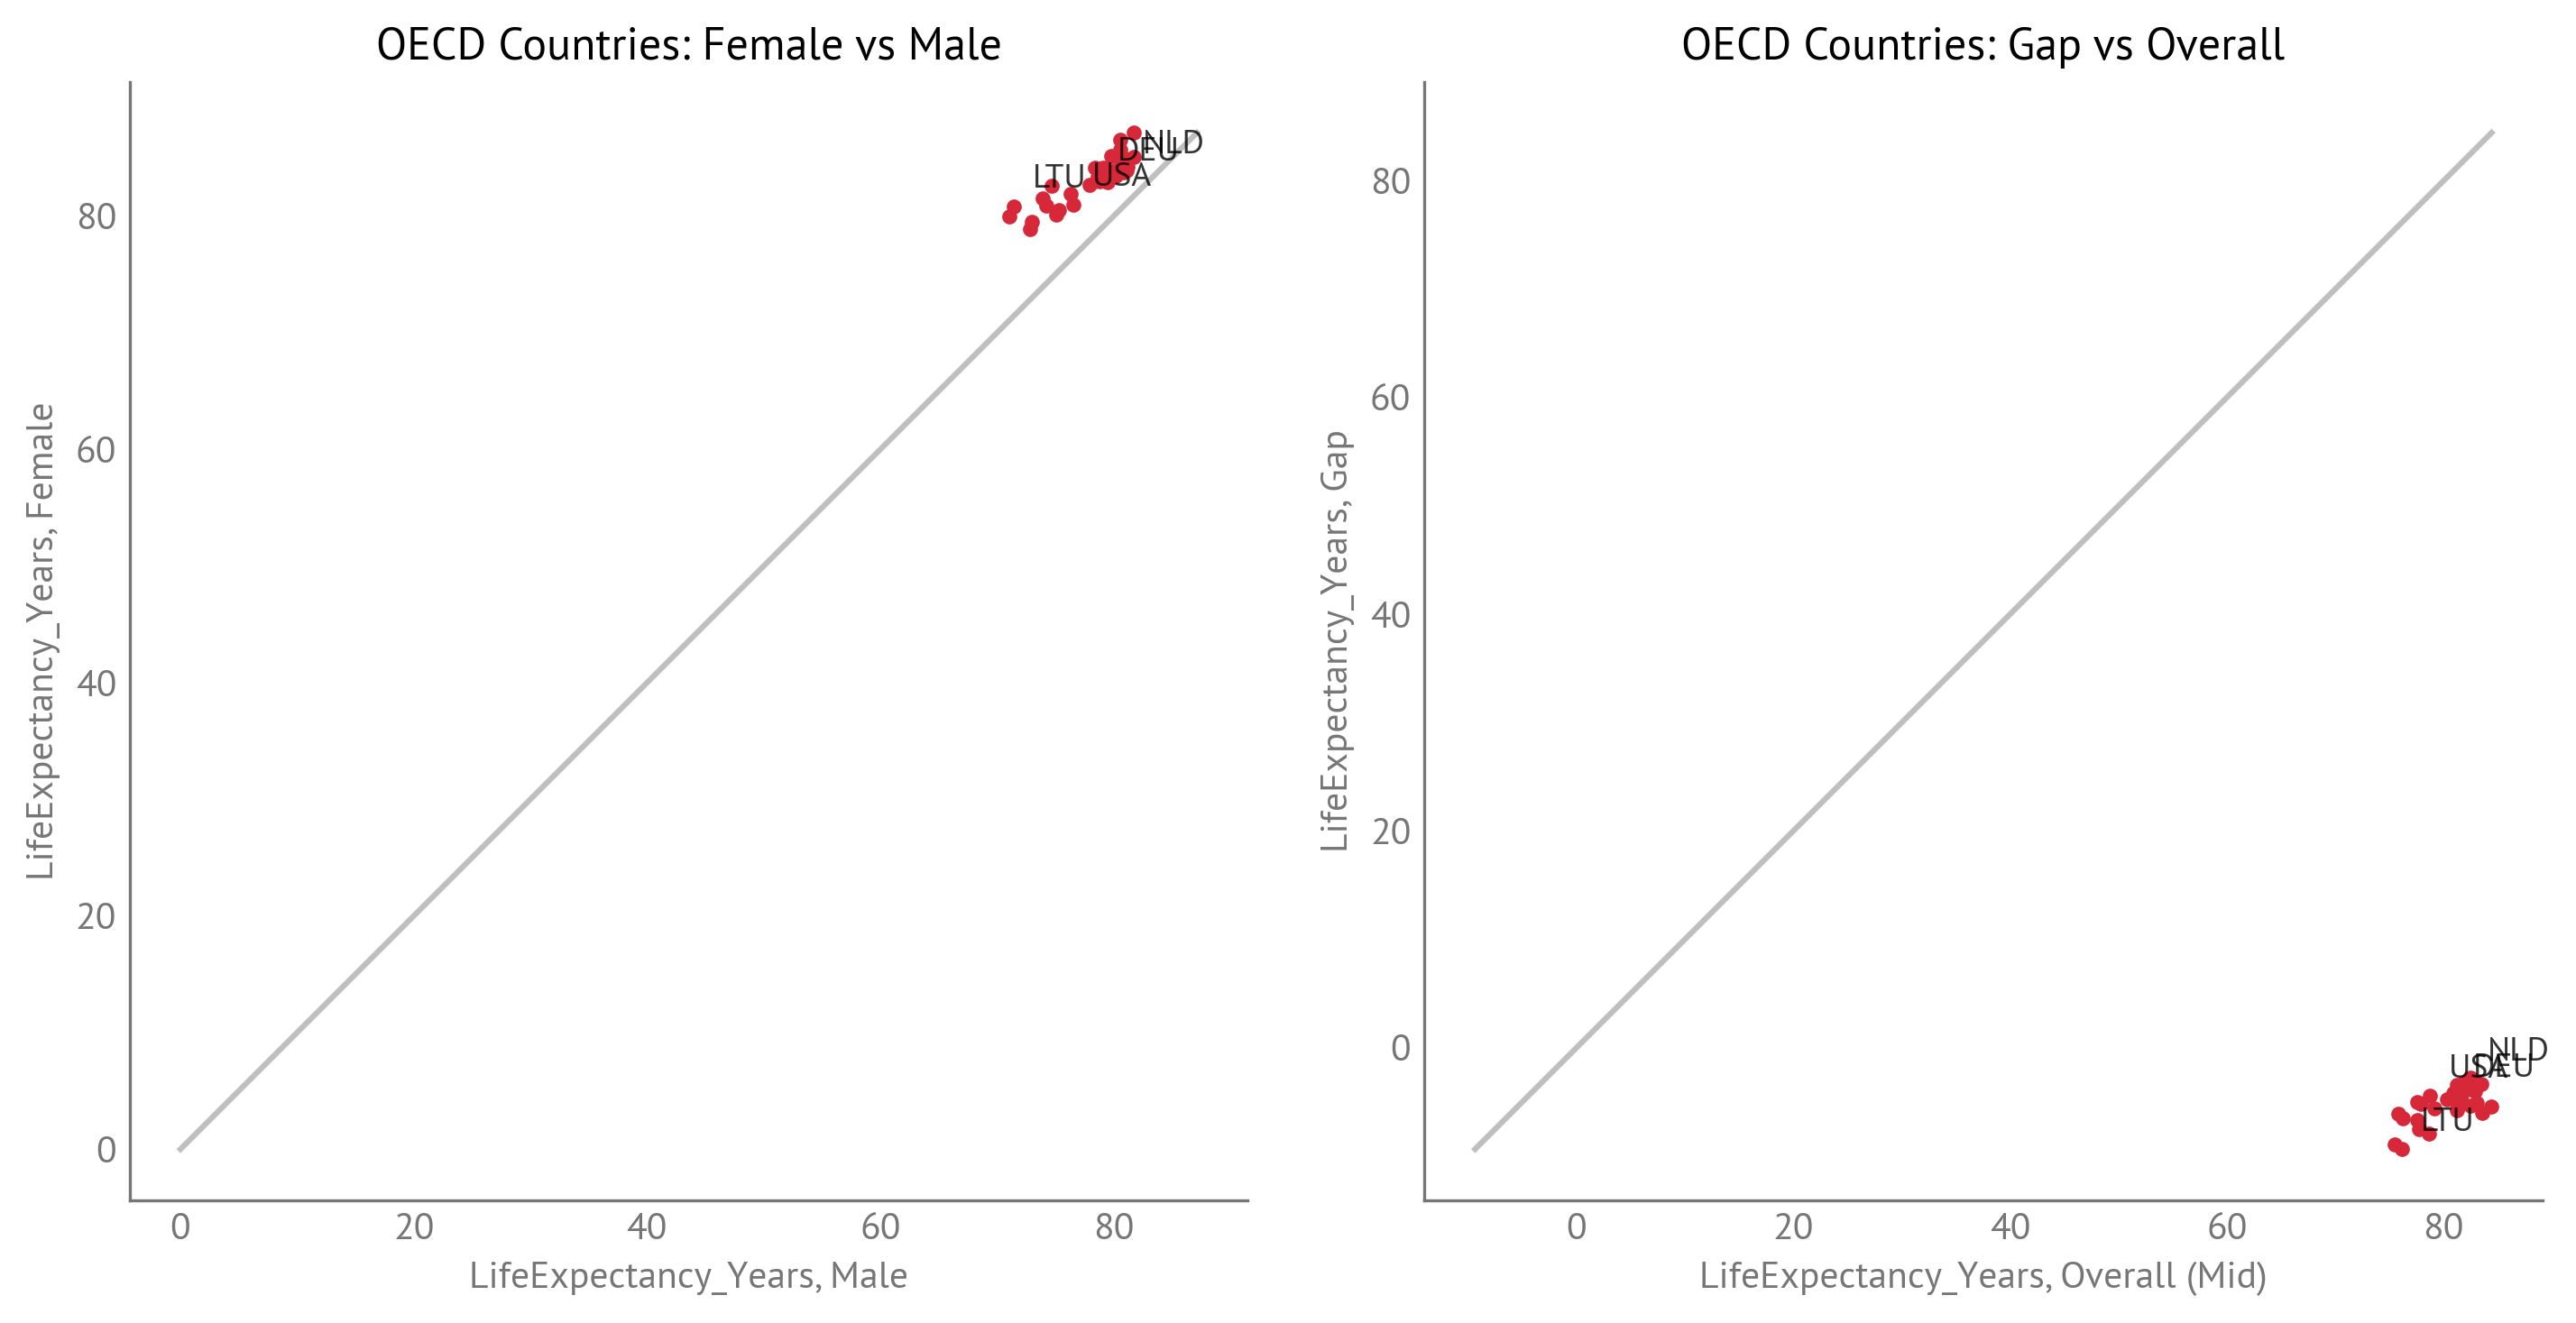
Figure 2:Life Expectancy: Female vs Male and Gap vs Overall (OECD Countries)
Predictors
The following predictors are used in the Bayesian panel data model. All indicators are from IHME (Institute for Health Metrics and Evaluation) Global Burden of Disease data, providing consistent methodology and temporal coverage (1990-2023).
Alcohol Use Disorders
Alcohol use disorders death rates (per 100,000 population) - Deaths from alcohol use disorders. Men typically have higher rates of alcohol-related mortality than women.
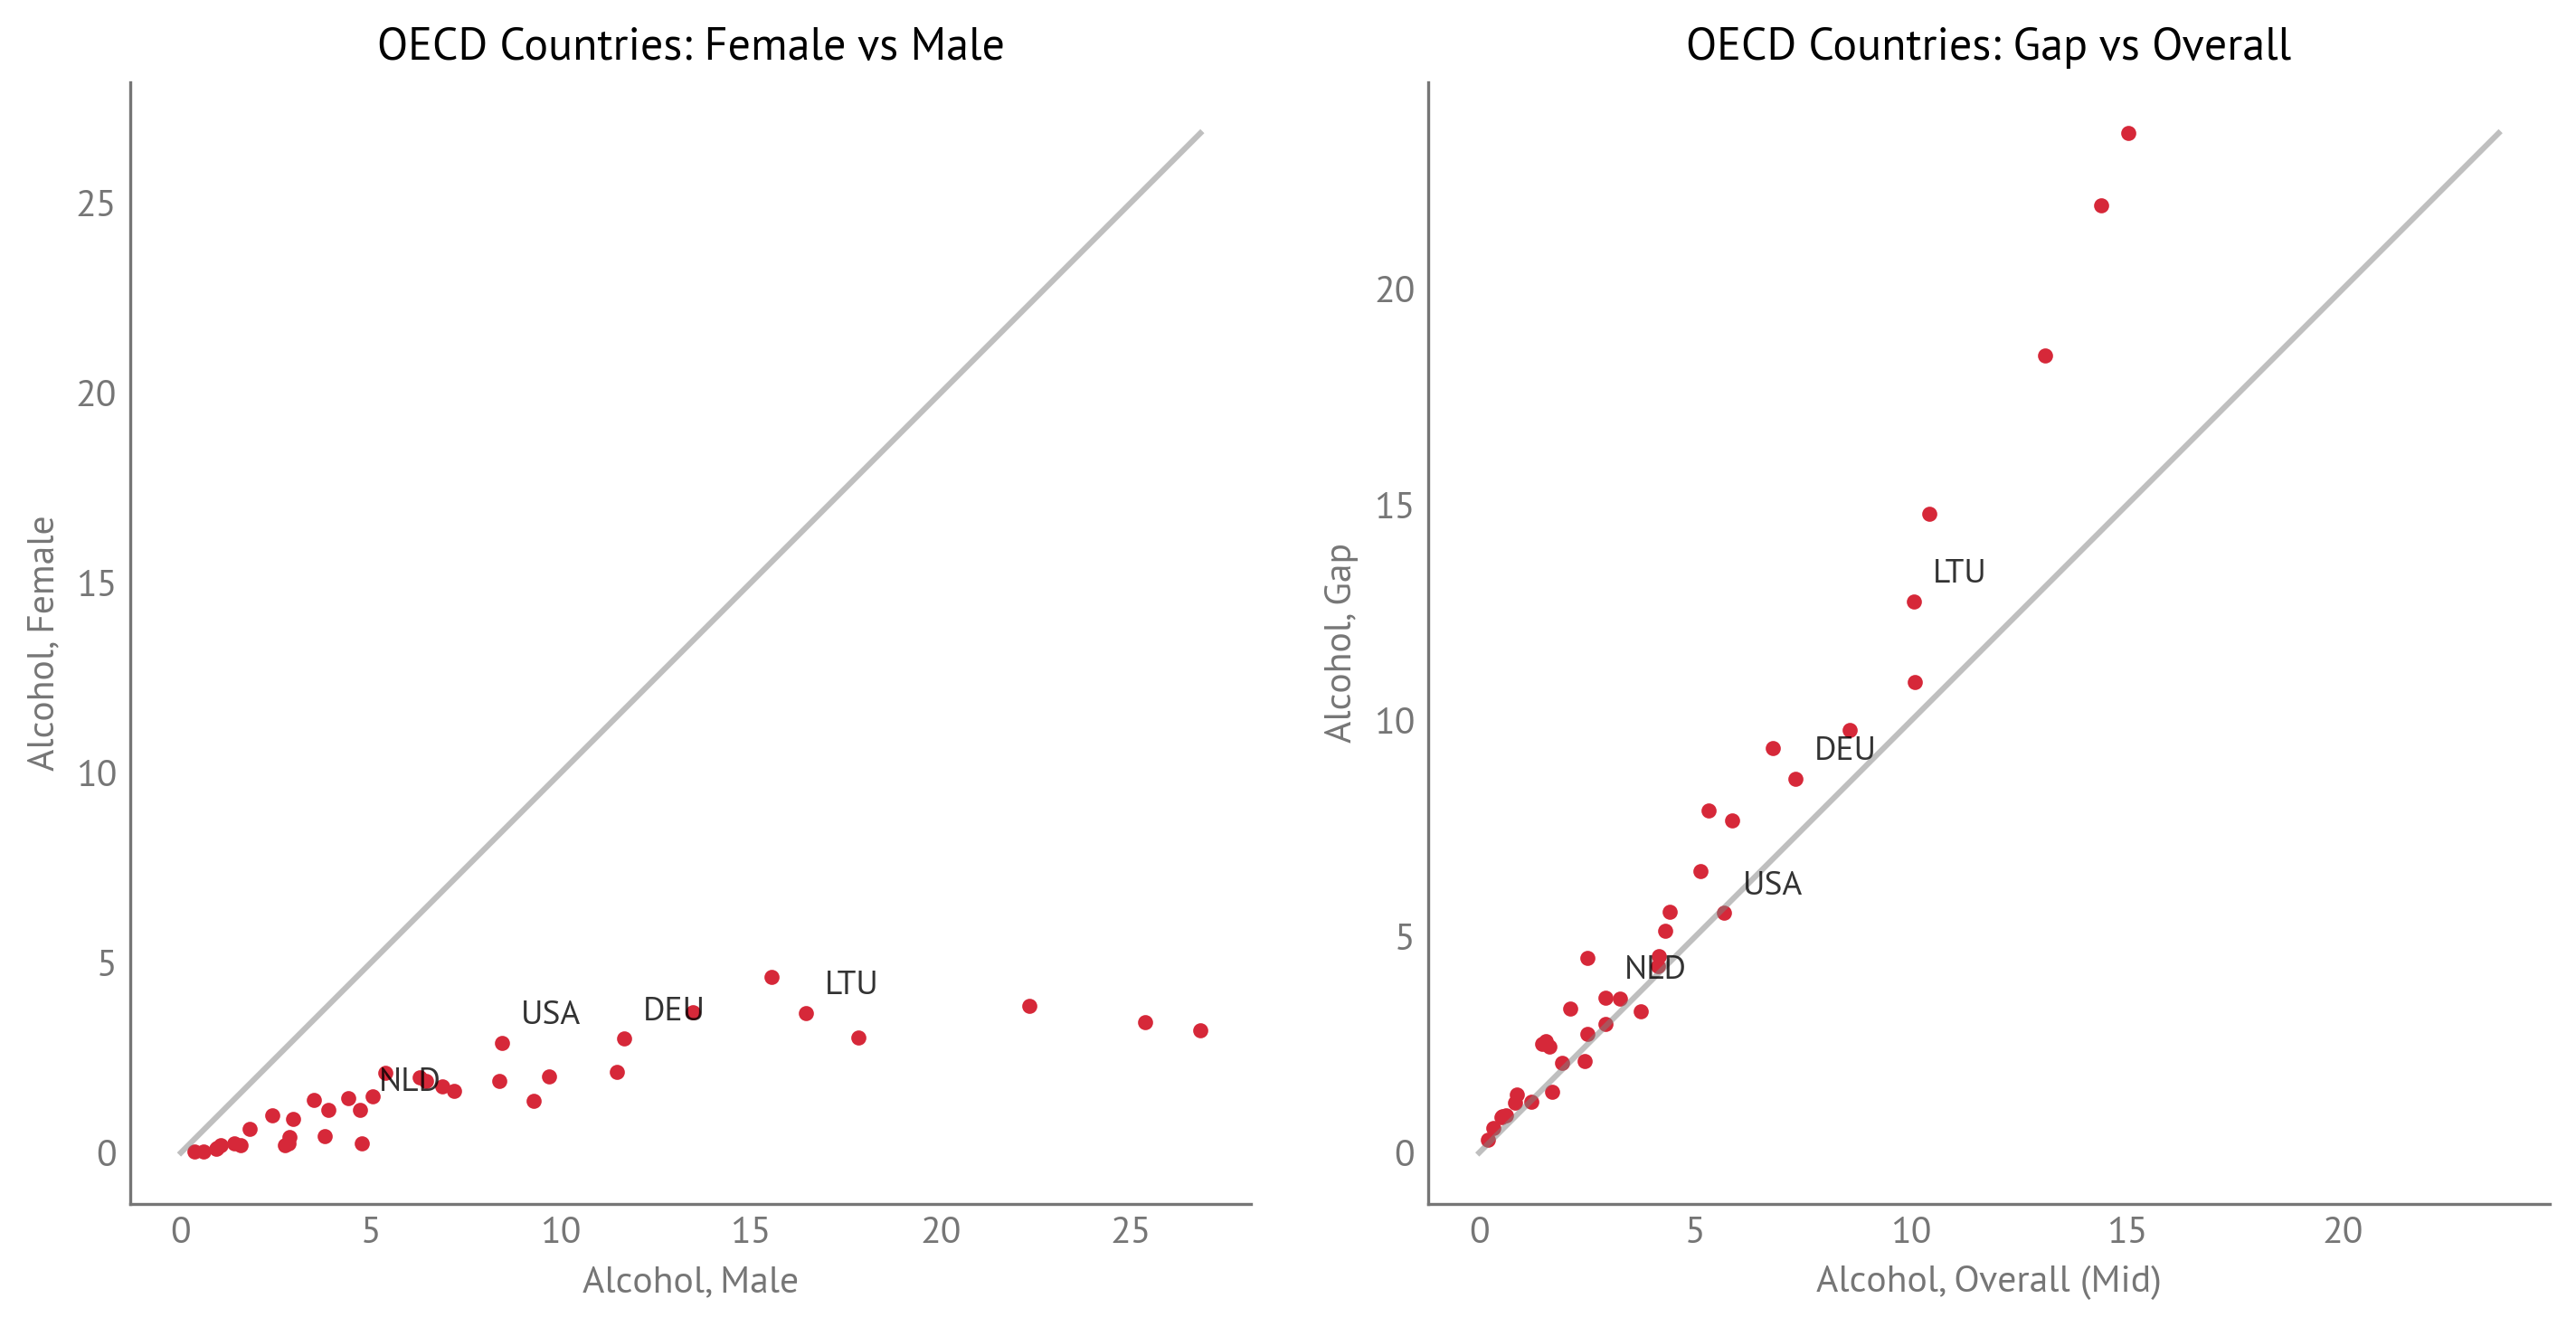
Figure 3:Alcohol Use Disorders: Female vs Male and Gap vs Overall (OECD Countries)
Self-Harm (Suicide)
Self-harm (suicide) death rates (per 100,000 population) - Deaths from self-harm (suicide). Men typically have much higher suicide rates than women in most countries.
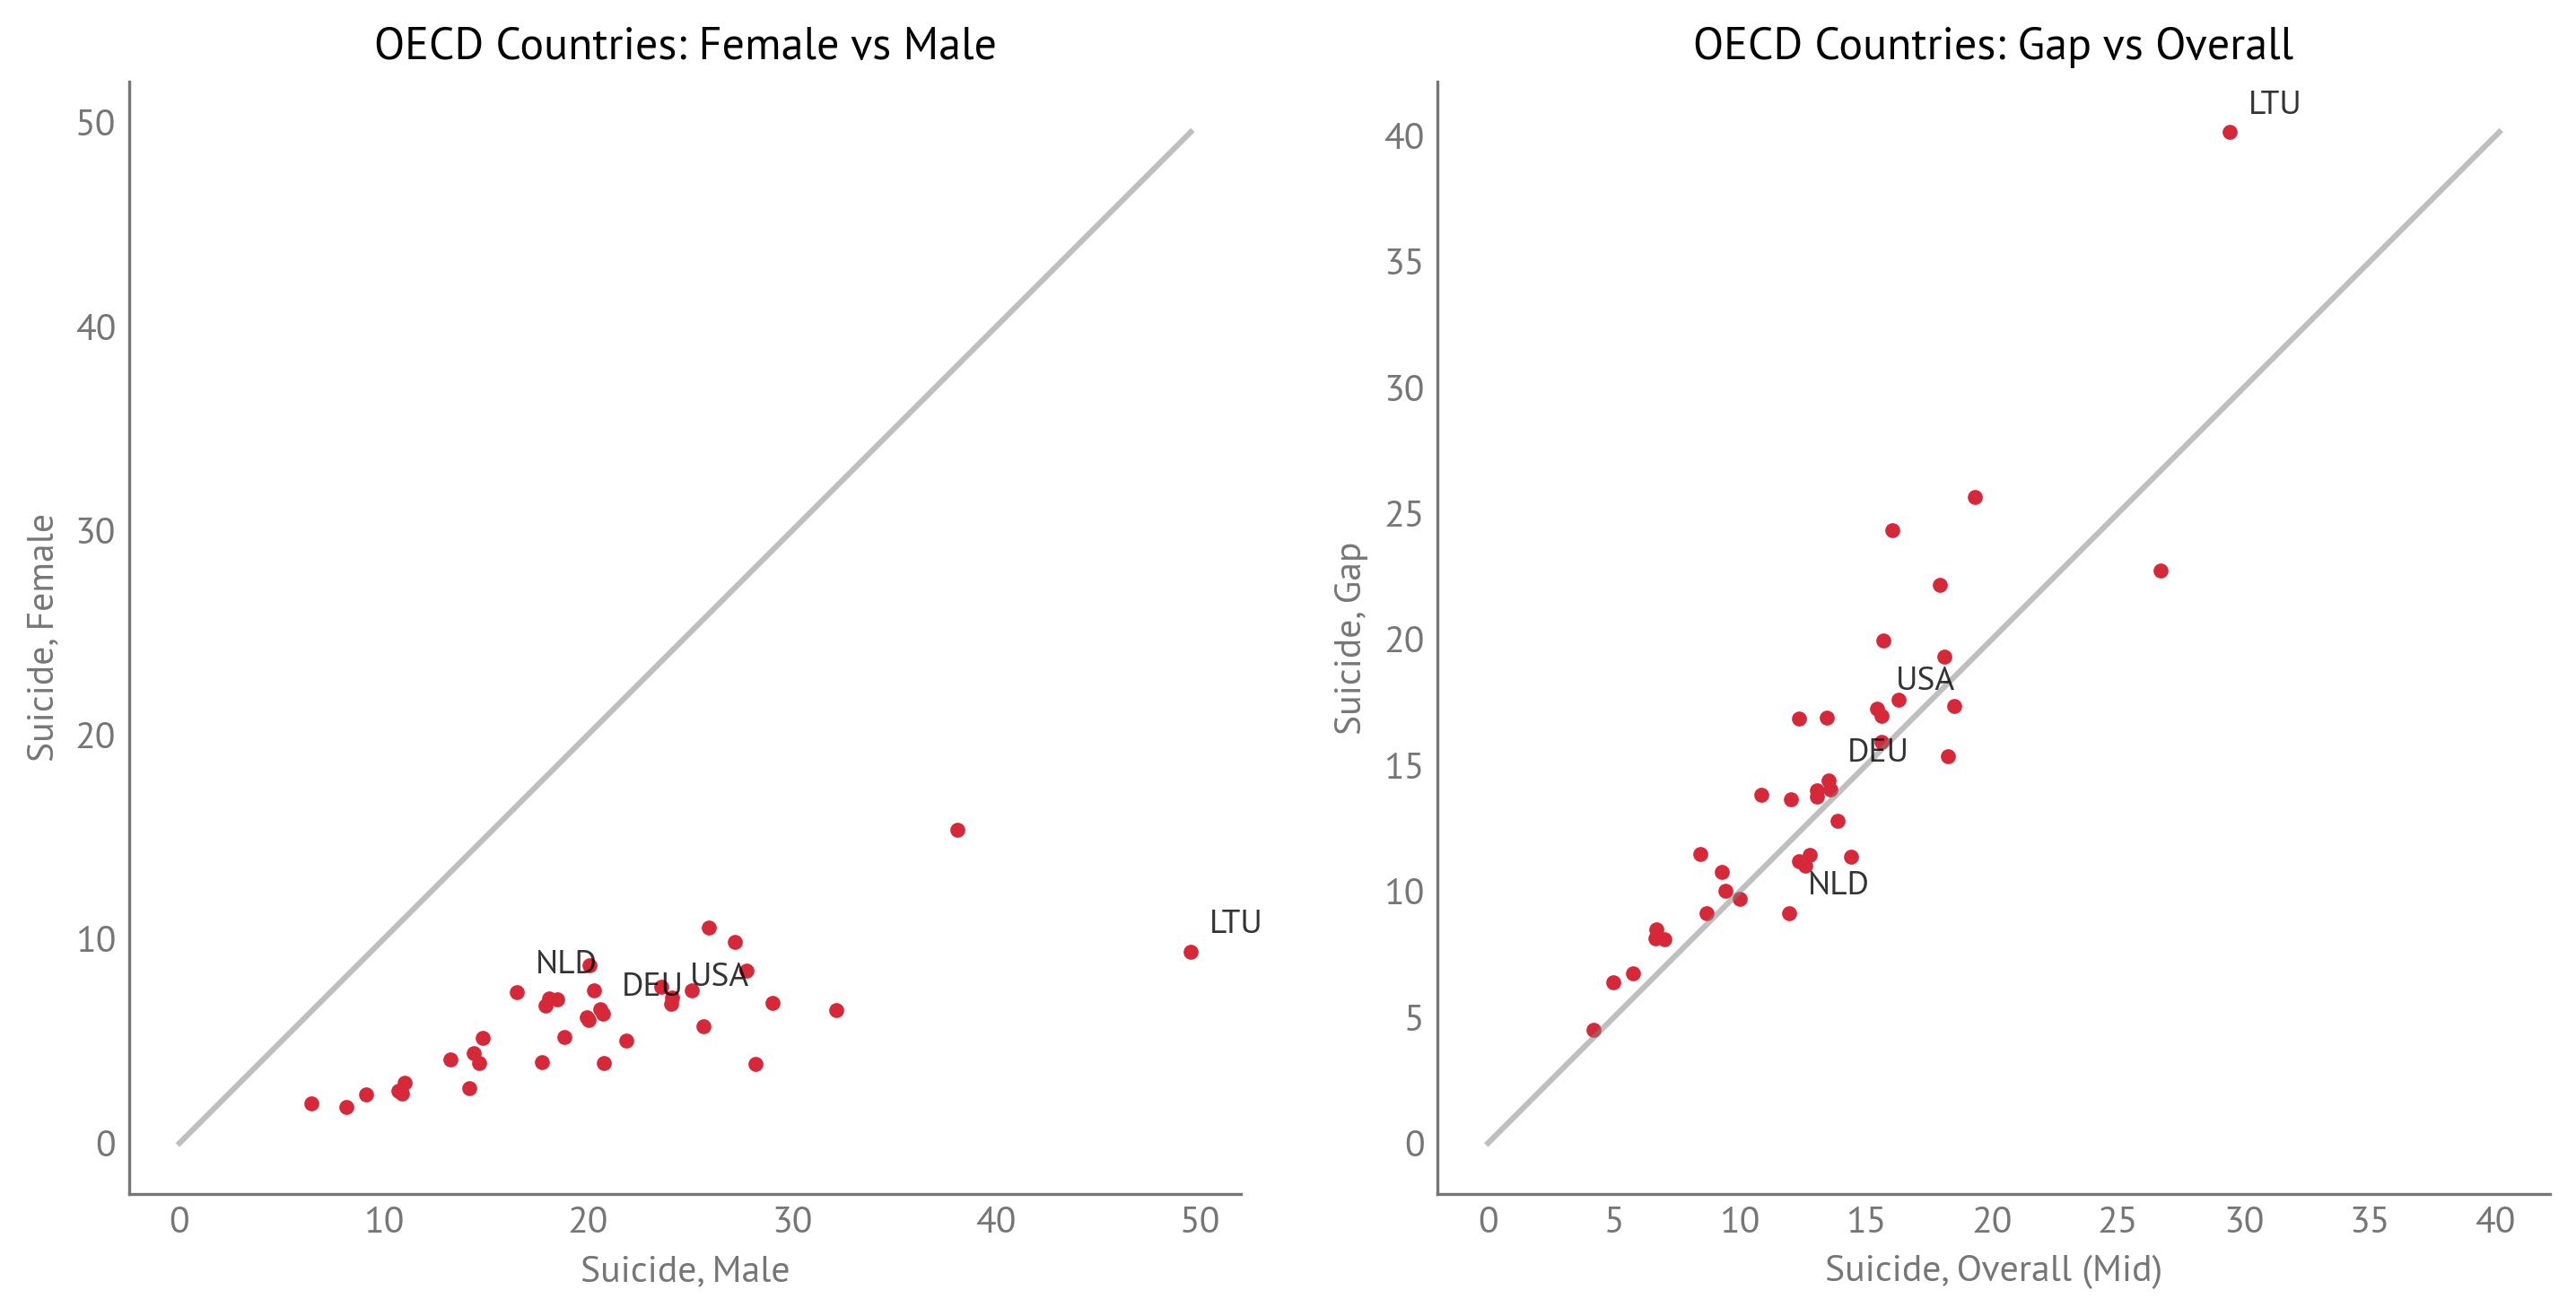
Figure 4:Self-Harm (Suicide): Female vs Male and Gap vs Overall (OECD Countries)
Interpersonal Violence (Homicide)
Interpersonal violence (homicide) death rates (per 100,000 population) - Deaths from interpersonal violence (homicide). Men typically have much higher homicide rates than women in most countries.
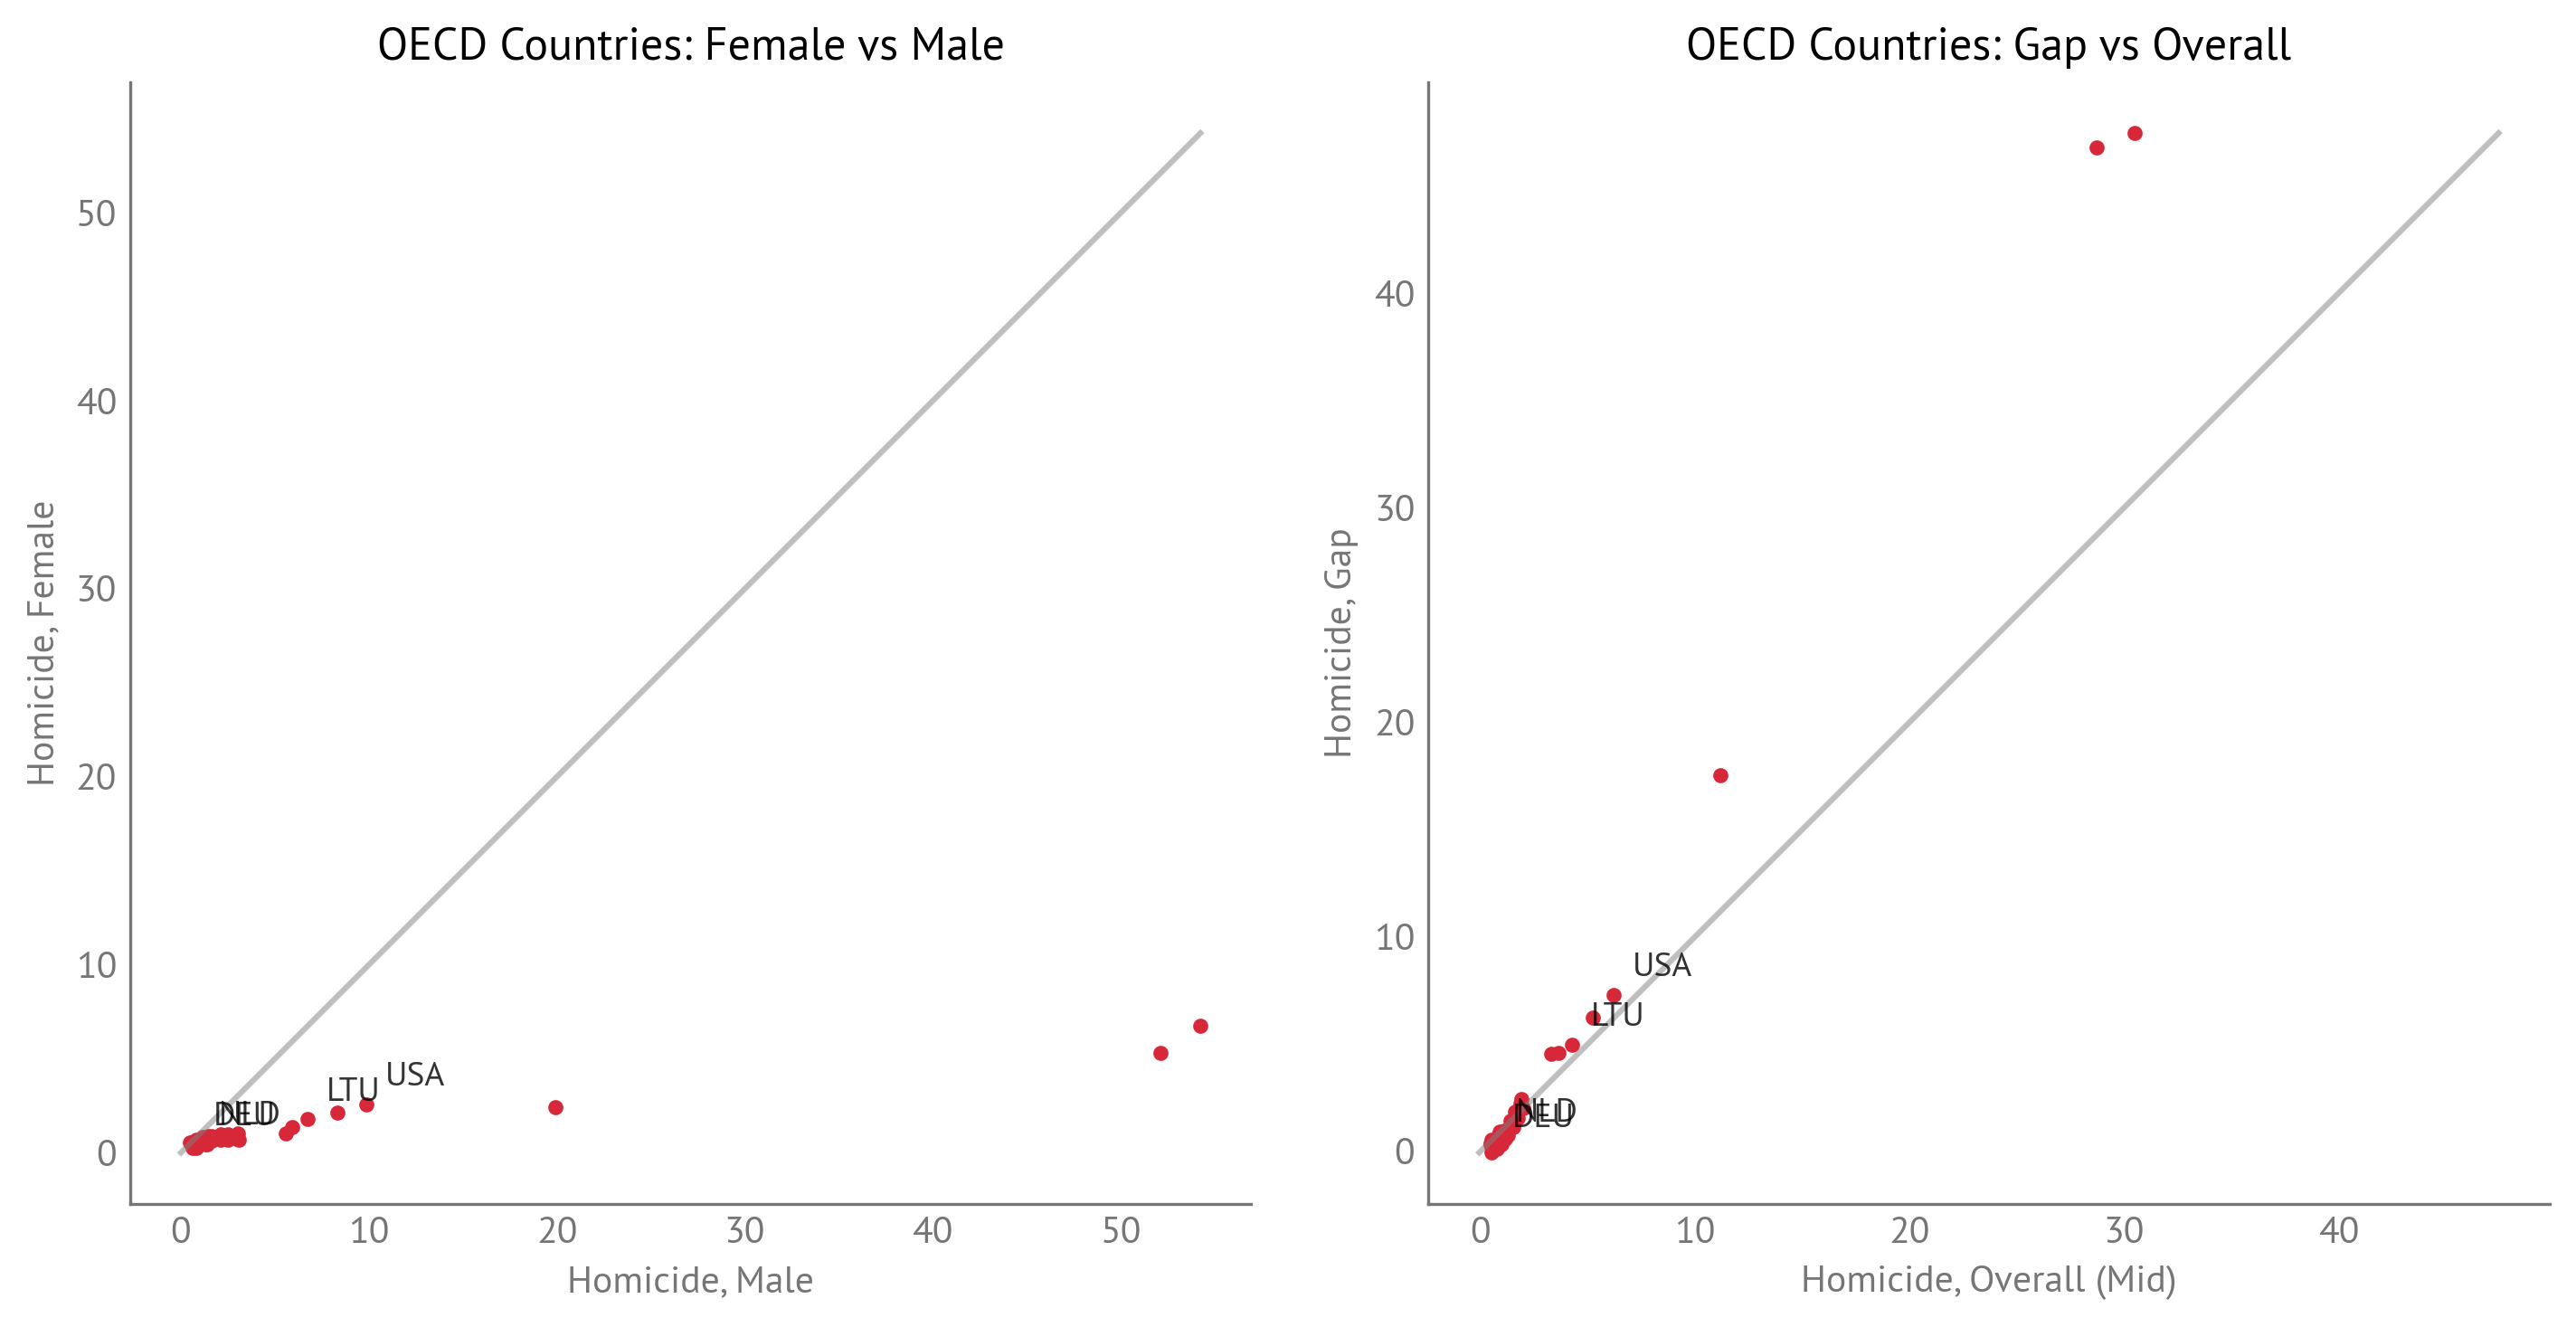
Figure 5:Interpersonal Violence (Homicide): Female vs Male and Gap vs Overall (OECD Countries)
Road Injuries
Road injuries (road traffic crash) death rates (per 100,000 population) - Deaths from road injuries (road traffic crashes). Men typically have 2-4 times higher road traffic death rates than women due to higher exposure to driving and occupational hazards.
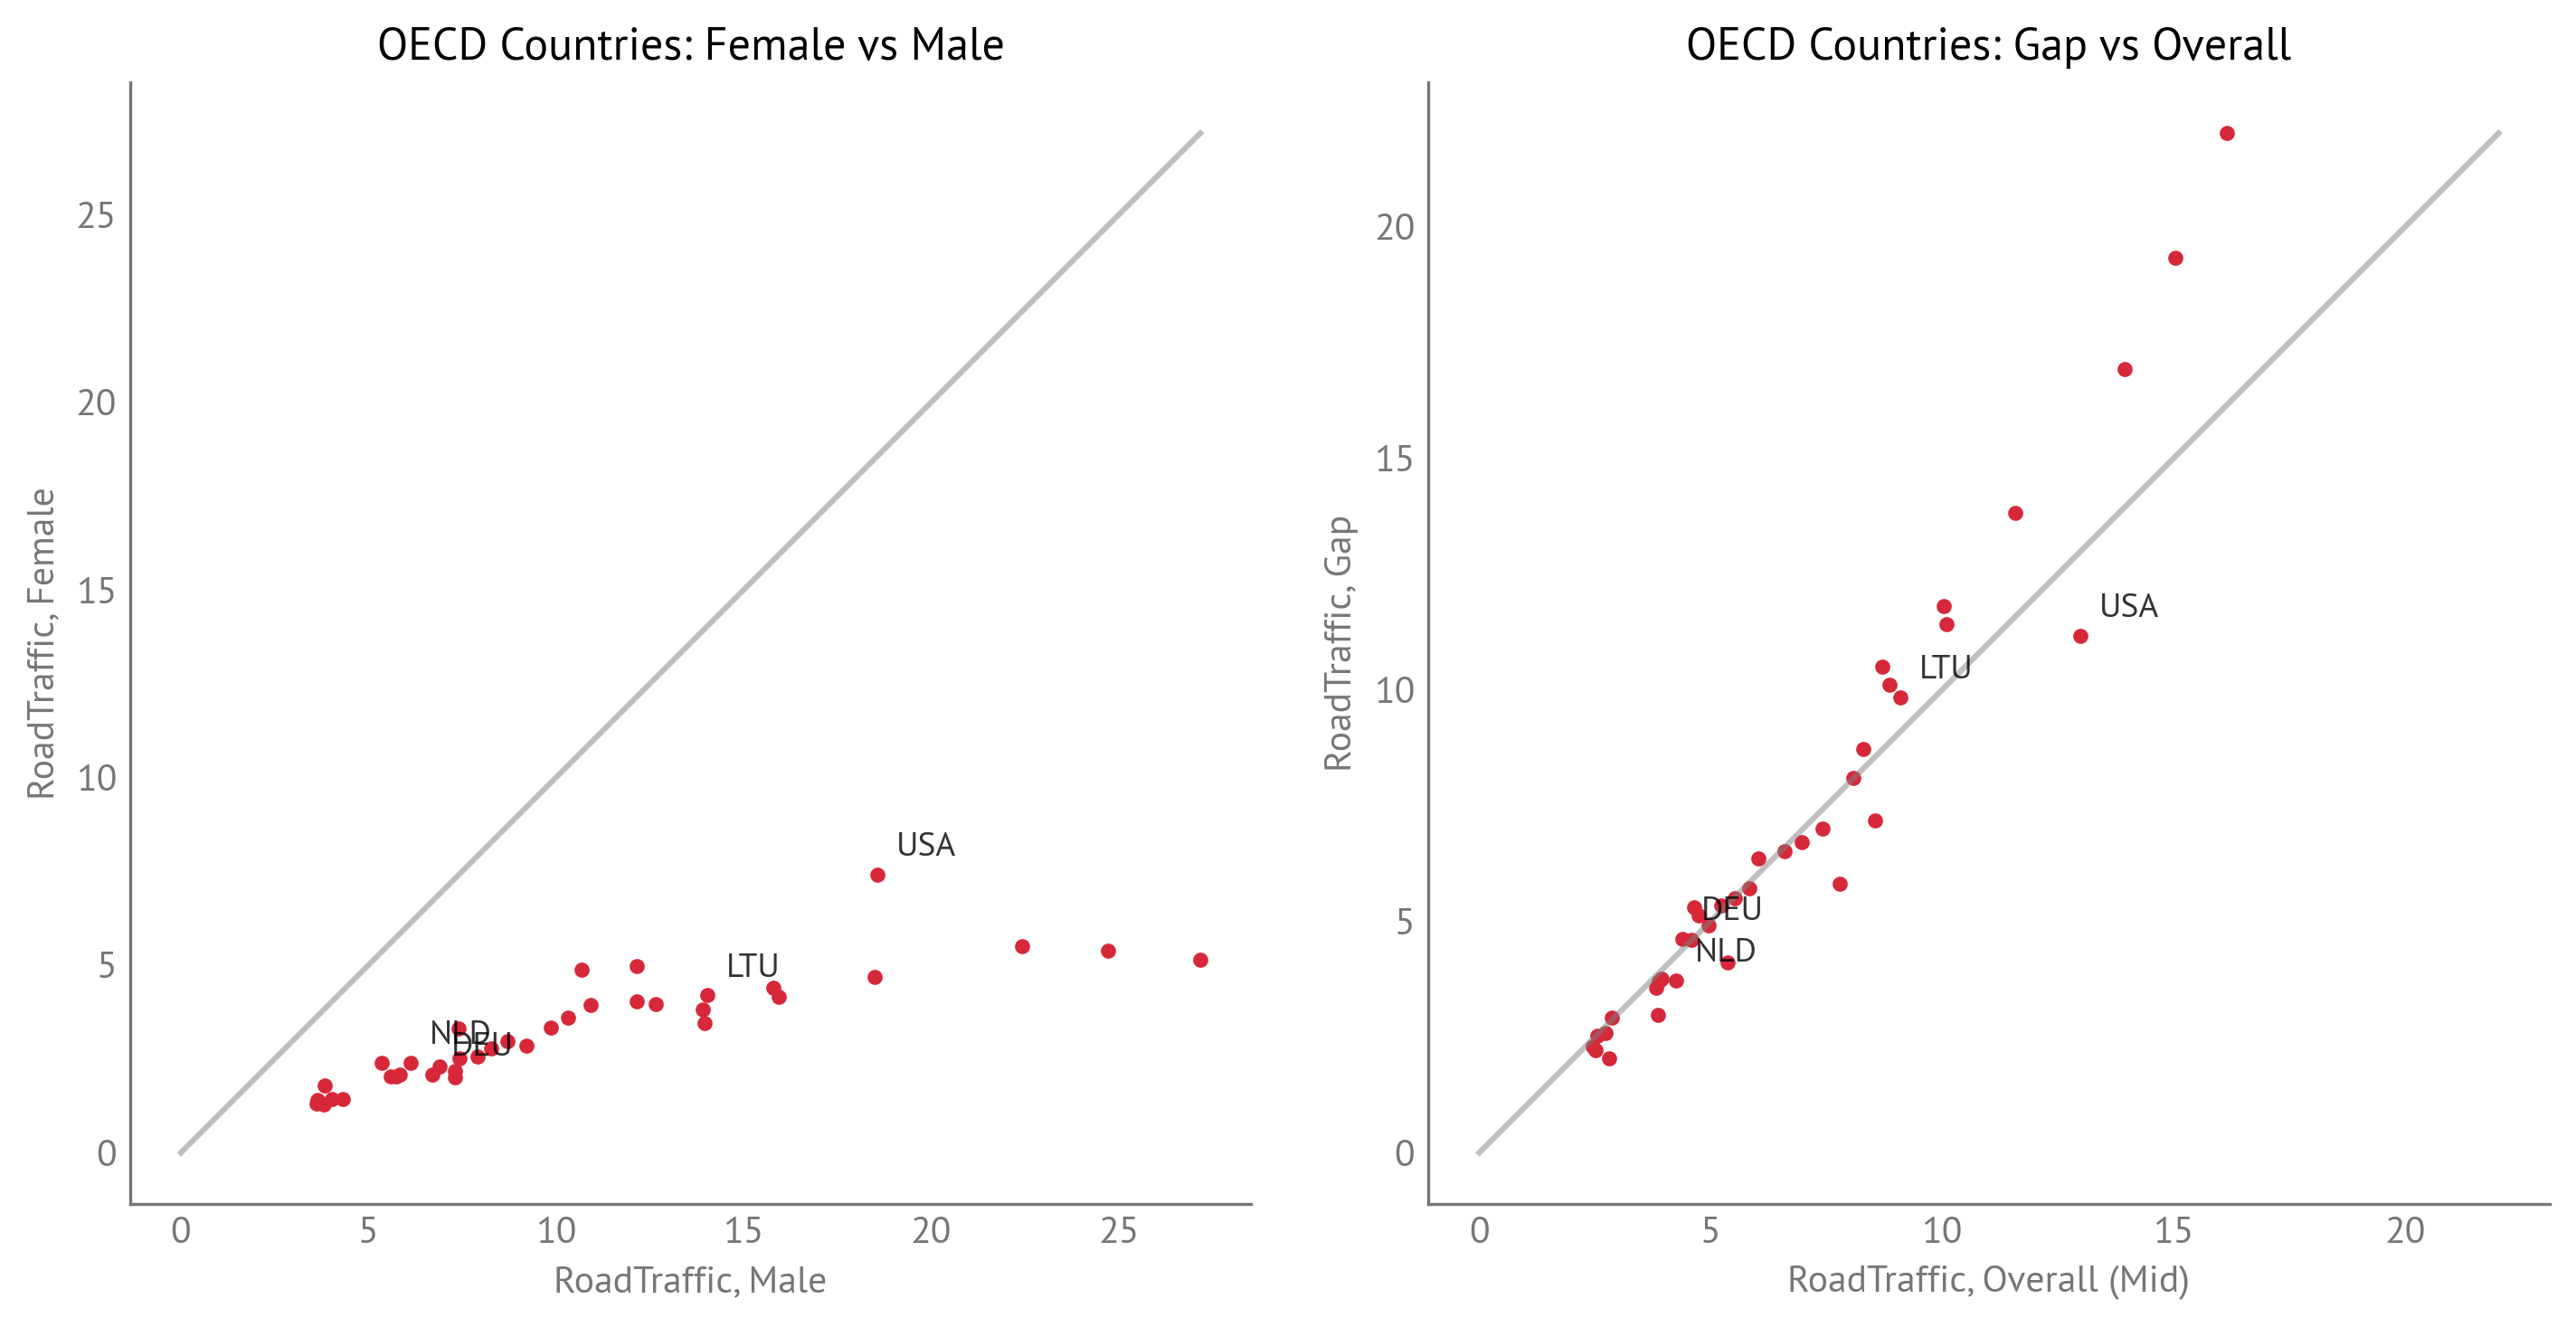
Figure 6:Road Injuries: Female vs Male and Gap vs Overall (OECD Countries)
Cardiovascular Disease
Cardiovascular diseases death rates (per 100,000 population) - Deaths from cardiovascular diseases. Men typically have higher rates of cardiovascular disease and heart attacks.
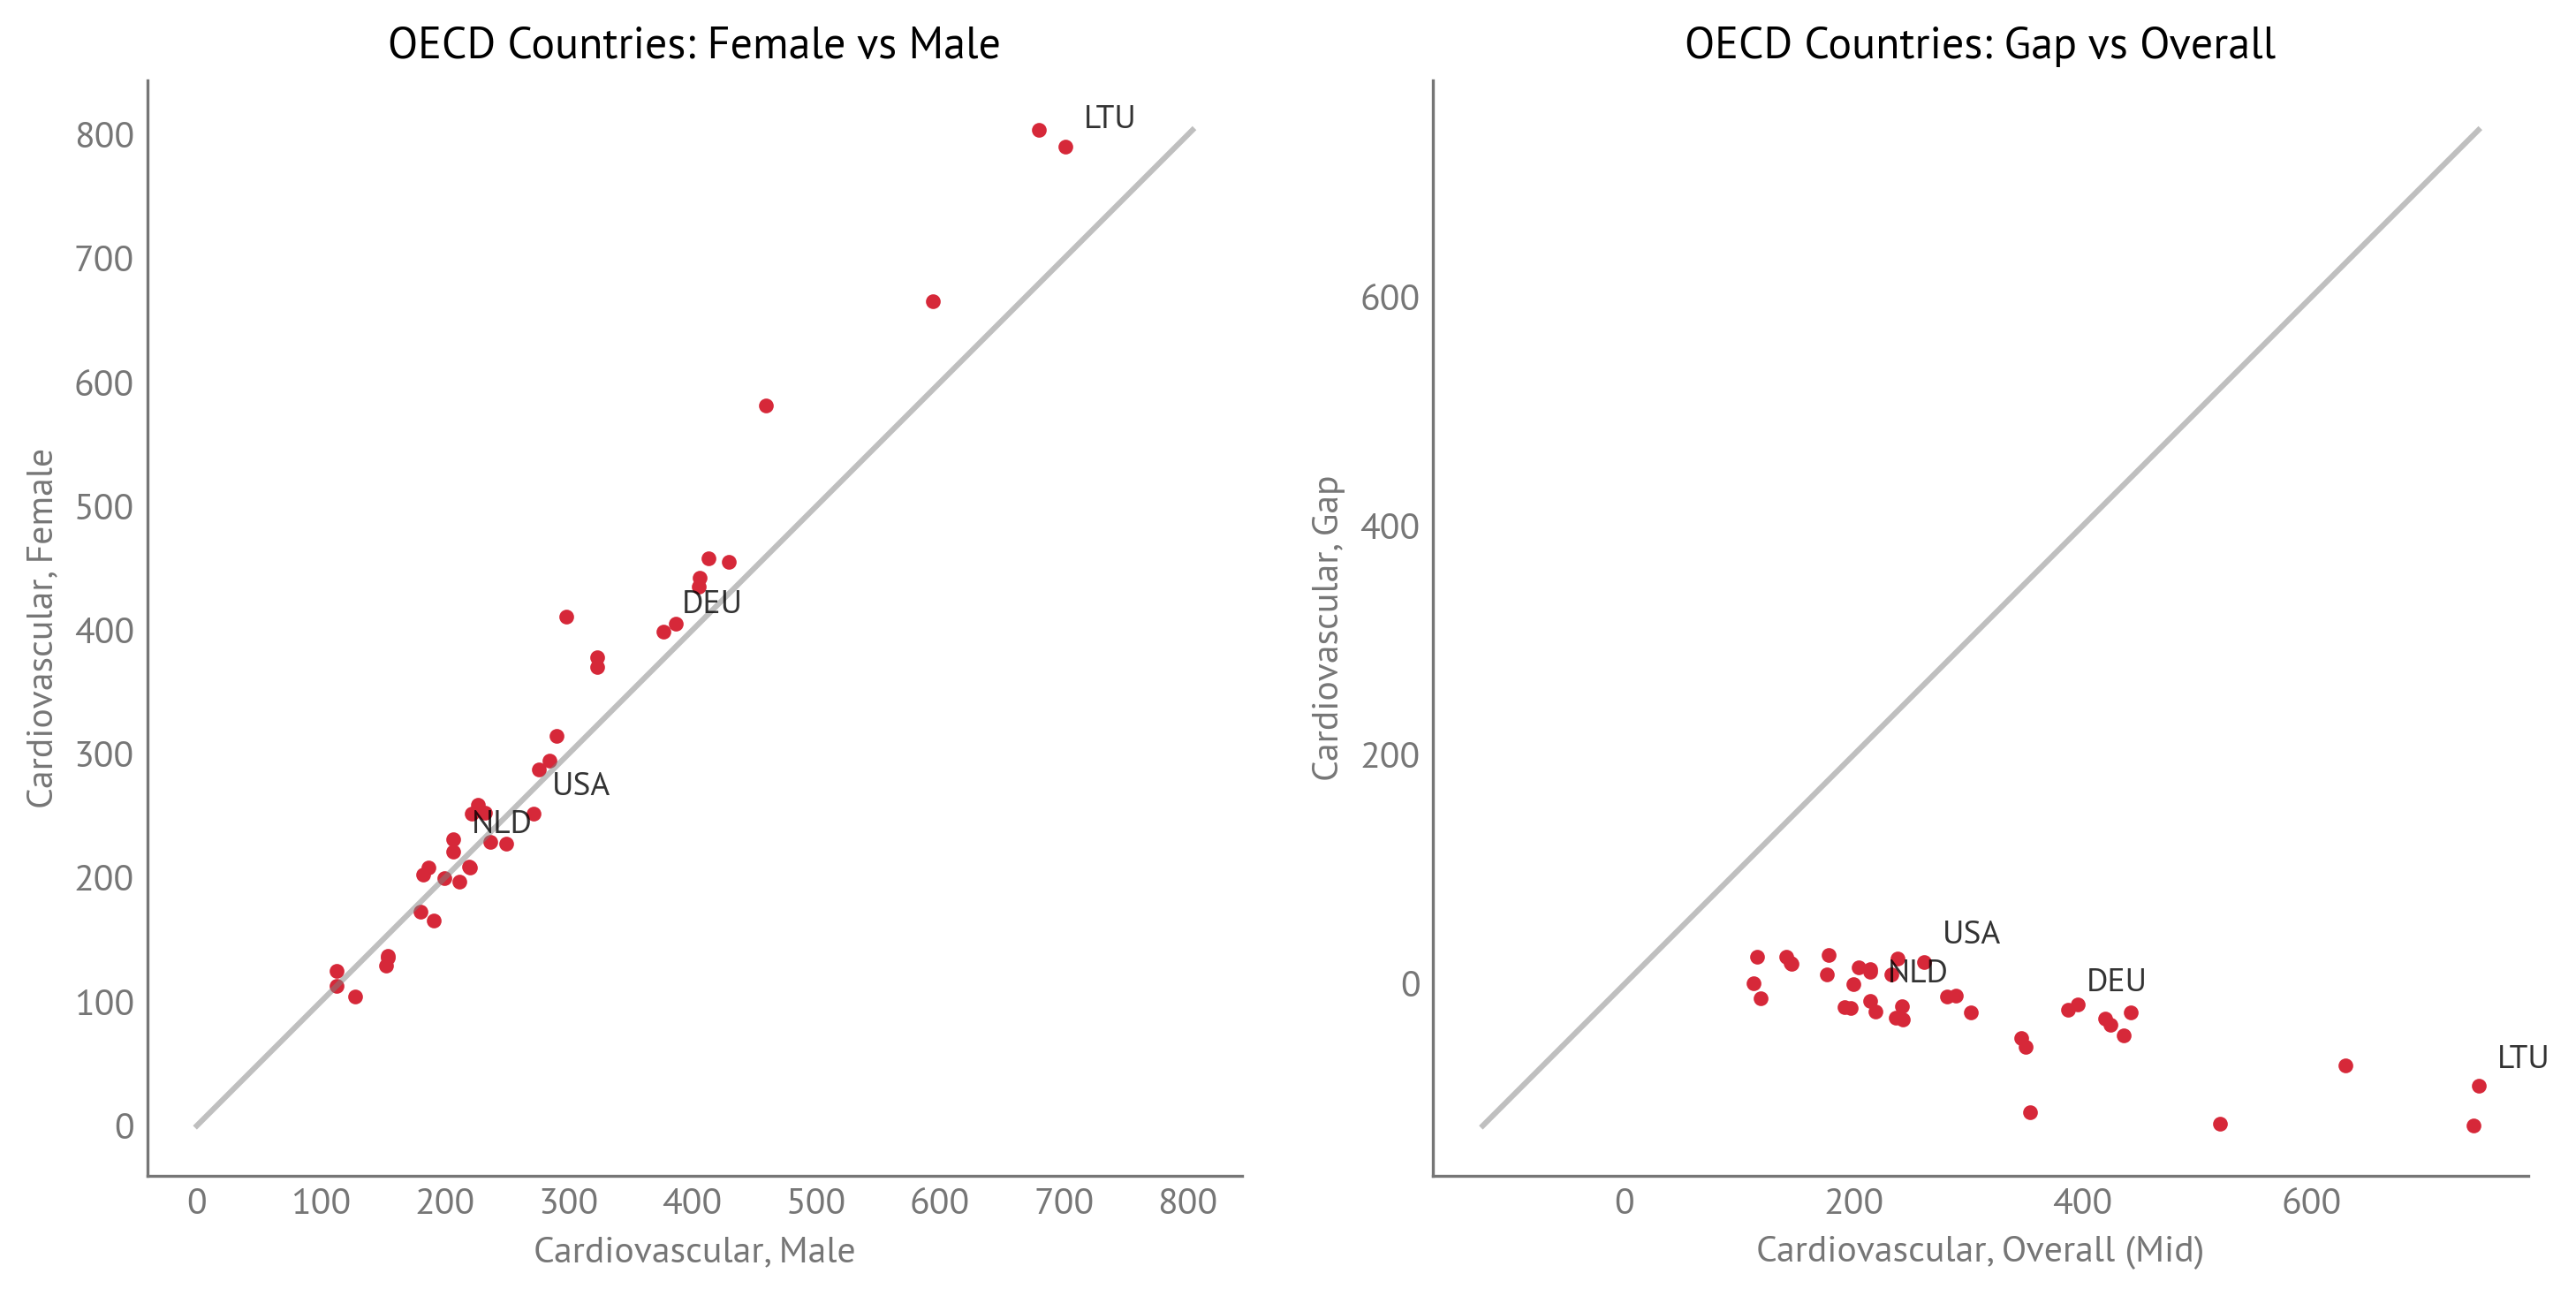
Figure 7:Cardiovascular Disease: Female vs Male and Gap vs Overall (OECD Countries)
Diabetes
Diabetes mellitus type 2 death rates (per 100,000 population) - Deaths from diabetes mellitus type 2. Diabetes is a chronic condition that can contribute to the gender gap in mortality.
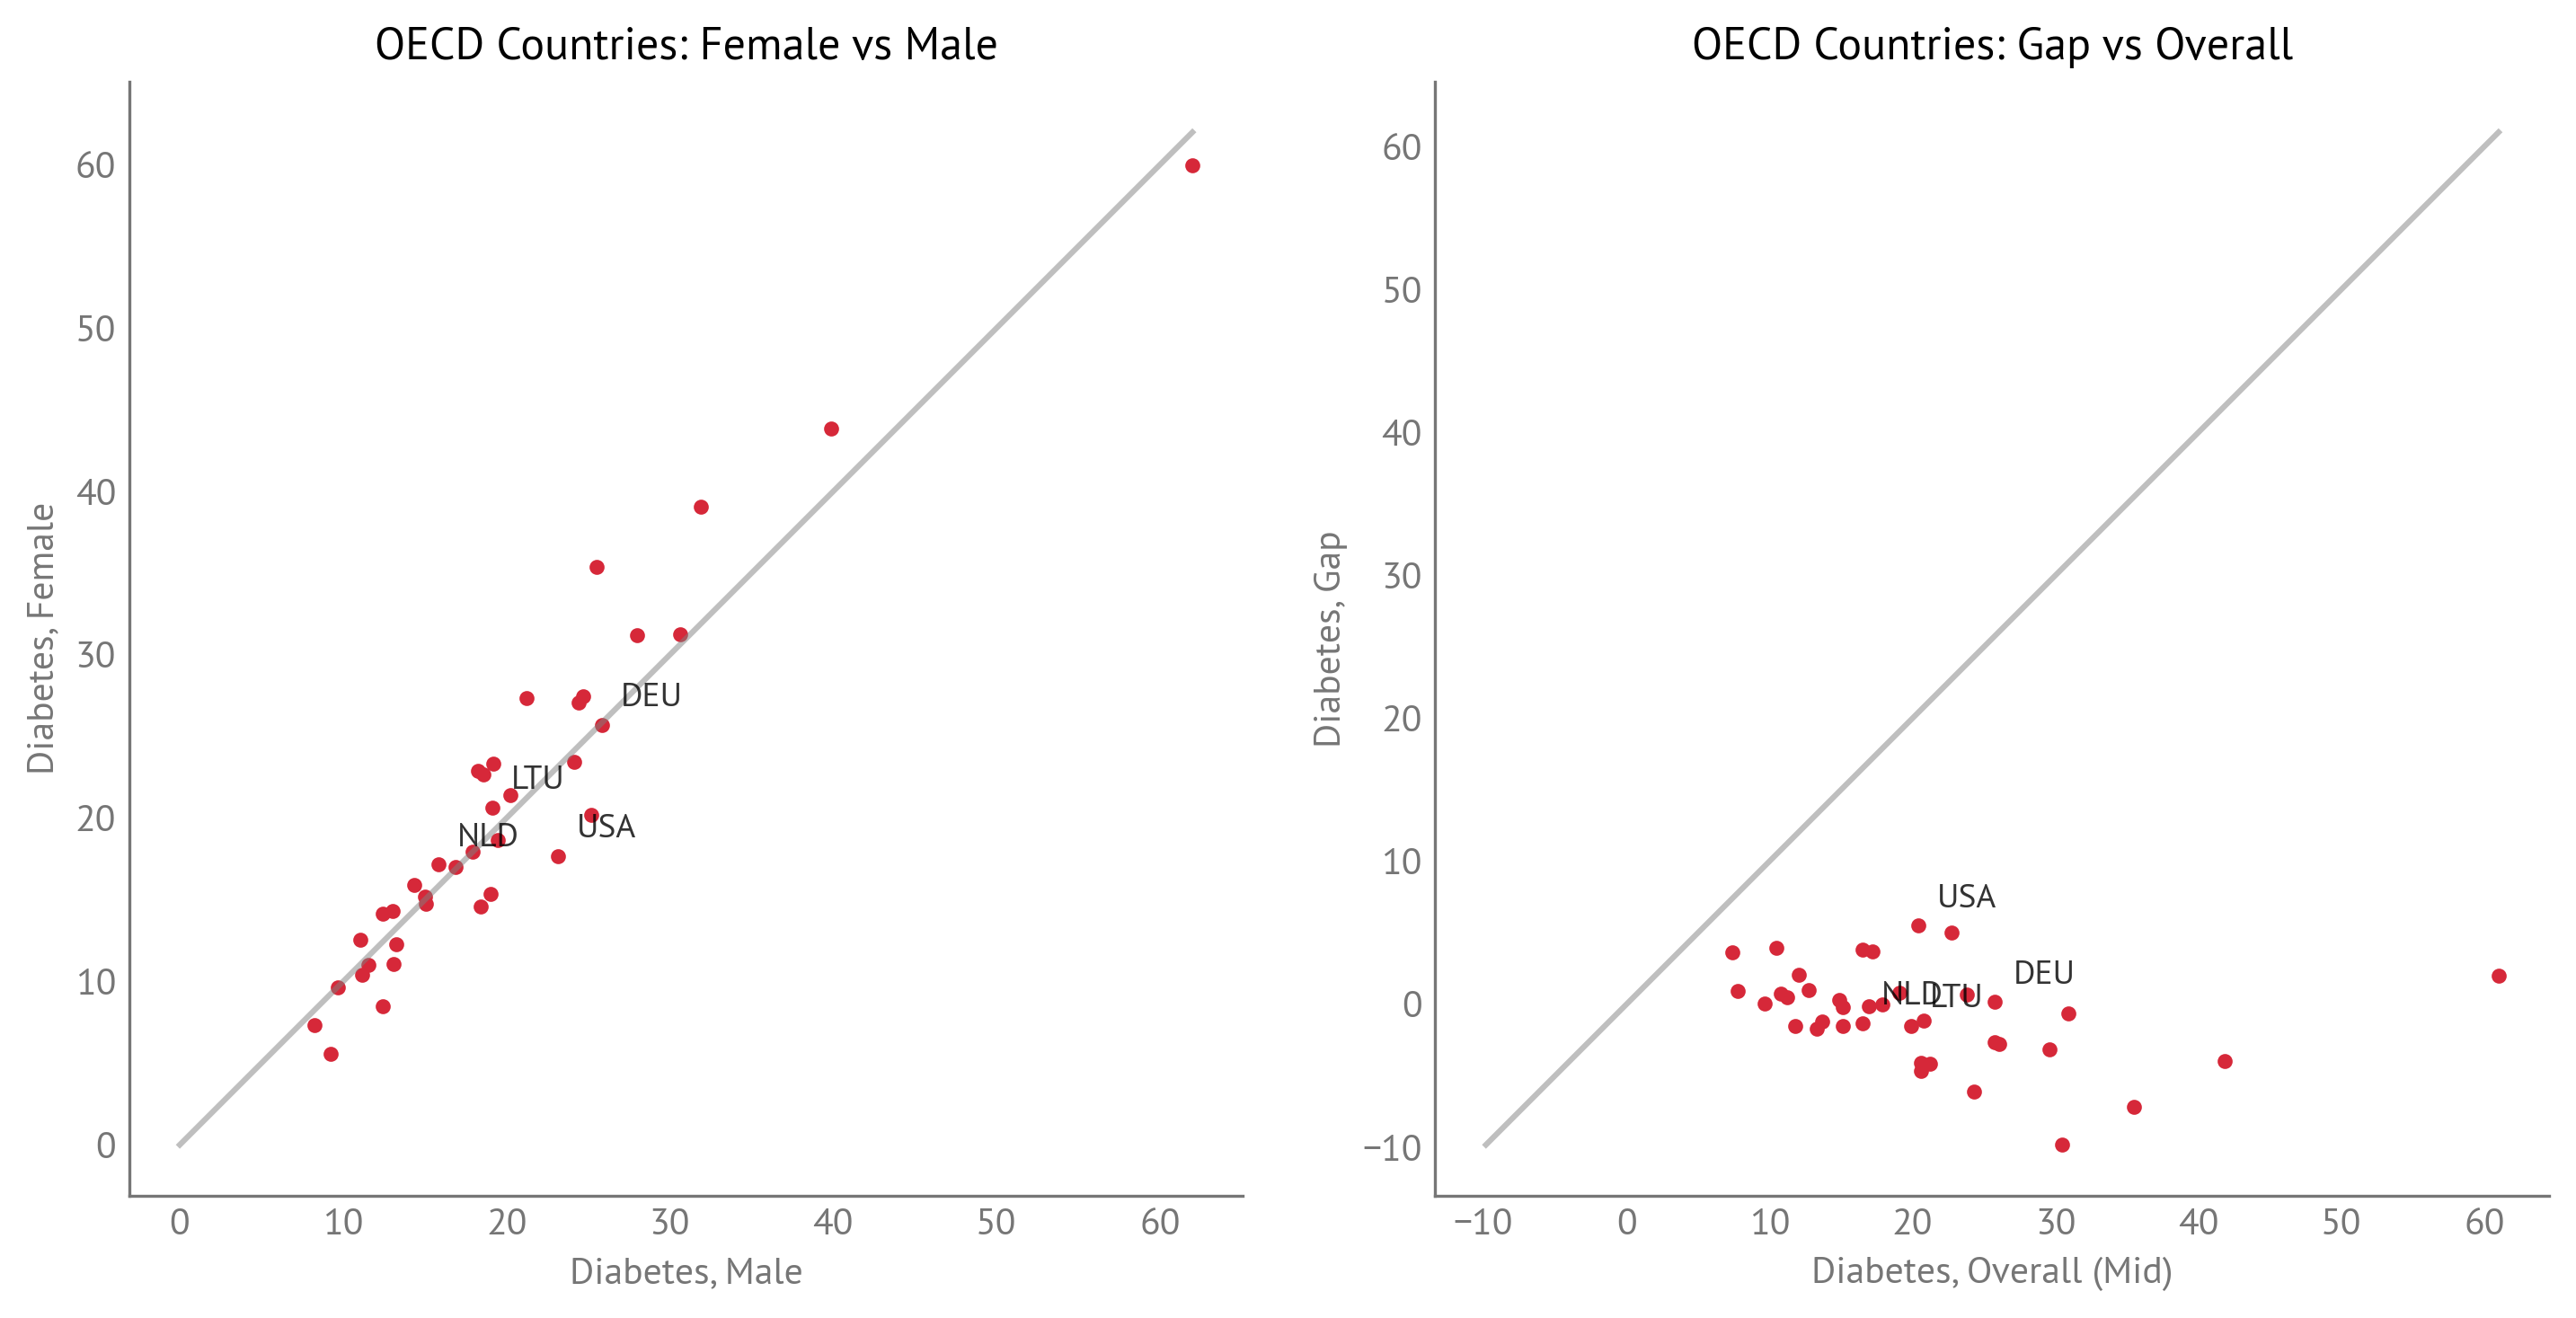
Figure 8:Diabetes: Female vs Male and Gap vs Overall (OECD Countries)
Neoplasms (Cancer)
Neoplasms (cancer) death rates (per 100,000 population) - Deaths from neoplasms (cancer). Different types of cancer have different gender patterns (e.g., lung cancer is often higher in men, breast cancer is female-specific).
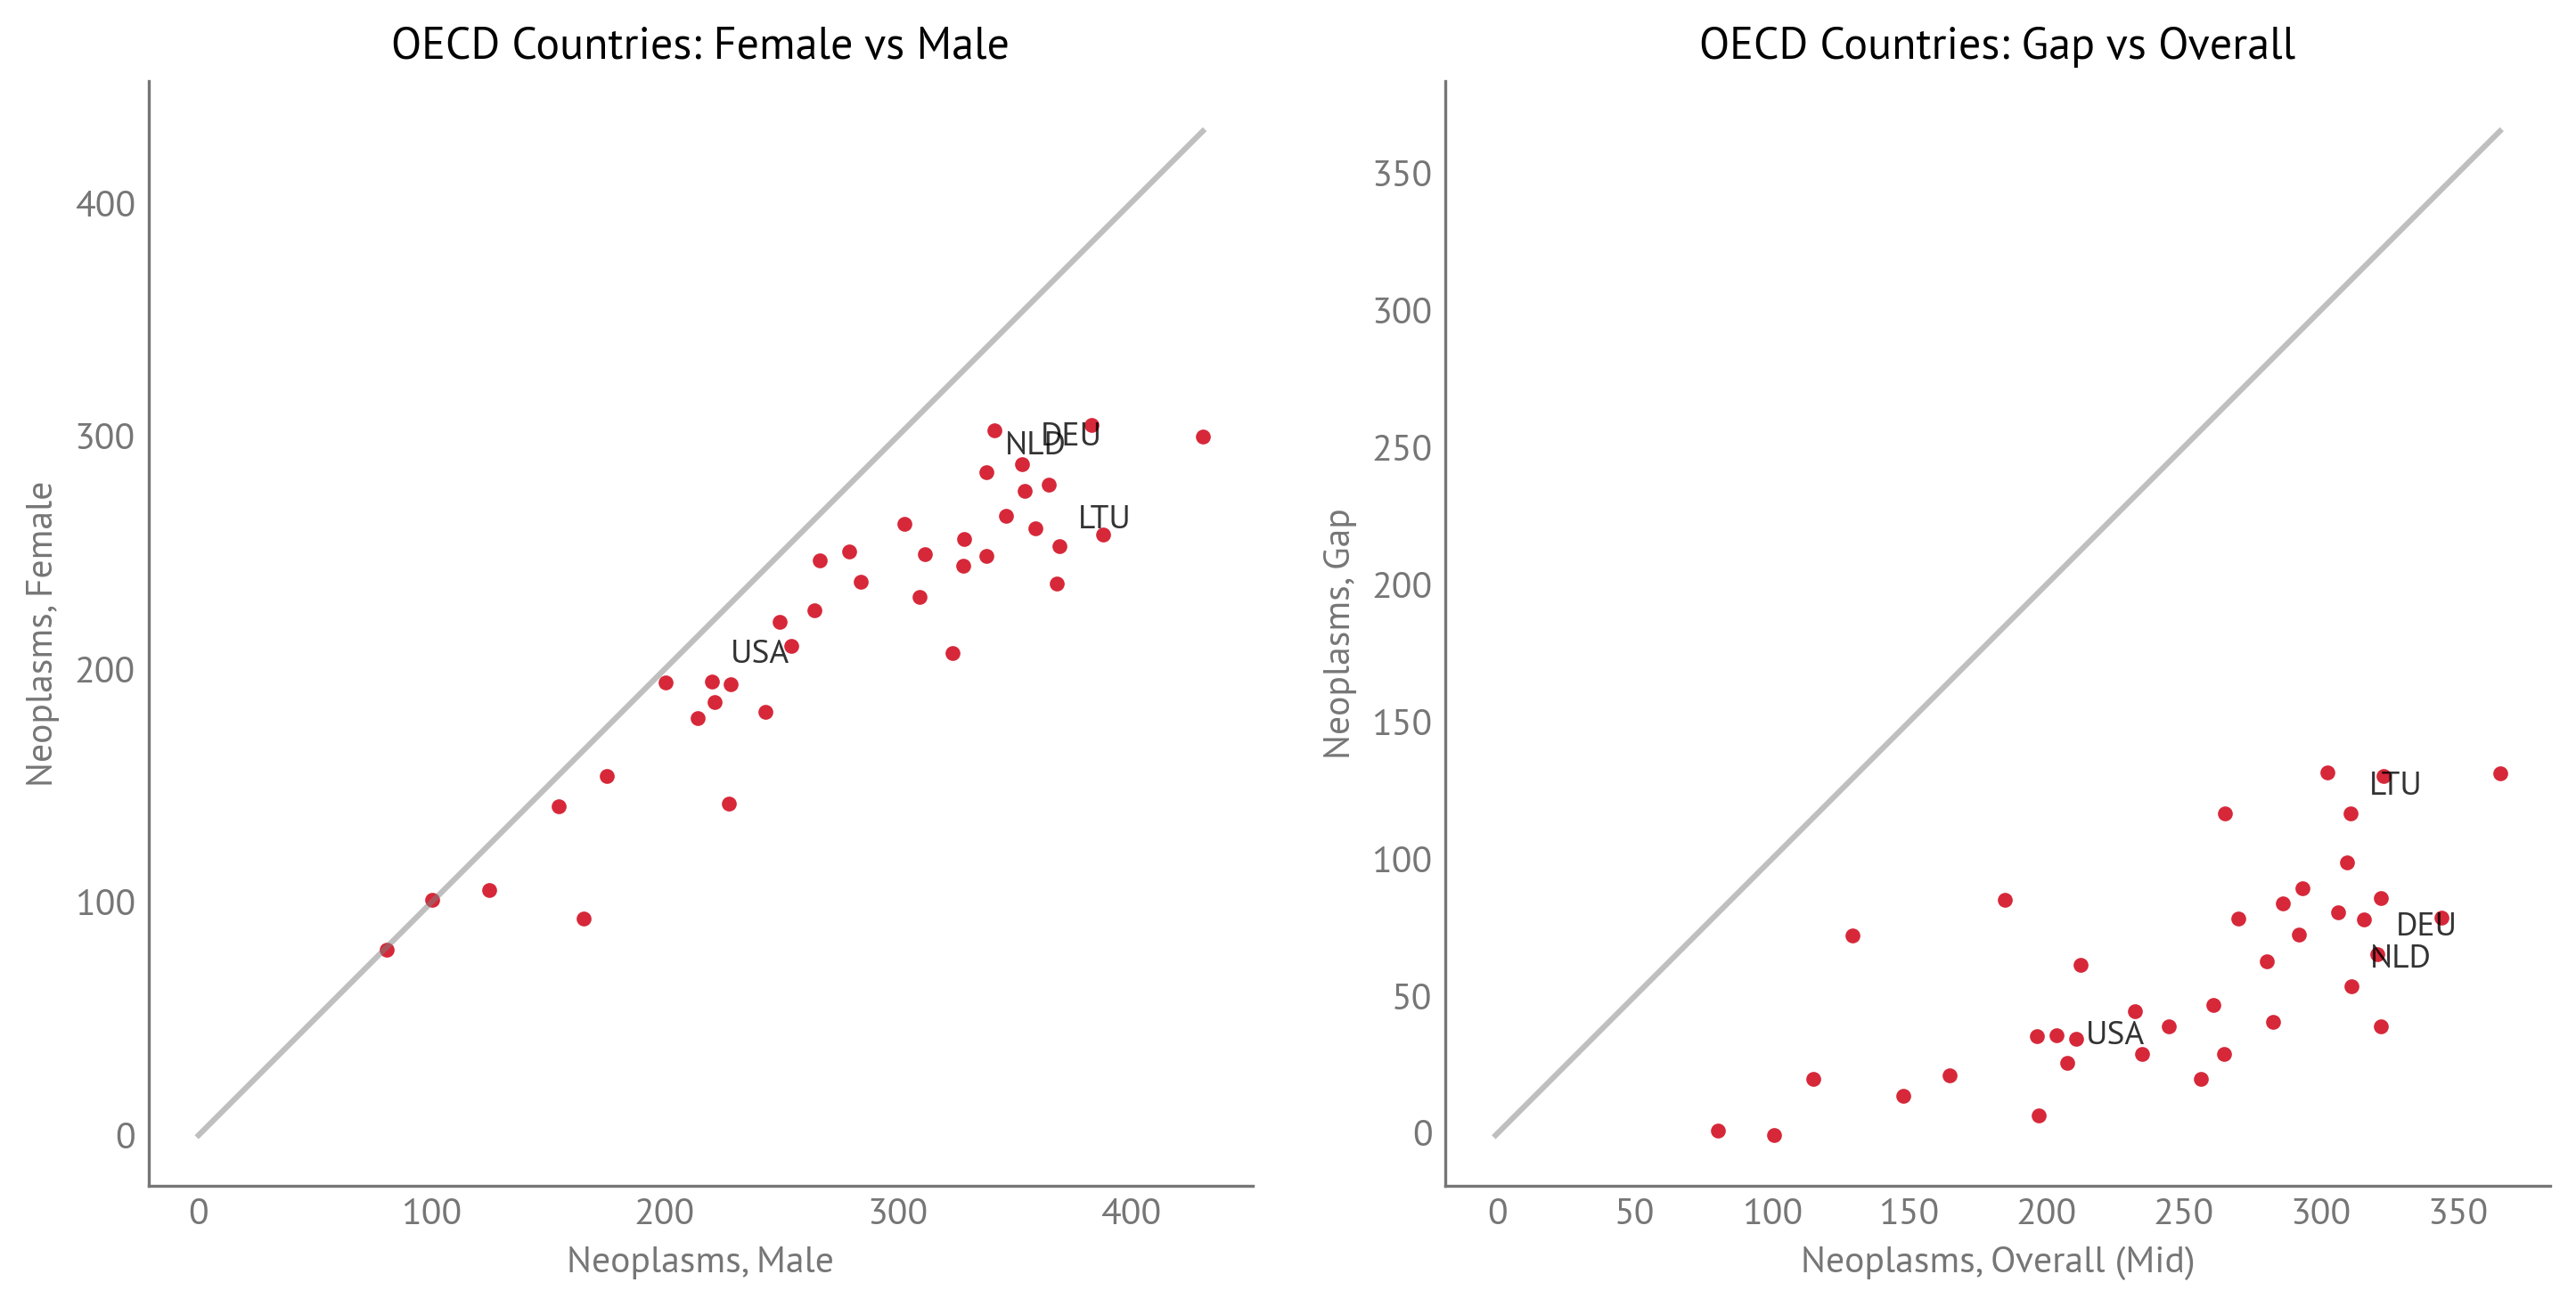
Figure 9:Neoplasms (Cancer): Female vs Male and Gap vs Overall (OECD Countries)
Chronic Respiratory Disease
Chronic respiratory diseases death rates (per 100,000 population) - Deaths from chronic respiratory diseases (including COPD, asthma, and other chronic lung conditions). These diseases often have gender differences due to factors such as smoking patterns and occupational exposures.
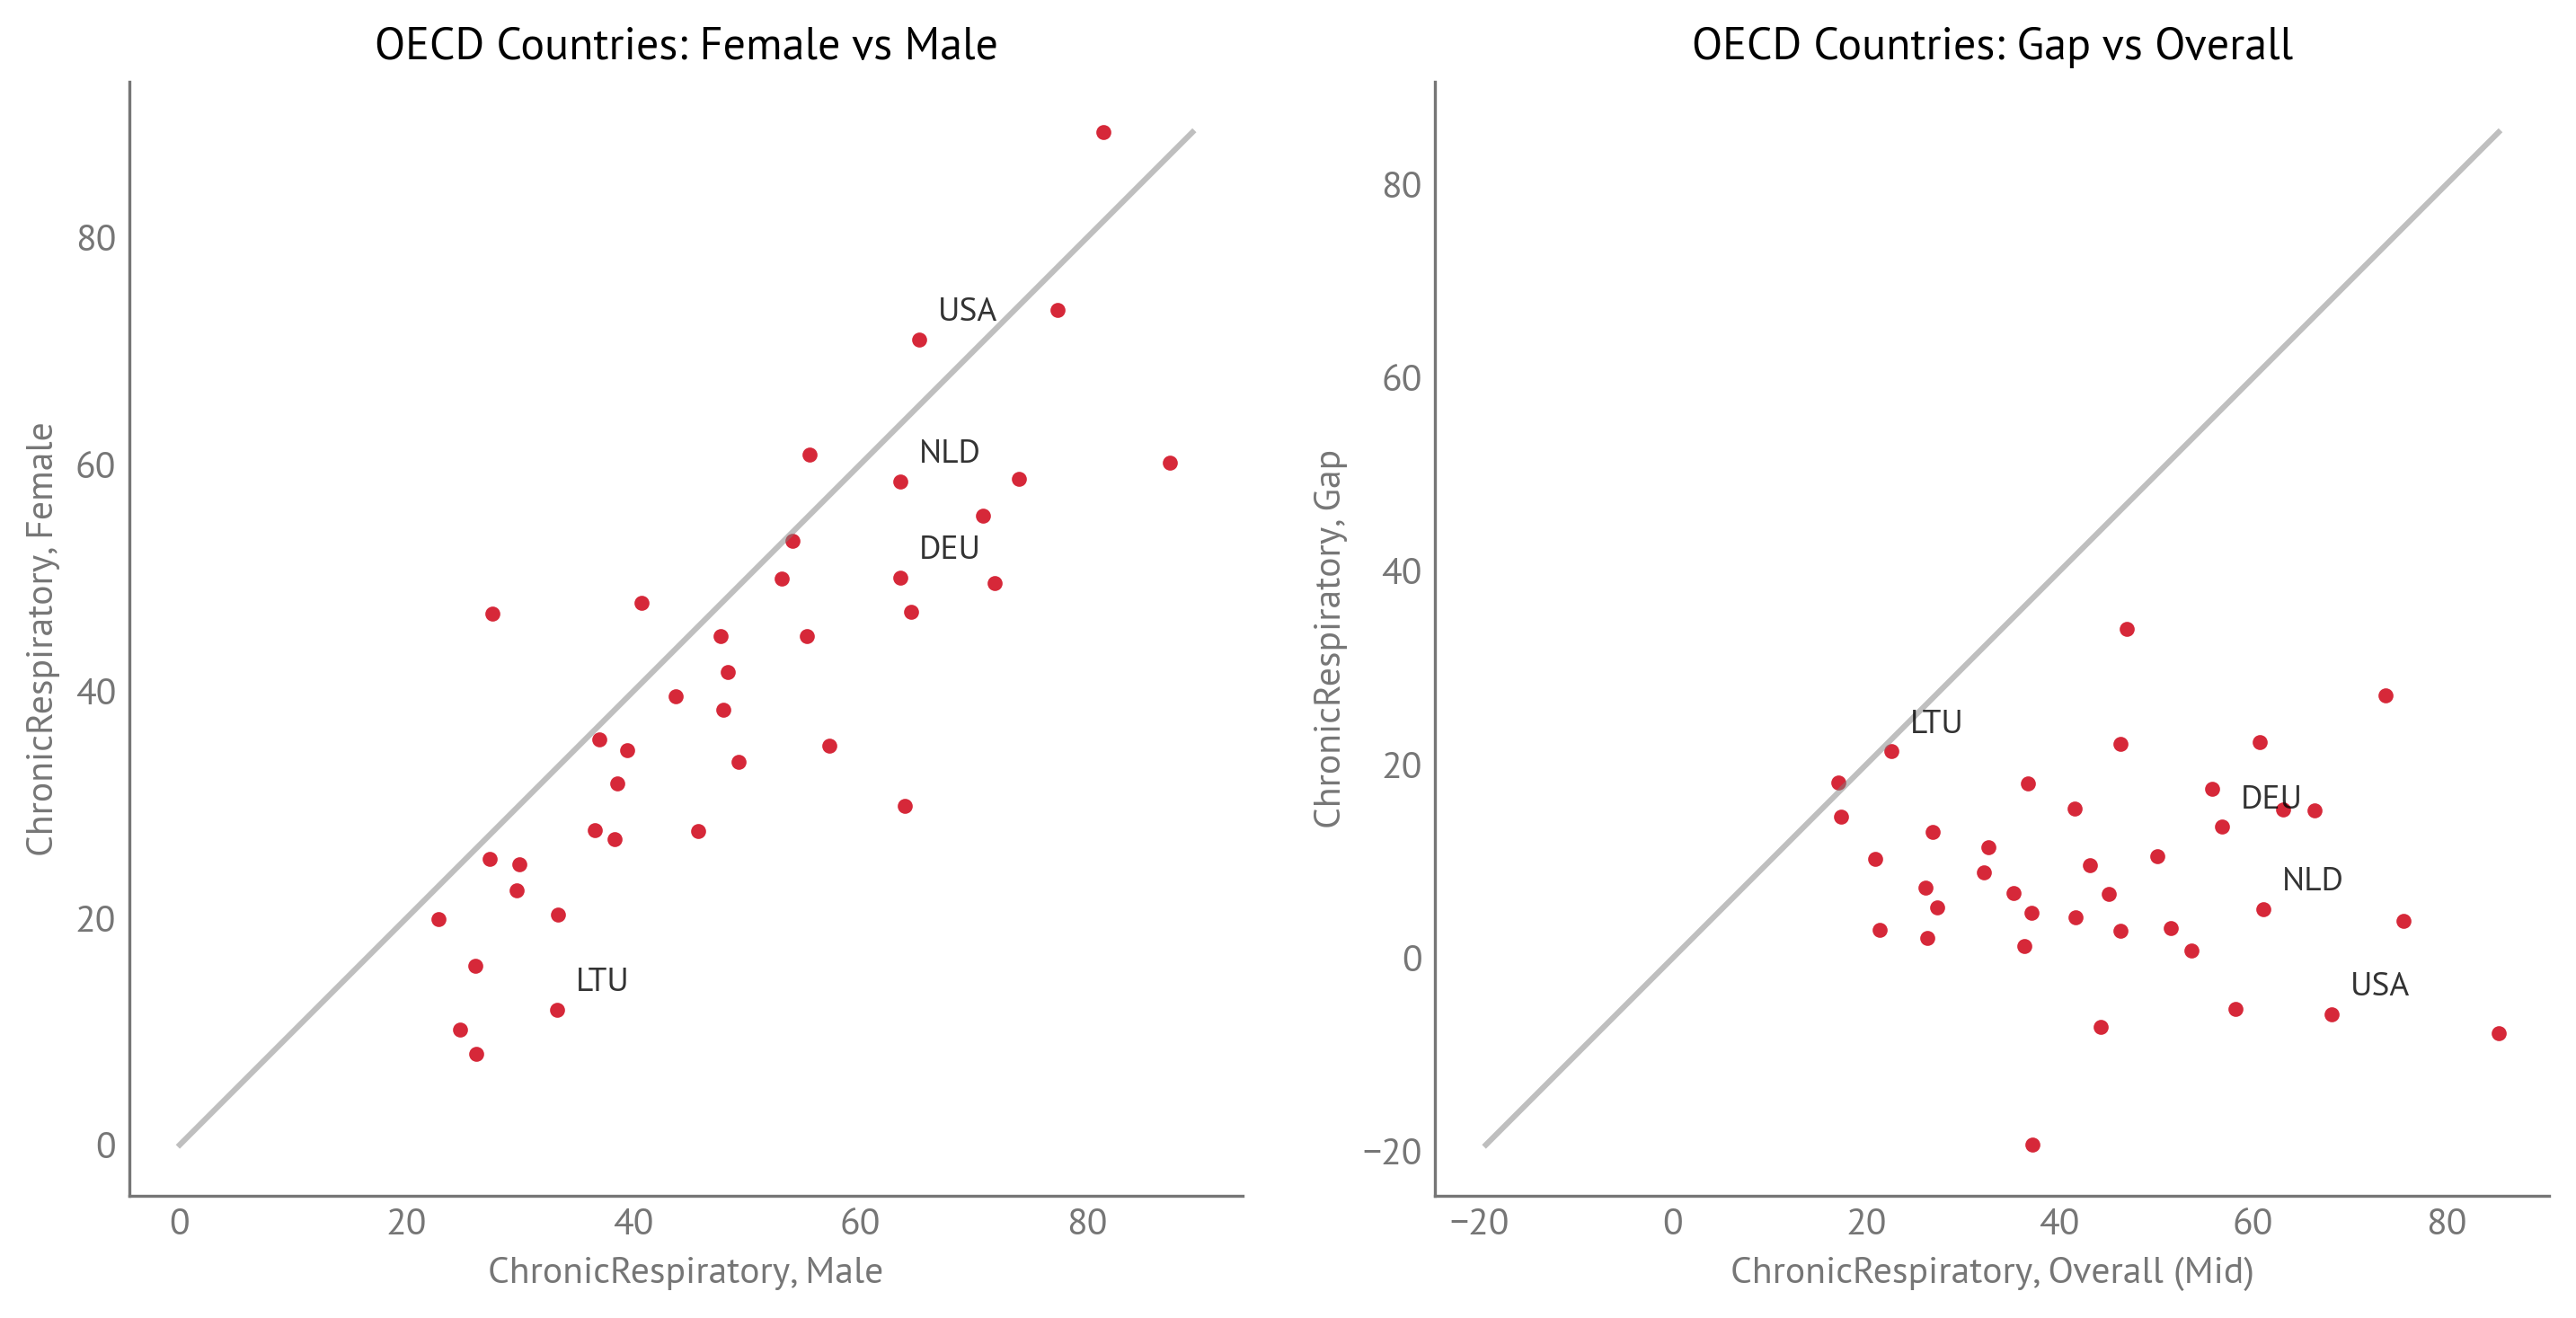
Figure 10:Chronic Respiratory Disease: Female vs Male and Gap vs Overall (OECD Countries)
Liver Disease
Liver disease death rates (per 100,000 population) - Deaths from cirrhosis and other chronic liver diseases. Men typically have higher rates of liver disease mortality than women, often due to higher alcohol consumption and hepatitis infections.
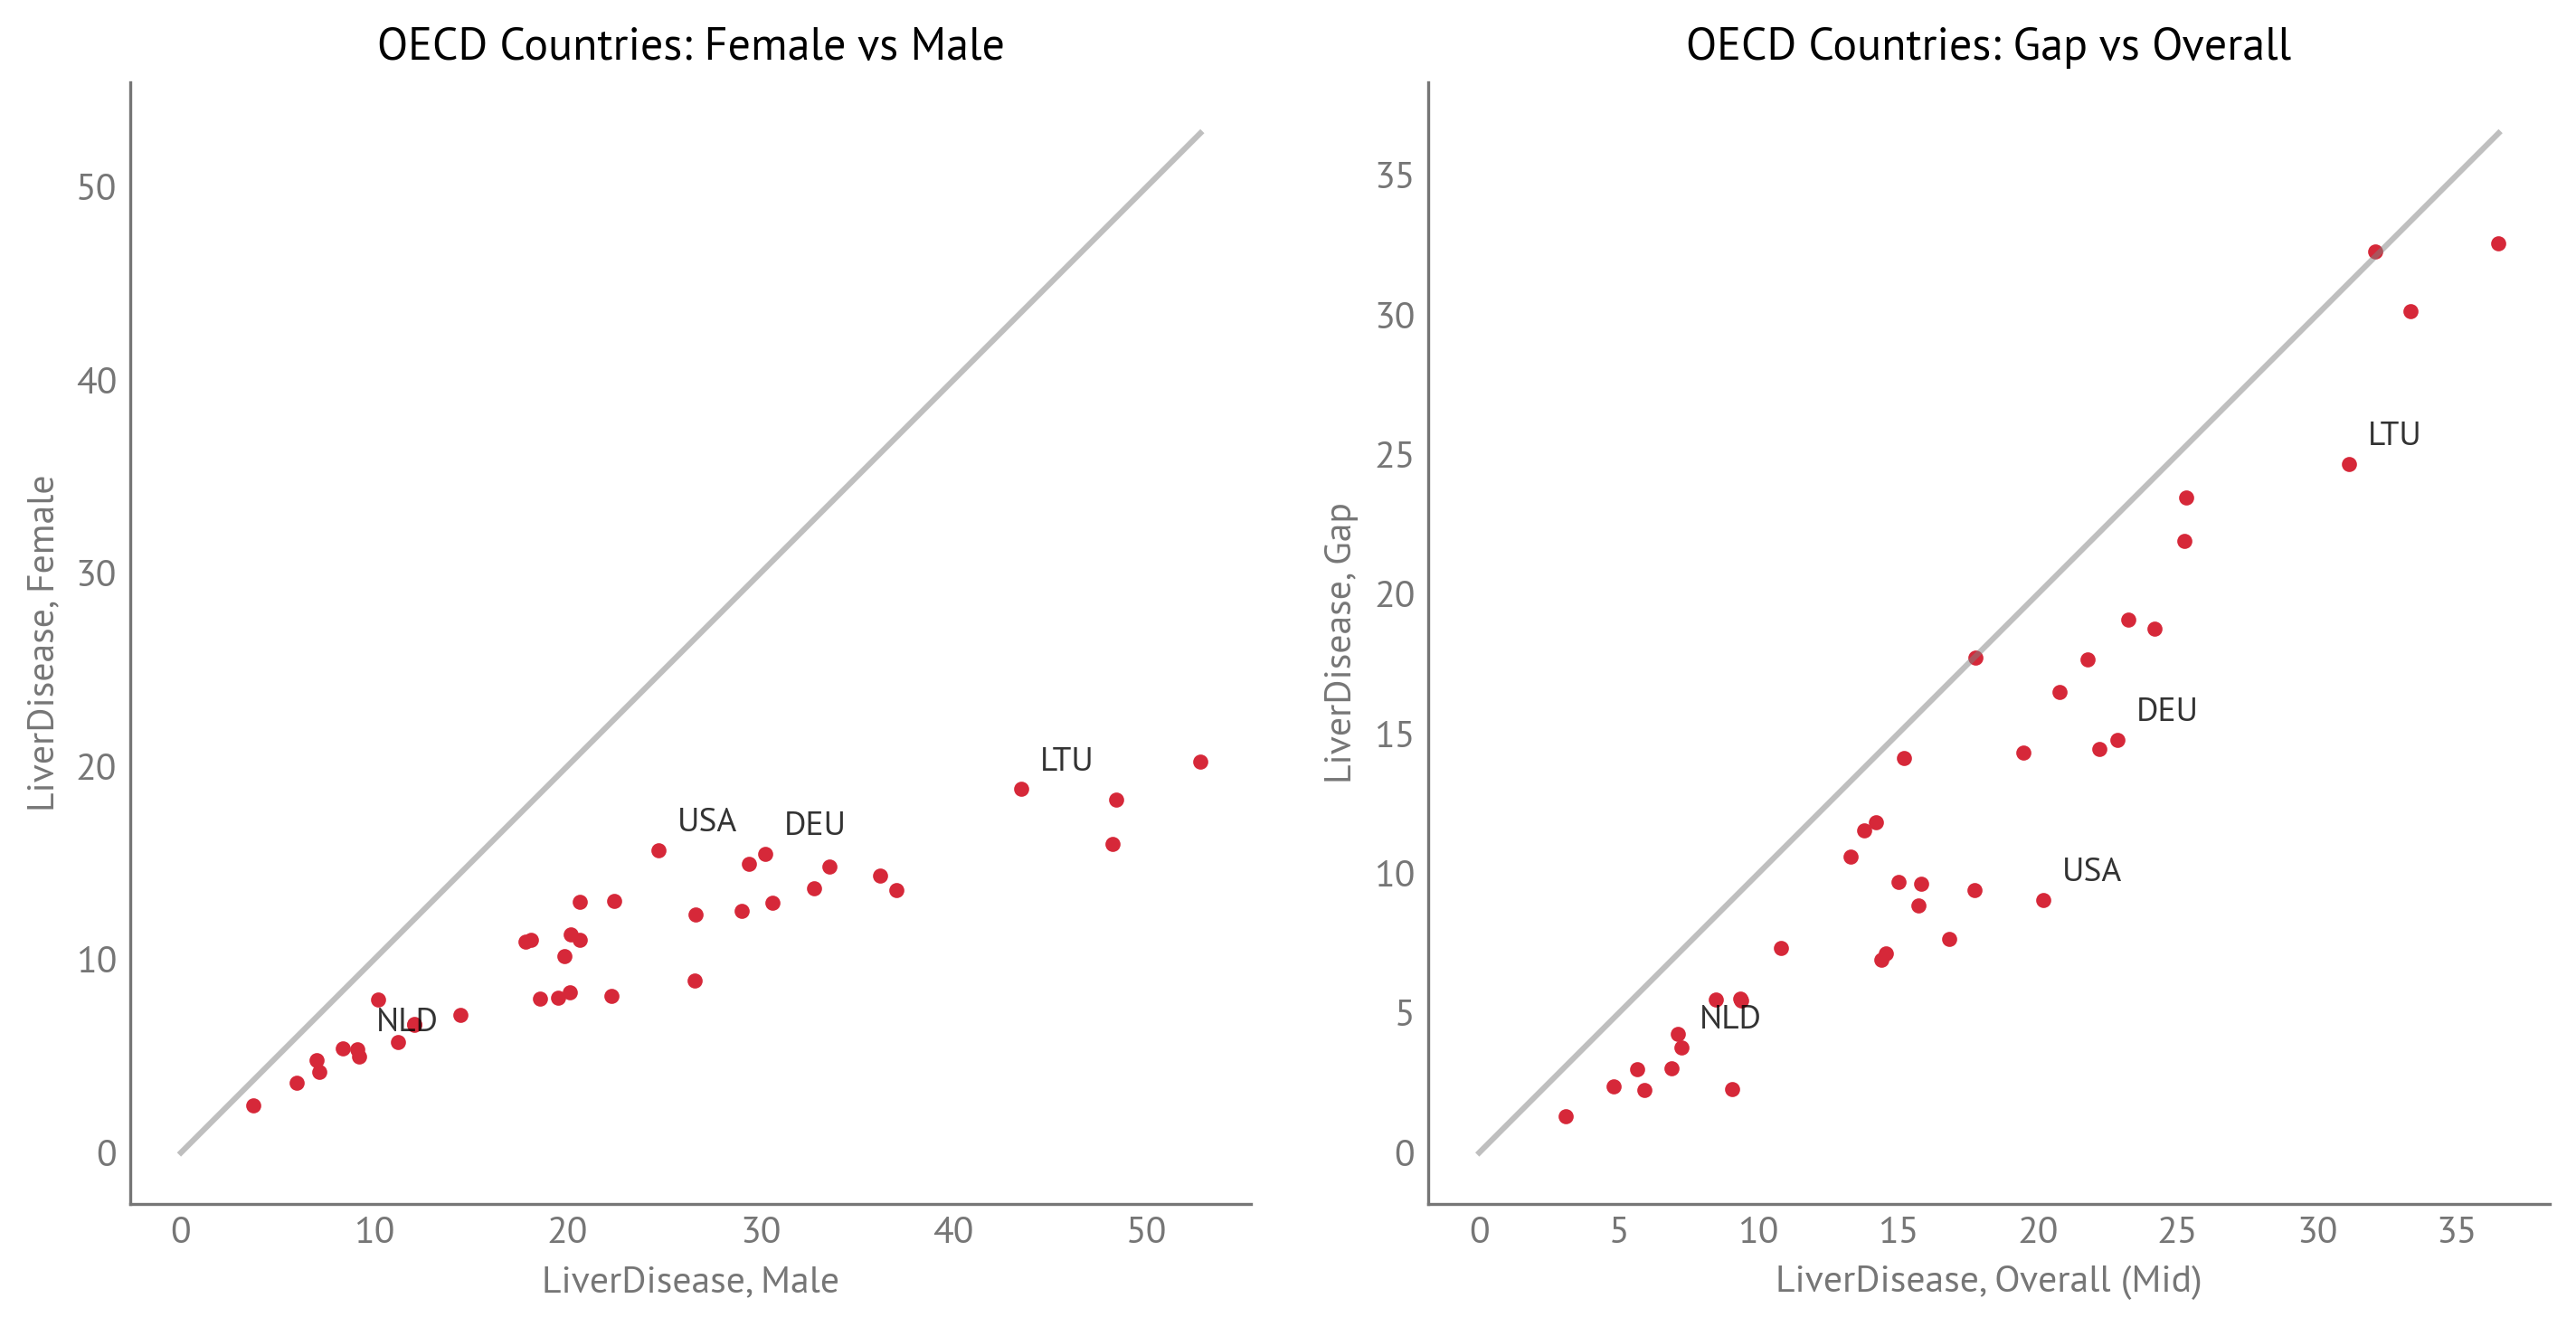
Figure 11:Liver Disease: Female vs Male and Gap vs Overall (OECD Countries)
Unintentional Injuries
Unintentional injuries death rates (per 100,000 population) - Deaths from unintentional injuries (including falls, drowning, fires, and other accidents). These injuries often show gender differences due to occupational exposures and risk-taking behaviors.
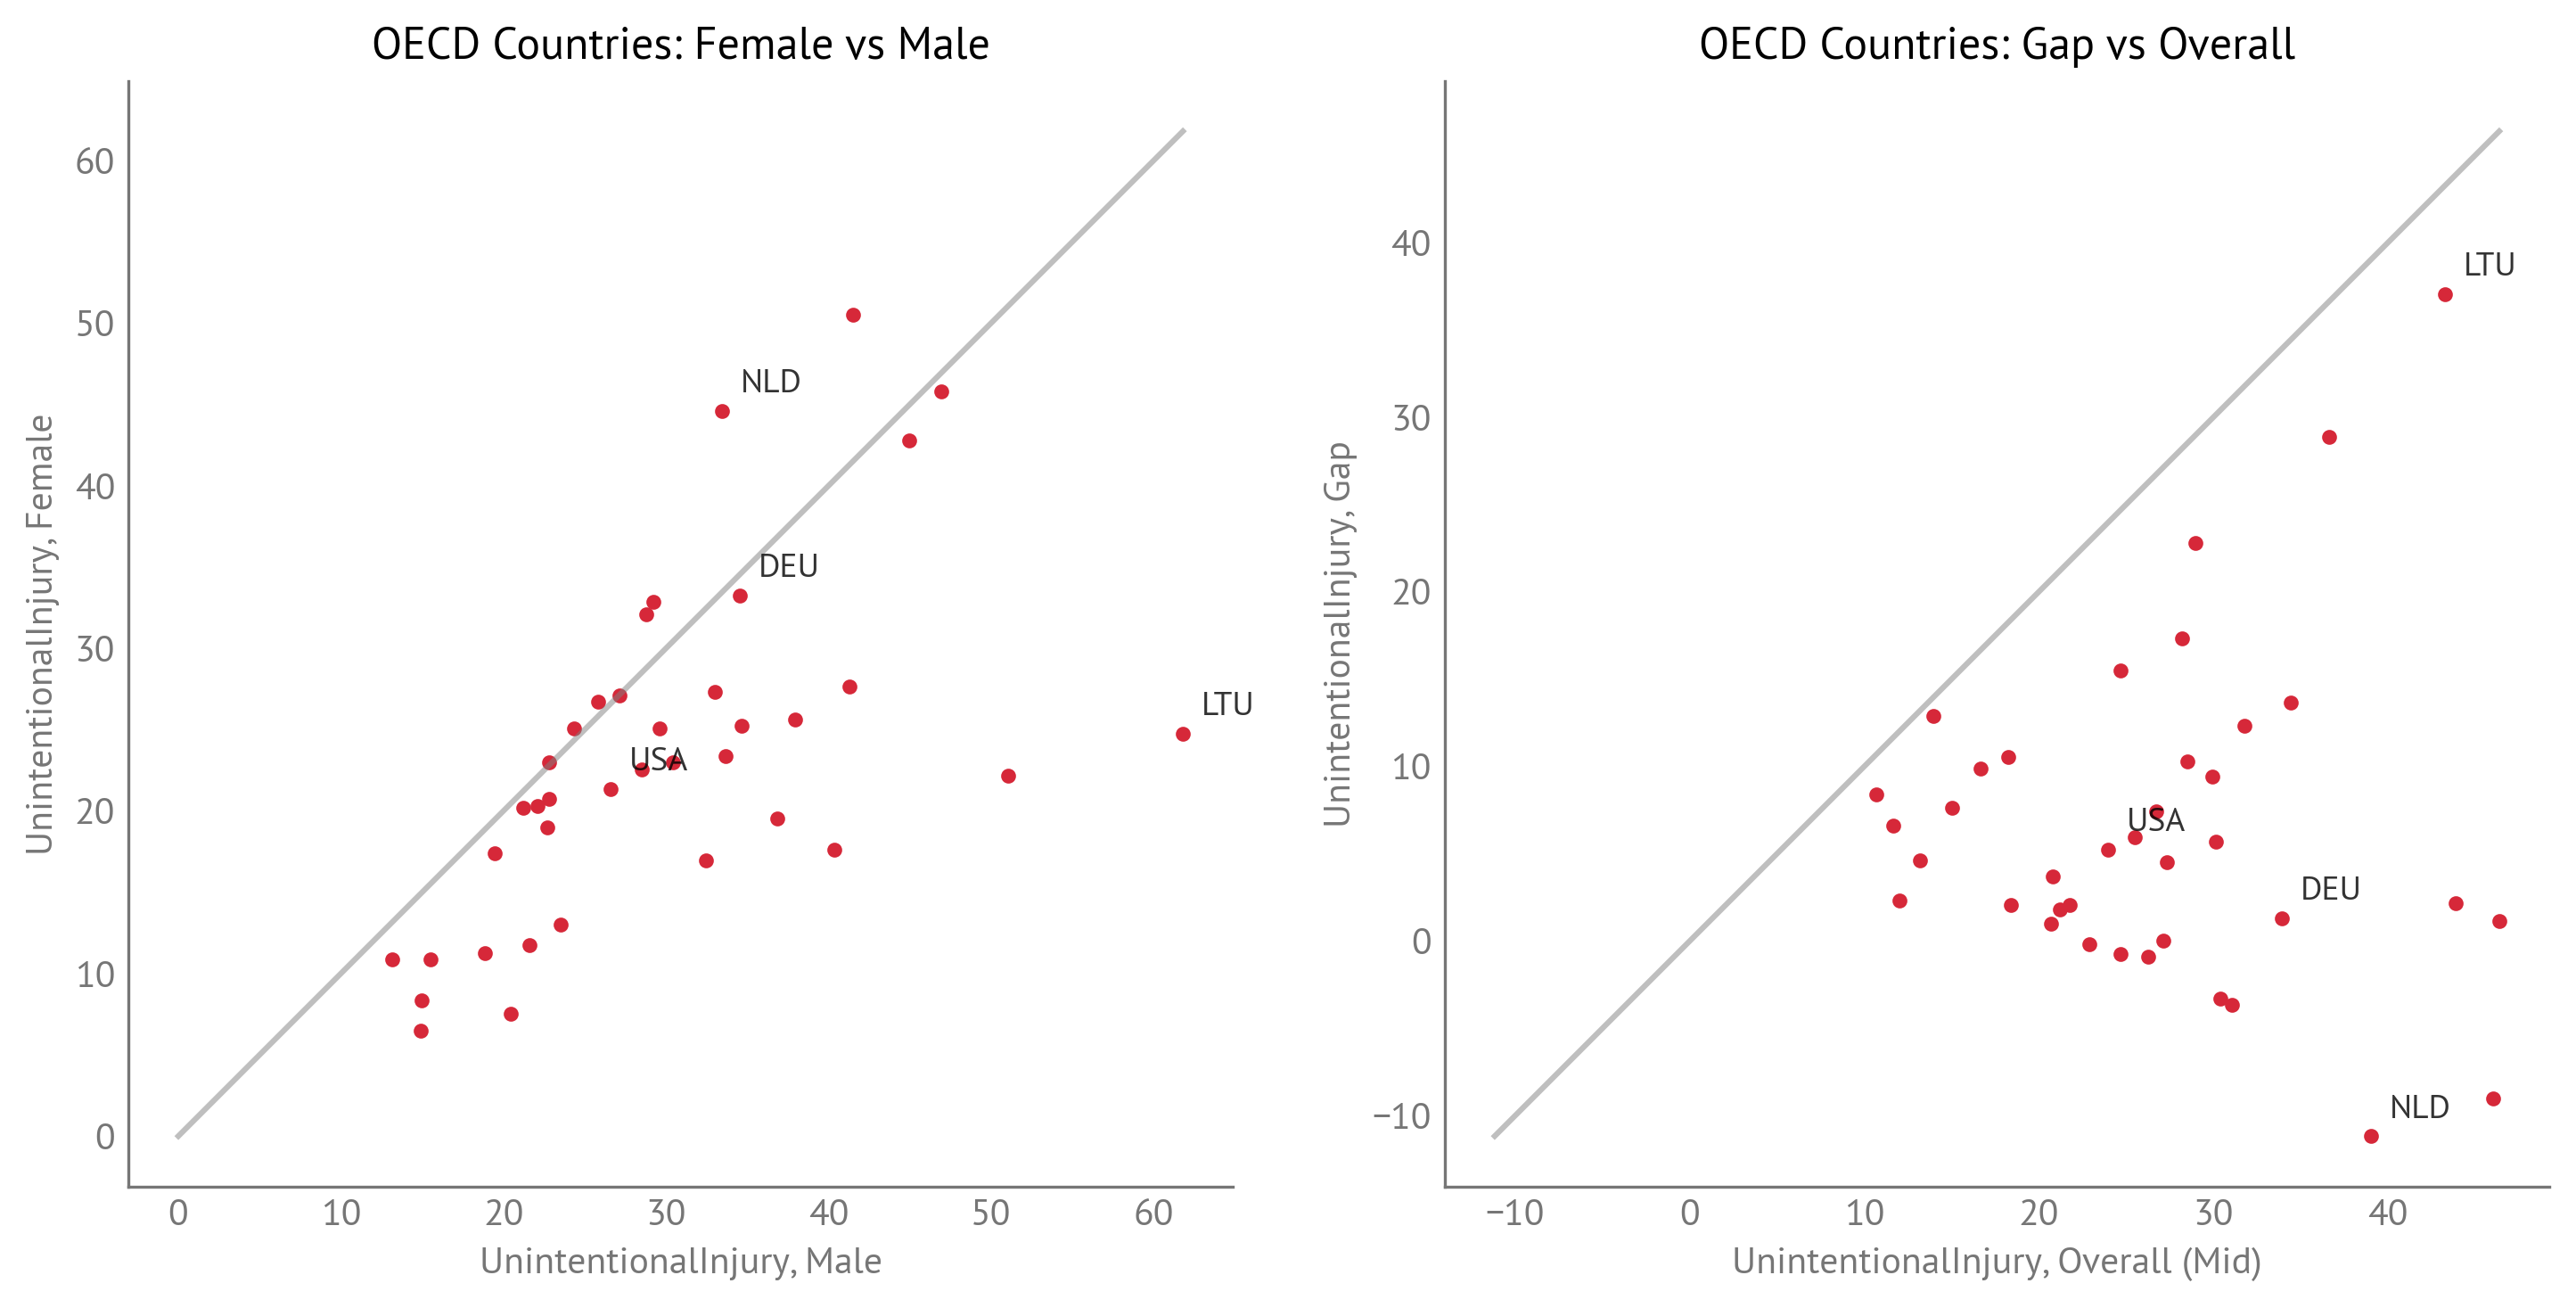
Figure 12:Unintentional Injuries: Female vs Male and Gap vs Overall (OECD Countries)
Summary Statistics
Target Variables by Country
The following tables show HALE and Life Expectancy gender gaps for all OECD countries, ranked by gap size.
| Country | HALE_Years_Male | HALE_Years_Female | HALE_gap |
|---|---|---|---|
| Lithuania | 63.1 | 69.2 | 6.06 |
| Latvia | 63 | 68.7 | 5.69 |
| Poland | 65.1 | 70 | 4.93 |
| Estonia | 65.8 | 70.6 | 4.79 |
| Slovakia | 65.5 | 69.4 | 3.93 |
| Hungary | 64.7 | 68.4 | 3.72 |
| South Korea | 70.6 | 74.2 | 3.56 |
| Mexico | 63.9 | 67 | 3.1 |
| Czechia | 66.9 | 70 | 3.09 |
| Japan | 72.1 | 75 | 2.93 |
| Slovenia | 68.8 | 71.7 | 2.91 |
| Colombia | 66.4 | 69.3 | 2.89 |
| Portugal | 68.8 | 71.2 | 2.39 |
| Costa Rica | 68.1 | 70.3 | 2.26 |
| Finland | 69 | 71.3 | 2.24 |
| France | 69.8 | 71.6 | 1.82 |
| United States | 65.1 | 66.9 | 1.8 |
| Spain | 70.9 | 72.4 | 1.52 |
| Chile | 68.6 | 70.1 | 1.41 |
| Austria | 69.7 | 71.1 | 1.36 |
| Greece | 69.1 | 70.5 | 1.33 |
| Canada | 69.7 | 70.9 | 1.25 |
| Türkiye | 66.6 | 67.8 | 1.17 |
| Australia | 69.7 | 70.8 | 1.16 |
| Italy | 70.9 | 71.9 | 1.07 |
| Belgium | 69.6 | 70.6 | 0.941 |
| Luxembourg | 71 | 71.9 | 0.915 |
| Denmark | 69.9 | 70.8 | 0.895 |
| Germany | 69 | 69.9 | 0.862 |
| United Kingdom | 69.4 | 70.1 | 0.695 |
| Israel | 71.2 | 71.8 | 0.611 |
| New Zealand | 69.5 | 70 | 0.487 |
| Ireland | 70.3 | 70.7 | 0.454 |
| Switzerland | 71.3 | 71.7 | 0.338 |
| Norway | 71 | 71.3 | 0.239 |
| Iceland | 71.3 | 71.5 | 0.16 |
| Sweden | 71.3 | 71.5 | 0.134 |
| Netherlands | 71.1 | 71.1 | 0.0186 |
Summary:
Countries are ranked by HALE gap (Female - Male), with positive values indicating women live longer in full health
The table shows Male HALE, Female HALE, and the gender gap for each country
Countries with larger gaps have greater gender differences in healthy life expectancy
| Country | LifeExpectancy_Years_Male | LifeExpectancy_Years_Female | LifeExpectancy_gap |
|---|---|---|---|
| Lithuania | 71.5 | 80.8 | 9.36 |
| Latvia | 71.1 | 80 | 8.92 |
| Estonia | 74.7 | 82.6 | 7.92 |
| Poland | 73.9 | 81.5 | 7.55 |
| Slovakia | 74.2 | 80.9 | 6.67 |
| Hungary | 73 | 79.5 | 6.54 |
| Mexico | 72.8 | 78.9 | 6.09 |
| South Korea | 80.6 | 86.6 | 6.01 |
| Portugal | 78.4 | 84.1 | 5.77 |
| Czechia | 76.3 | 81.9 | 5.63 |
| Slovenia | 78.6 | 84 | 5.47 |
| Japan | 81.7 | 87.2 | 5.45 |
| France | 79.8 | 85.2 | 5.38 |
| Colombia | 75.3 | 80.5 | 5.22 |
| Spain | 80.5 | 85.7 | 5.12 |
| Finland | 79.1 | 84.2 | 5.04 |
| Türkiye | 75.1 | 80.1 | 5.04 |
| Costa Rica | 77.9 | 82.7 | 4.78 |
| Chile | 78.7 | 83.3 | 4.68 |
| United States | 76.5 | 81 | 4.45 |
| Germany | 78.7 | 83.2 | 4.44 |
| Austria | 79.4 | 83.8 | 4.33 |
| Greece | 78.8 | 83 | 4.21 |
| Belgium | 79.5 | 83.7 | 4.15 |
| Italy | 80.9 | 84.9 | 3.98 |
| Luxembourg | 80.8 | 84.7 | 3.92 |
| Australia | 80.7 | 84.6 | 3.85 |
| Canada | 80.1 | 83.9 | 3.77 |
| Israel | 80.7 | 84.3 | 3.58 |
| Denmark | 79.5 | 83.1 | 3.57 |
| United Kingdom | 79.5 | 82.9 | 3.42 |
| Switzerland | 81.8 | 85.1 | 3.36 |
| Ireland | 80.3 | 83.6 | 3.33 |
| New Zealand | 80.2 | 83.4 | 3.27 |
| Sweden | 81.2 | 84.2 | 3.07 |
| Norway | 81.1 | 84.2 | 3.04 |
| Netherlands | 80.8 | 83.8 | 2.91 |
| Iceland | 81.1 | 83.9 | 2.8 |
Summary:
Countries are ranked by Life Expectancy gap (Female - Male), with positive values indicating women live longer overall
The table shows Male Life Expectancy, Female Life Expectancy, and the gender gap for each country
Life Expectancy gaps are typically larger than HALE gaps, reflecting that women’s advantage in total years lived is greater than their advantage in healthy years
Predictors: Rates and Gaps
The following tables summarize the distribution of predictors across OECD countries, showing both overall rates (midpoint between male and female values) and gender gaps.
| Indicator | Median Rate | Min Rate | Max Rate | Corr HALE | Corr LE |
|---|---|---|---|---|---|
| Neoplasms | 265 | 80.3 | 365 | 0.214 | 0.228 |
| Cardiovascular | 241 | 113 | 746 | 0.689 | 0.721 |
| ChronicRespiratory | 43.7 | 17.1 | 85.4 | -0.537 | -0.517 |
| UnintentionalInjury | 26.5 | 10.7 | 46.4 | 0.22 | 0.259 |
| Diabetes | 18.5 | 7.4 | 61 | 0.338 | 0.377 |
| LiverDisease | 15.5 | 3.09 | 36.5 | 0.734 | 0.74 |
| Suicide | 13 | 4.2 | 29.5 | 0.538 | 0.511 |
| RoadTraffic | 5.68 | 2.46 | 16.2 | 0.445 | 0.418 |
| Alcohol | 3.09 | 0.193 | 15 | 0.559 | 0.545 |
| DrugDisorder | 2.14 | 0.212 | 20.8 | -0.194 | -0.232 |
| Homicide | 1.13 | 0.457 | 30.5 | 0.256 | 0.213 |
| COVID | 0 | 0 | 0 |
Summary:
Shows median, minimum, and maximum rates for each predictor across OECD countries
Rates represent the midpoint (average) between male and female values
Includes correlations with HALE gap and Life Expectancy gap
Higher correlations indicate stronger relationships between predictor rates and gender gaps in outcomes
| Indicator | Median Gap | Min Gap | Max Gap | Corr HALE | Corr LE |
|---|---|---|---|---|---|
| Neoplasms | 57.6 | -0.788 | 132 | 0.454 | 0.519 |
| Suicide | 13.8 | 4.51 | 40.2 | 0.748 | 0.733 |
| LiverDisease | 9.65 | 1.29 | 32.6 | 0.724 | 0.733 |
| ChronicRespiratory | 8.03 | -19.3 | 34.1 | 0.475 | 0.55 |
| RoadTraffic | 5.6 | 2.04 | 22 | 0.42 | 0.402 |
| UnintentionalInjury | 4.95 | -11.2 | 37.1 | 0.833 | 0.848 |
| Alcohol | 3.57 | 0.306 | 23.6 | 0.618 | 0.602 |
| DrugDisorder | 1.66 | 0.0226 | 16 | -0.0636 | -0.0932 |
| Homicide | 0.887 | -0.0622 | 47.5 | 0.233 | 0.19 |
| COVID | 0 | 0 | 0 | ||
| Diabetes | -0.173 | -9.83 | 5.5 | -0.478 | -0.564 |
| Cardiovascular | -19 | -124 | 25.6 | -0.596 | -0.633 |
Summary:
Shows median, minimum, and maximum gender gaps for each predictor
Gaps are calculated as Male - Female (positive values indicate men have higher rates)
Includes correlations with HALE gap and Life Expectancy gap
Predictor gaps with strong correlations are likely important drivers of gender gaps in HALE and Life Expectancy
Target Variables: Rates and Gaps
| Indicator | Median | Min | Max |
|---|---|---|---|
| HALE | 70.1 | 65.5 | 73.5 |
| Life Expectancy | 81.4 | 75.5 | 84.4 |
Summary:
Shows median, minimum, and maximum values for HALE and Life Expectancy across OECD countries
Represents overall levels of healthy life expectancy and life expectancy
Provides context for understanding the scale of gender gaps relative to overall levels
| Indicator | Median Gap | Min Gap | Max Gap |
|---|---|---|---|
| HALE | 1.39 | 0.0186 | 6.06 |
| Life Expectancy | 4.56 | 2.8 | 9.36 |
Summary:
Shows median, minimum, and maximum gender gaps for HALE and Life Expectancy
Gaps are calculated as Female - Male (positive values indicate women live longer)
HALE gaps are typically smaller than Life Expectancy gaps, indicating that women’s advantage in healthy years is less than their advantage in total years lived
Relationships Between Predictors
Rate-Gap Correlations
The following table shows correlations between overall rates (Mid) and gender gaps (Gap) for each predictor.
| Indicator | Correlation |
|---|---|
| Homicide | 0.999 |
| Alcohol | 0.982 |
| RoadTraffic | 0.971 |
| DrugDisorder | 0.957 |
| LiverDisease | 0.955 |
| Suicide | 0.9 |
| Neoplasms | 0.685 |
| UnintentionalInjury | 0.0346 |
| ChronicRespiratory | -0.0787 |
| Diabetes | -0.325 |
| Cardiovascular | -0.804 |
| COVID |
Summary:
High positive correlations indicate that predictors with higher overall rates also tend to have larger gender gaps
High negative correlations indicate that predictors with higher overall rates tend to have smaller gender gaps (or vice versa)
These correlations help understand whether gender gaps are driven by overall levels or are independent of them
Inter-Predictor Correlations
The following tables show correlations between predictors, helping identify which predictors tend to co-occur or are related.
| Rate 1 | Rate 2 | Correlation |
|---|---|---|
| UnintentionalInjury | Neoplasms | 0.721 |
| RoadTraffic | Homicide | 0.687 |
| Cardiovascular | Neoplasms | 0.633 |
| Cardiovascular | LiverDisease | 0.631 |
| Alcohol | Cardiovascular | 0.61 |
| Homicide | Neoplasms | -0.601 |
| UnintentionalInjury | Suicide | 0.591 |
| Alcohol | UnintentionalInjury | 0.543 |
| UnintentionalInjury | Cardiovascular | 0.536 |
| Alcohol | Suicide | 0.534 |
Summary:
Shows the top 10 correlations between overall rates (Mid columns) of different predictors
High correlations indicate that certain mortality causes tend to occur together across countries
For example, cardiovascular disease and diabetes may be highly correlated due to shared risk factors
| Gap 1 | Gap 2 | Correlation |
|---|---|---|
| ChronicRespiratory | Neoplasms | 0.734 |
| RoadTraffic | Homicide | 0.723 |
| Alcohol | Cardiovascular | -0.688 |
| Alcohol | Suicide | 0.675 |
| UnintentionalInjury | Suicide | 0.633 |
| Cardiovascular | Suicide | -0.613 |
| UnintentionalInjury | LiverDisease | 0.577 |
| Cardiovascular | Neoplasms | -0.564 |
| ChronicRespiratory | Diabetes | -0.564 |
| Alcohol | LiverDisease | 0.542 |
Summary:
Shows the top 10 correlations between gender gaps (Gap columns) of different predictors
High correlations indicate that gender gaps in different predictors tend to co-occur
For example, gender gaps in external causes (road traffic, homicide, suicide) may be correlated, reflecting shared patterns of risk-taking behavior or occupational exposure
Key Findings
Gender Gaps in Target Variables
HALE Gap: Women consistently live longer in full health than men across OECD countries, with gaps ranging from approximately 1 to 6 years.
Life Expectancy Gap: Women consistently live longer overall than men, with gaps typically larger than HALE gaps (ranging from approximately 2 to 8 years).
Relationship: The correlation between HALE gap and Life Expectancy gap is strong, indicating that countries with larger gender differences in total life expectancy also tend to have larger gender differences in healthy life expectancy.
Gender Gaps in Predictors
External Causes: Gender gaps are largest for external causes of death (road traffic, homicide, suicide), with men having substantially higher rates than women.
Chronic Diseases: Gender gaps in chronic diseases (cardiovascular, neoplasms, chronic respiratory) vary by disease type and country, with some showing larger gaps than others.
Substance-Related: Gender gaps in alcohol use disorders and liver disease are substantial, with men having higher rates, consistent with higher alcohol consumption patterns.
Relationships Between Predictors and Outcomes
Strong Correlations: Predictor gaps with strong correlations to HALE and Life Expectancy gaps are likely important drivers of gender differences in these outcomes.
Rate vs Gap: The relationship between overall rates and gender gaps varies by indicator, with some showing strong correlations and others showing independence.
Co-occurrence: High correlations between predictors suggest shared underlying factors (e.g., socioeconomic conditions, healthcare access, cultural norms) that affect multiple mortality causes simultaneously.
Data Quality and Coverage
Temporal Coverage: All indicators use data from 2000-2019, with the most recent available year selected for each country
Country Coverage: Analysis focuses on OECD countries, providing a relatively homogeneous set of high-income countries
Data Sources:
Target variables (HALE, Life Expectancy): WHO Global Health Observatory
Predictors: IHME Global Burden of Disease (provides consistent methodology and better temporal coverage than WHO alternatives)
Missing Data: Complete-case analysis is used, with countries missing any indicator excluded from the final analysis dataset
Next Steps
This exploratory analysis provides the foundation for:
Bayesian Panel Data Modeling: Using both temporal and cross-country variation to identify predictors of gender gaps
Counterfactual Analysis: Understanding how changes in predictor values would affect gender gaps
Policy Implications: Identifying which factors are most important for reducing gender gaps in healthy life expectancy