Executive Summary
Across all high-income countries, women live longer than men—both in total lifespan (Life Expectancy) and in years lived in good health (Healthy Life Expectancy or HALE). In OECD countries, women live an average of 5.7 years longer than men, and enjoy 2.9 more years of healthy life.
This report analyzes what drives these gender gaps by examining the relationship between cause-specific mortality rates and longevity outcomes across 37 OECD countries from 2000-2023. We find that the gap is primarily explained by external causes of death where men have substantially higher mortality rates: road traffic accidents, suicide, homicide, and drug overdoses. Together, these behavioral and injury-related factors account for the majority of the observed gender gap in both lifespan and healthy years.
Key Finding: In the United States, addressing just four factors could reduce the gender gap by approximately 2.5 years in Life Expectancy and 2.1 years in Healthy Life Expectancy: road traffic safety, suicide prevention, drug overdose reduction, and homicide reduction.
Motivation
The gender gap in life expectancy is one of the most consistent patterns in public health, observed across virtually all countries and time periods. While biological factors contribute to this gap, substantial evidence suggests that behavioral and social factors—particularly patterns of violence, substance use, and differential exposure to injury-related causes—play a major role.
Understanding which causes of death contribute most to the gender gap has important policy implications:
It identifies priority areas for interventions to improve population health
It highlights where targeted interventions for men could narrow the gap
It reveals how universal health improvements (benefiting both sexes) would affect gender disparities
This analysis addresses the question: What would happen to the gender gap if we could reduce specific causes of death?
Methodology
Data and Approach
We use a Bayesian hierarchical panel model that analyzes how gender gaps in 12 different causes of death relate to gender gaps in life expectancy and healthy life expectancy. The analysis covers:
Countries: 37 OECD countries (Turkey excluded as a statistical outlier)
Time Period: 2000-2023 (888 country-year observations per model)
Target Outcomes:
Healthy Life Expectancy (HALE) gap - IHME data
Life Expectancy (LE) gap - Our World in Data
Predictors: Gender gaps in 12 causes of death from IHME’s Global Burden of Disease:
External causes: Road traffic, suicide, homicide, drug disorders, unintentional injuries, alcohol
Chronic diseases: Cardiovascular disease, cancer (neoplasms), diabetes, chronic respiratory disease, liver disease
Pandemic: COVID-19
Statistical Framework
The model examines both cross-country differences (e.g., why does Iceland have a smaller gap than the USA?) and within-country changes over time (e.g., did the gap change as suicide rates evolved in a given country?). This panel approach provides more robust evidence than cross-sectional analysis alone.
Key features:
Each cause’s effect is measured as: “How much does a one-standard-deviation increase in that cause’s gender gap change the overall life expectancy gender gap?”
The model accounts for country-specific baseline differences through random effects
All predictors are entered simultaneously, so each effect is adjusted for the others
Uncertainty is quantified through Bayesian posterior distributions
Results
What Drives the Gender Gap?
The analysis reveals that external causes of death are the primary drivers of the gender gap:
Top Contributors to the Gap (larger male excess mortality → larger gap favoring women):
Road Traffic Accidents (β = 0.46 for HALE, 0.45 for LE): The single strongest predictor. Countries where men die in traffic accidents at much higher rates than women have substantially larger gender gaps in longevity.
Suicide (β = 0.36 for HALE, 0.36 for LE): The second or third strongest factor. Higher male suicide rates are strongly associated with larger longevity gaps.
Homicide (β = 0.31 for HALE, 0.44 for LE): Higher male homicide victimization contributes substantially to the gap, especially for total lifespan.
Chronic Respiratory Disease (β = 0.37 for HALE, 0.30 for LE): A significant contributor, possibly reflecting smoking-related differences.
Cancer/Neoplasms (β = 0.24 for HALE, 0.31 for LE): Gender differences in cancer mortality contribute moderately to longevity gaps.
Factors with “Competing Risk” Effects (counterintuitive negative relationships):
Cardiovascular Disease (β = -0.27 for HALE, -0.19 for LE): Countries with larger male cardiovascular mortality excess actually have smaller longevity gaps. This reflects a “competing risks” phenomenon: in populations where people survive other causes (road traffic, suicide, etc.) to reach older ages, cardiovascular disease becomes the dominant cause of death, and gender differences in CVD narrow.
Diabetes (β = -0.13 for HALE, -0.11 for LE): Similar competing risk pattern.
COVID-19’s Impact:
Small positive effect (β = 0.06 for HALE, 0.11 for LE)
By 2023, COVID’s contribution had largely resolved
Larger effect on total lifespan than on healthy years
Model Performance
Both models achieve excellent fit (R² > 0.98), explaining over 98% of the variation in gender gaps across all country-years. This indicates that the 12 predictor variables capture nearly all systematic variation in longevity gaps.
United States Case Study: Counterfactual Analysis
To illustrate the practical implications, we computed what would happen to the USA’s gender gaps (2023) if each cause could be reduced to the best level observed across all OECD countries and years:
Life Expectancy Gap - Potential Reductions:
| Factor | Potential Reduction (years) | Best-in-Class Example |
|---|---|---|
| Road Traffic | -0.83 | Iceland 2017 |
| Drug Disorders | -0.77 | Japan 2013 |
| Suicide | -0.52 | Greece 2002 |
| Homicide | -0.29 | Zero gap |
| Liver Disease | -0.22 | Iceland 2001 |
| Cancer | -0.19 | Zero gap |
| Alcohol | -0.16 | Colombia 2016 |
| Unintentional Injury | -0.06 | Zero gap |
| COVID-19 | -0.01 | Zero gap |
Gap-Widening Factors (due to competing risks):
Diabetes: +0.23 years
Chronic Respiratory: +0.18 years
Cardiovascular: +0.16 years
Net Potential Reduction: 2.5 years in the Life Expectancy gap (currently 5.7 years globally)
How These Factors Have Evolved Over Time: Life Expectancy
The static 2023 snapshot tells us where we are today, but the temporal analysis reveals how we got here and which problems are improving vs. worsening:
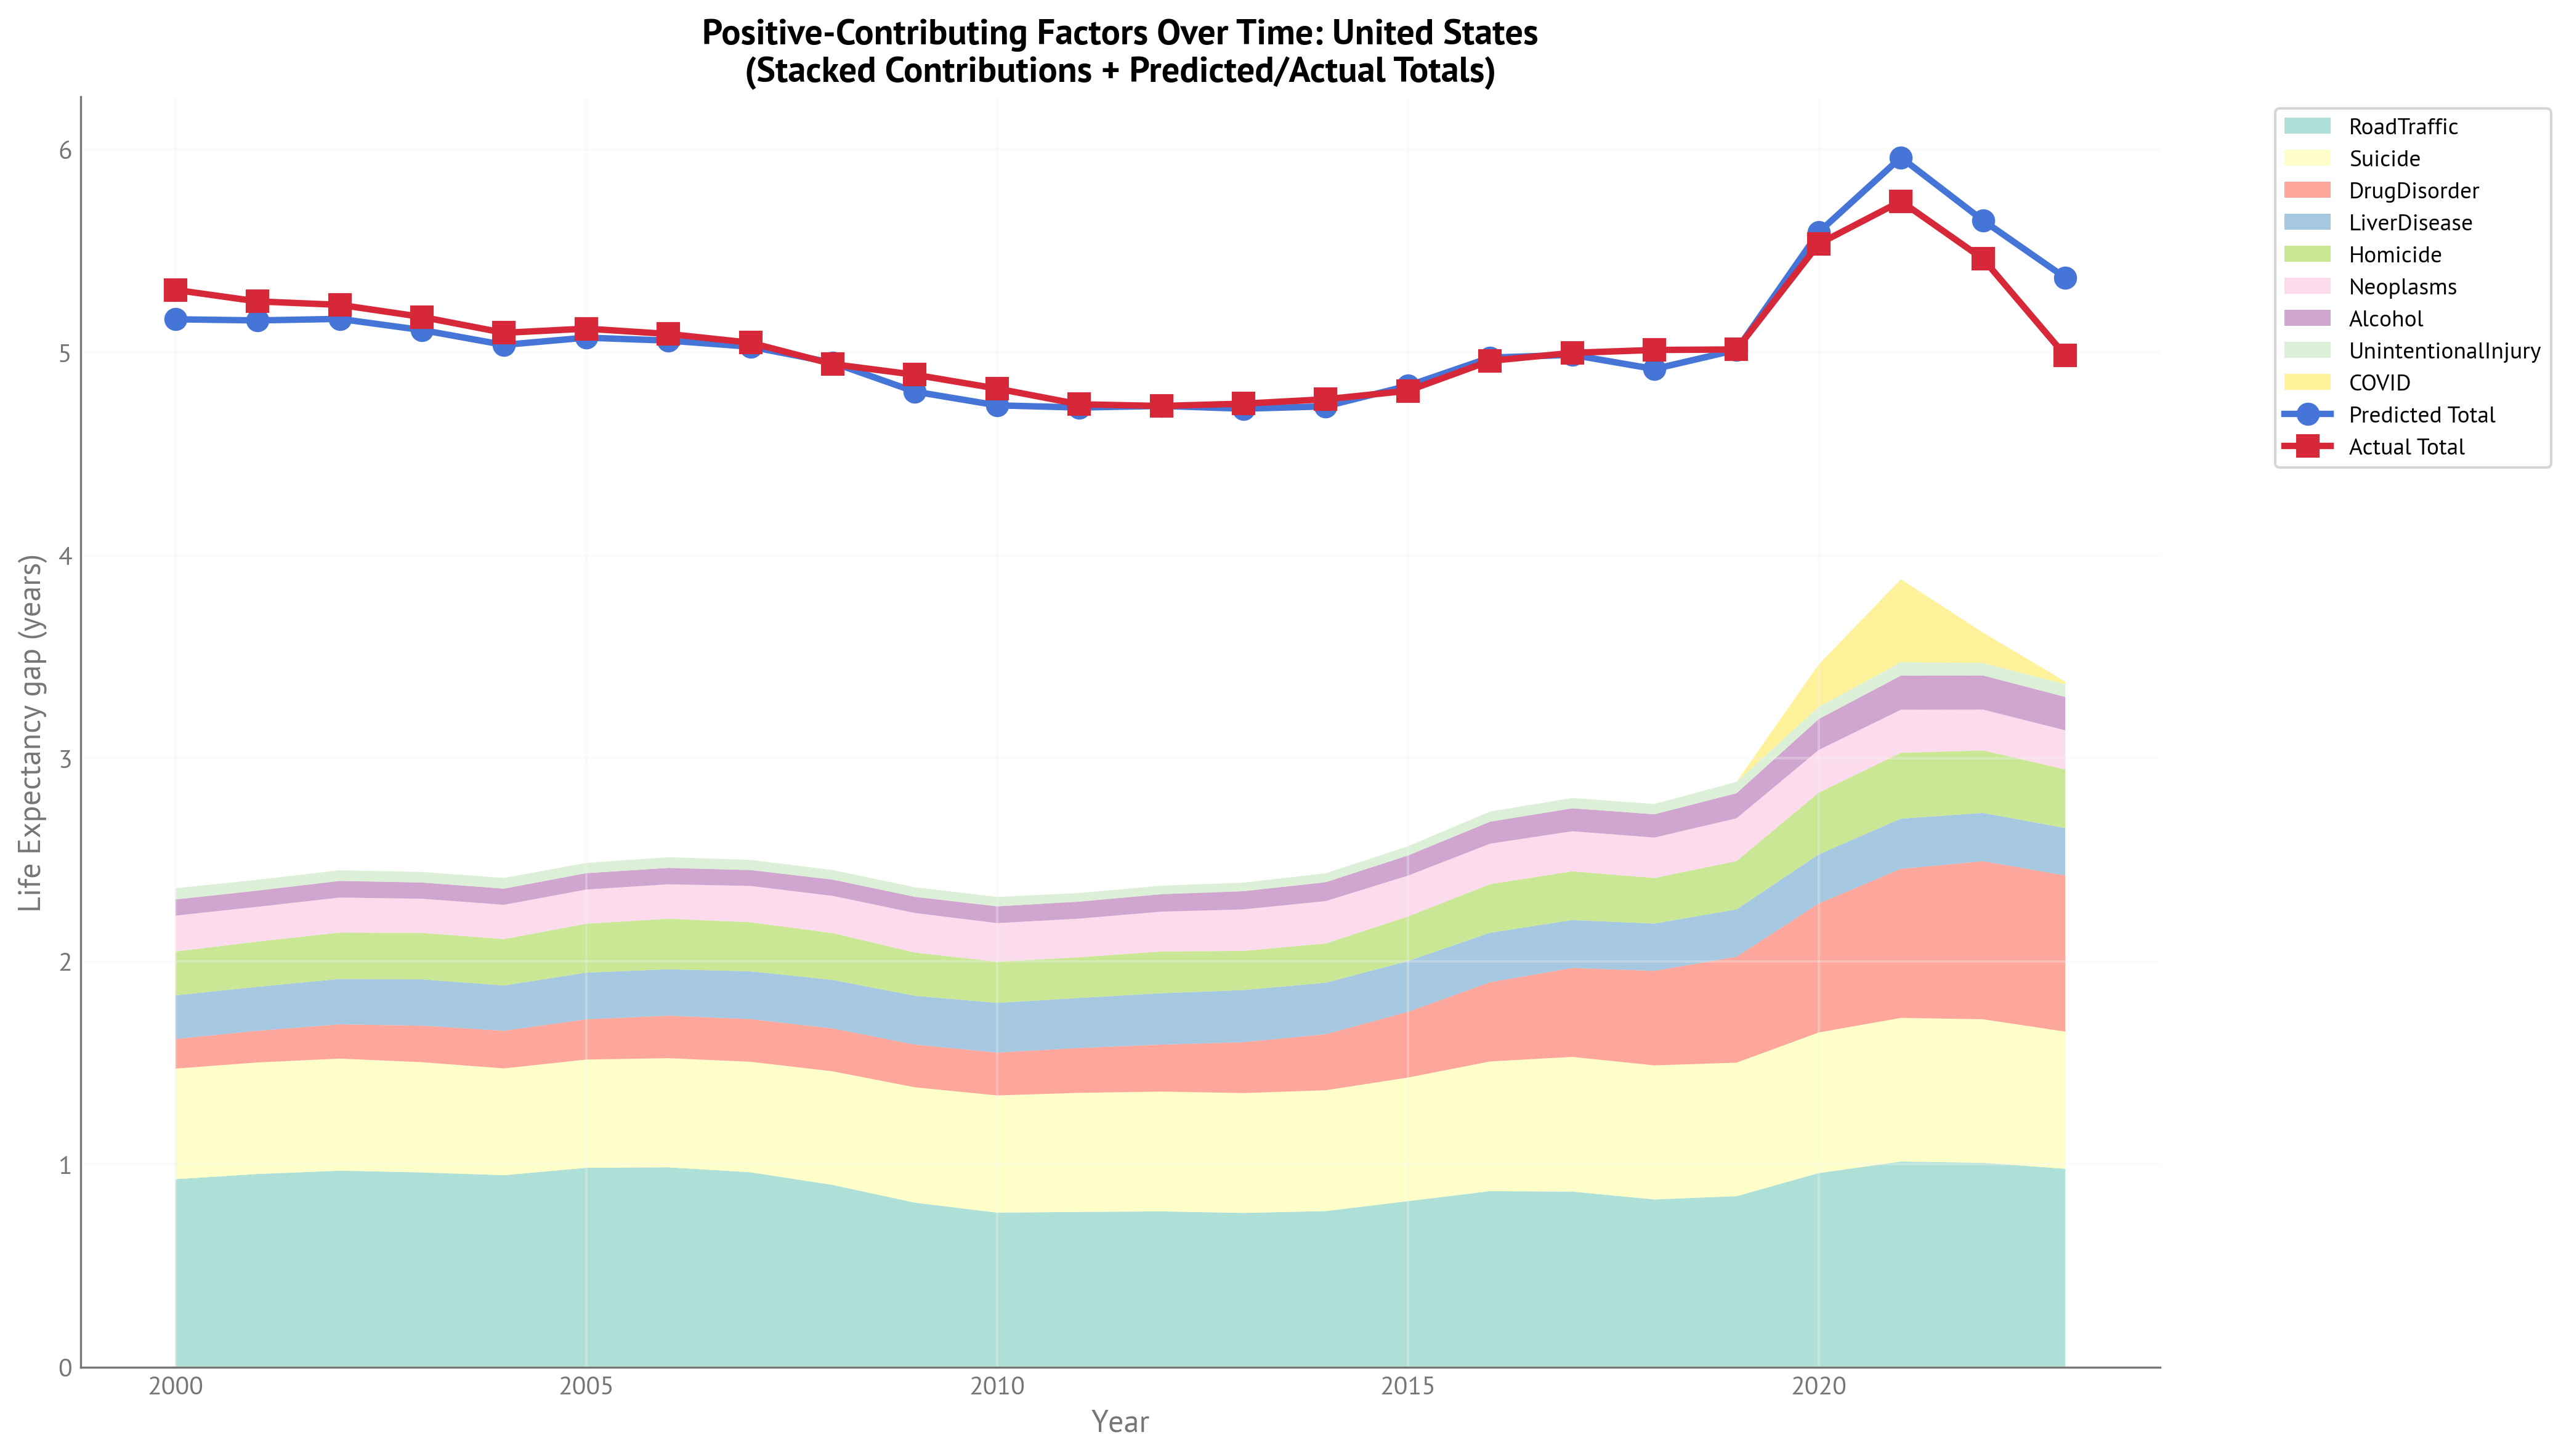
Key Temporal Patterns (2000-2023):
Drug Disorders - Dramatic Growth: The opioid epidemic is clearly visible, with drug-related contributions growing substantially from 2010 onward, becoming the second-largest factor by 2023. This represents a worsening problem that has partially offset improvements in other areas.
Road Traffic - Persistent Leader: Road traffic remains the largest single contributor throughout the entire period, though with some improvement from its peak. This demonstrates both that progress is possible and that substantial opportunity remains.
Suicide - Relatively Stable: Suicide’s contribution has remained fairly consistent over time, indicating this is a persistent problem without major improvements despite increased awareness and prevention efforts.
COVID-19 Spike and Recovery: A clear spike in 2020-2021 during the acute pandemic phase, followed by substantial recovery by 2023. This shows the temporary nature of COVID’s impact on the gender gap.
Total Explainable Gap: The total height of the stacked area shows the sum of all gap-closing opportunities has increased over the 2000-2023 period, primarily driven by the growth in drug-related deaths. This means the gap has become more “explainable” by modifiable factors, but also indicates emerging challenges.
Interpretation: The temporal analysis reveals that while some traditional causes of the gender gap have improved modestly (road traffic), new problems have emerged (opioid epidemic) that have maintained or widened the gap. The persistence of suicide and the growth of drug deaths suggest that mental health and addiction services have not kept pace with need.
Healthy Life Expectancy (HALE) Gap - Potential Reductions:
| Factor | Potential Reduction (years) | Best-in-Class Example |
|---|---|---|
| Road Traffic | -0.87 | Iceland 2017 |
| Suicide | -0.52 | Greece 2002 |
| Drug Disorders | -0.47 | Japan 2013 |
| Homicide | -0.20 | Zero gap |
| Liver Disease | -0.16 | Iceland 2001 |
| Alcohol | -0.15 | Colombia 2016 |
| Cancer | -0.15 | Zero gap |
| Unintentional Injury | -0.08 | Zero gap |
| COVID-19 | -0.01 | Zero gap |
Gap-Widening Factors (due to competing risks):
Diabetes: +0.28 years
Cardiovascular: +0.23 years
Chronic Respiratory: +0.22 years
Net Potential Reduction: 1.7 years in the HALE gap (currently ~2.9 years globally)
How These Factors Have Evolved Over Time: Healthy Life Expectancy
The HALE temporal patterns are broadly similar to Life Expectancy, but with some important differences reflecting the distinction between total lifespan and healthy years:
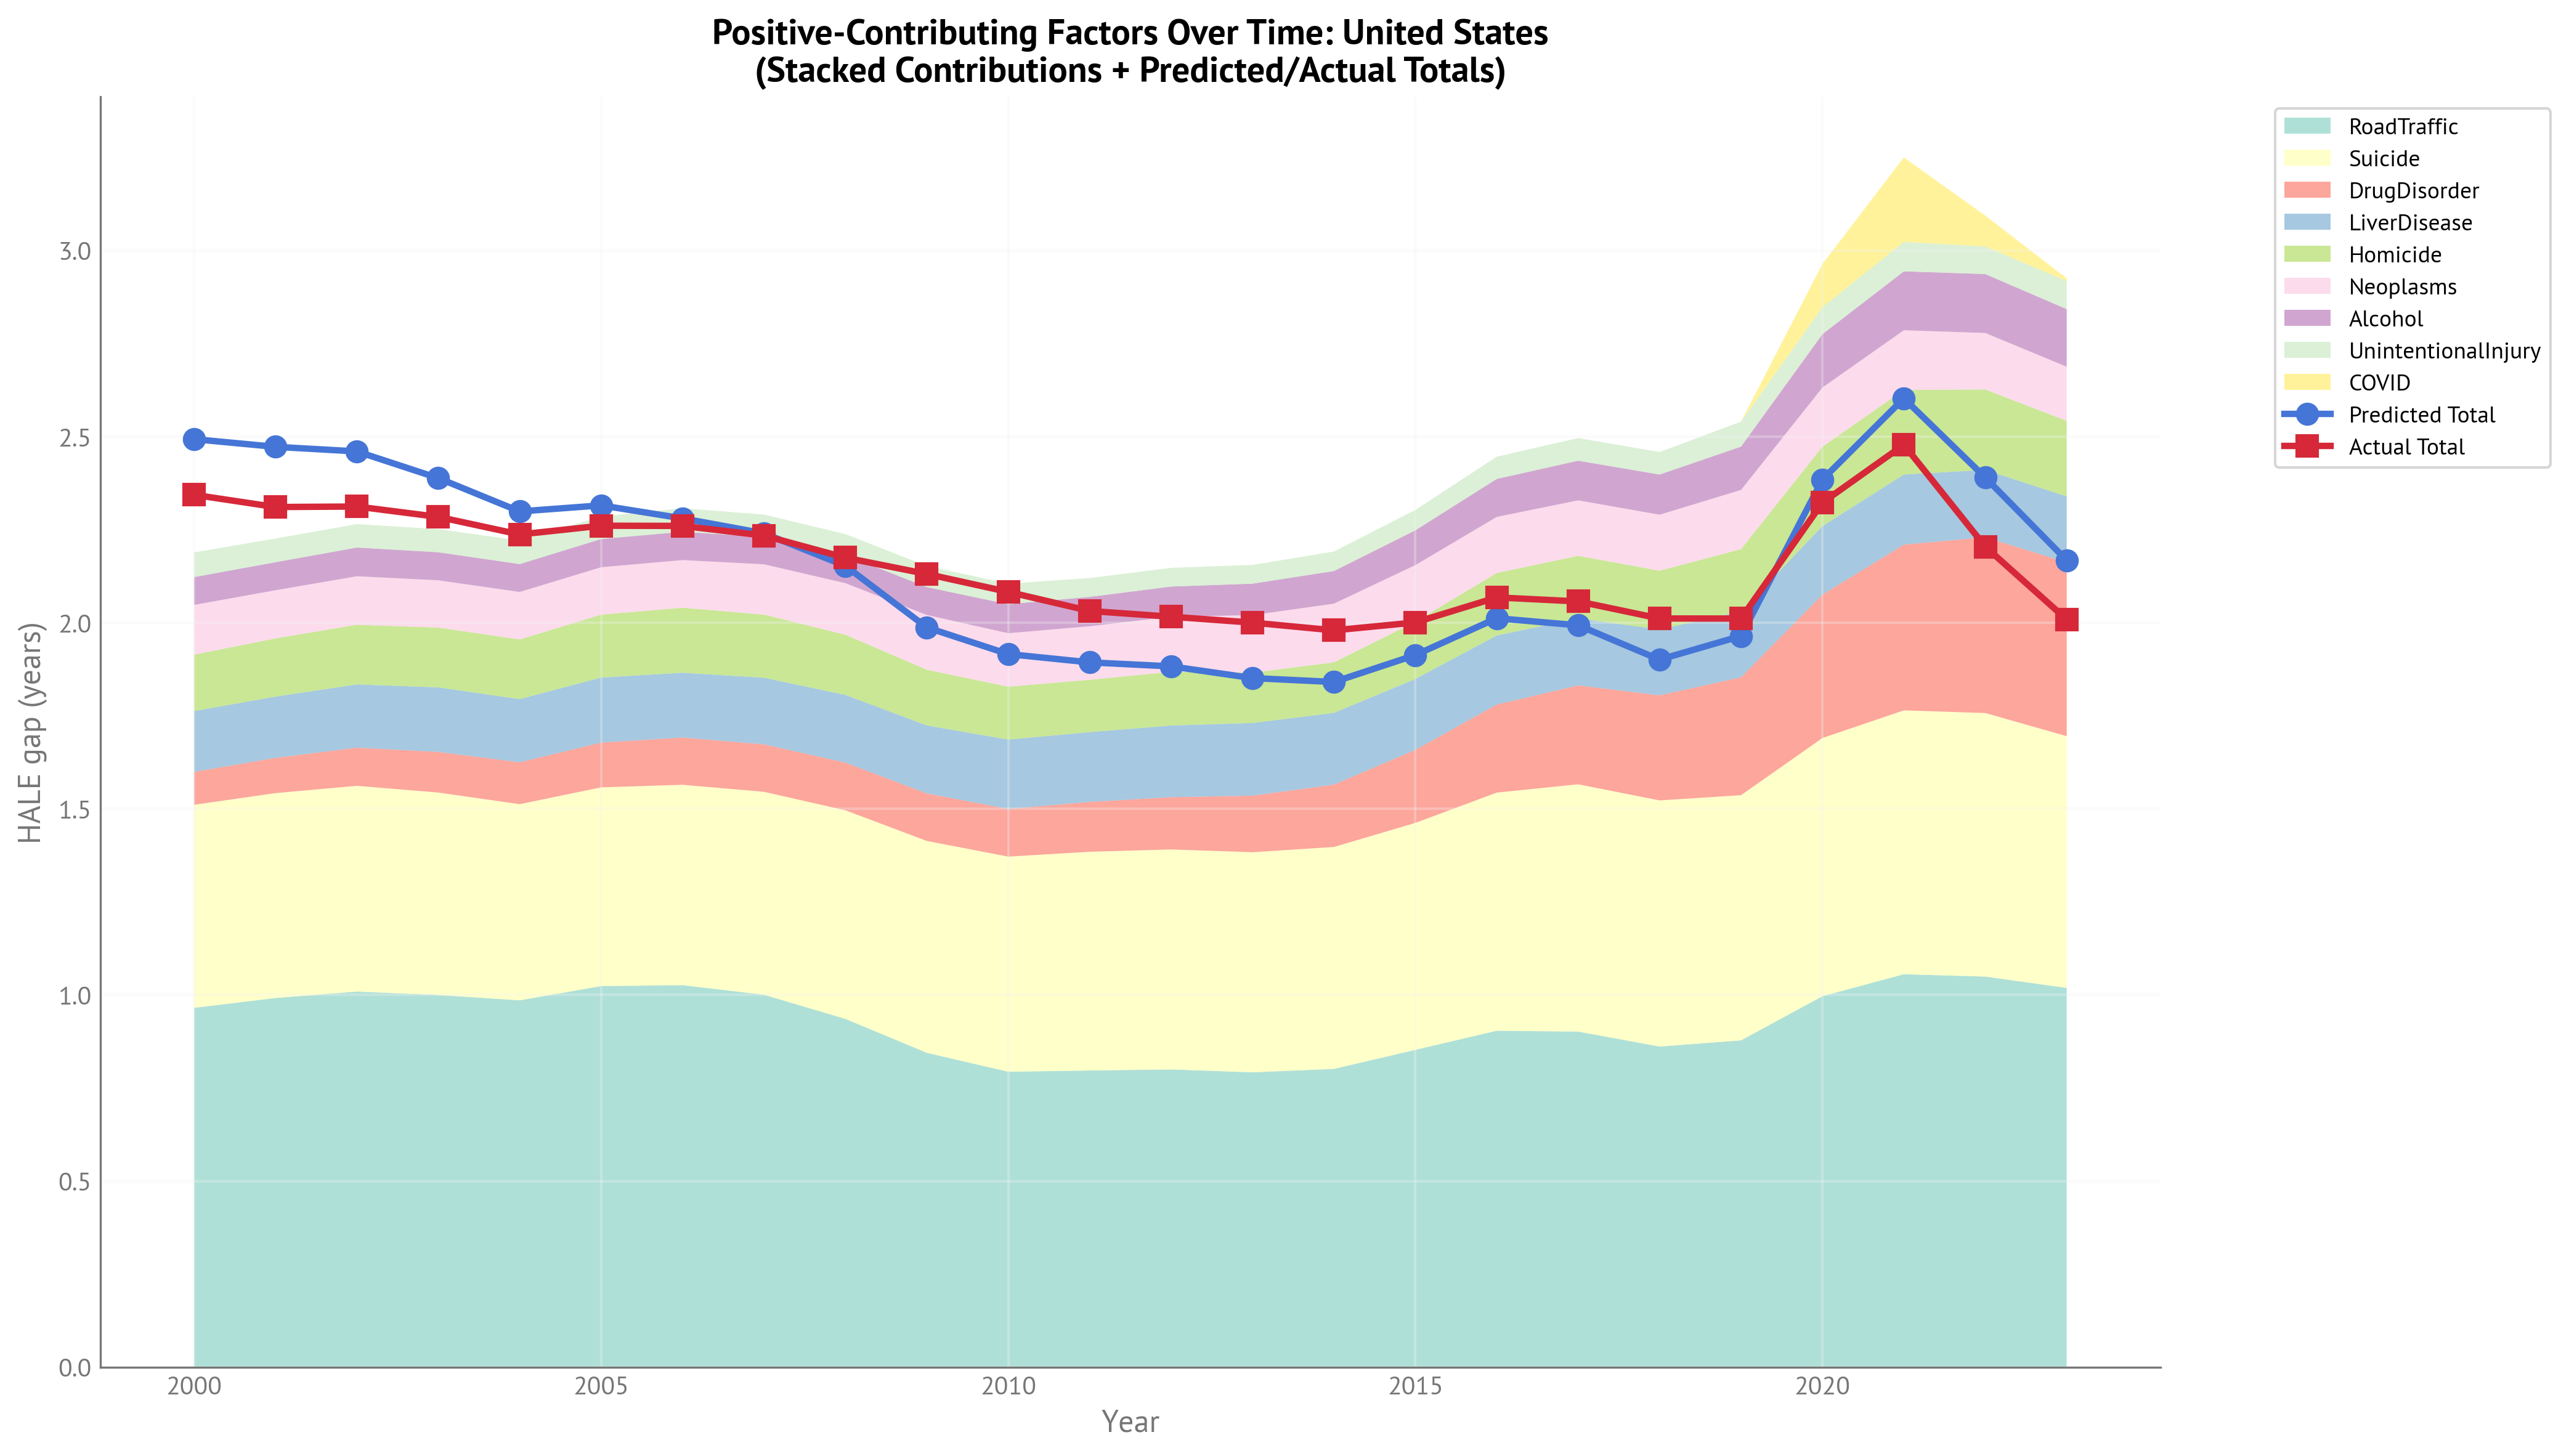
Key Temporal Patterns (2000-2023):
Road Traffic - Dominant Throughout: Like LE, road traffic is the largest contributor across the entire period, demonstrating that traffic injuries affect both quantity and quality of life.
Suicide - Highly Consistent: Suicide’s contribution to the HALE gap is remarkably stable over time and nearly identical in magnitude to its LE effect, indicating suicide affects healthy years and total years proportionally.
Drug Disorders - Growth But Less Dramatic Than LE: While drug-related contributions have increased, the growth is less pronounced for HALE than for LE. This aligns with the finding that drug deaths disproportionately affect younger people, removing more total life-years than healthy life-years.
Competing Risks More Prominent: The gap-widening effects of cardiovascular disease and diabetes are slightly larger for HALE than LE, reflecting that these conditions primarily affect quality of life in older populations who have survived external causes.
Overall Temporal Stability: The total explainable HALE gap has remained relatively stable compared to LE, with less dramatic growth. This suggests the opioid epidemic has had a larger impact on total lifespan than on healthy years lived.
Interpretation: The HALE analysis reinforces that external causes affect both the length and quality of life, but with different emphases. Causes affecting younger individuals (drugs, homicide) show larger effects on LE, while chronic conditions show larger effects on HALE. The relative stability of the HALE gap over time, compared to the growing LE gap, indicates that emerging mortality crises (opioids) are particularly impactful for total years of life lost.
Key Differences: HALE vs Life Expectancy
Comparing the two outcomes reveals important patterns:
Causes affecting younger individuals (drug disorders, homicide) have larger effects on total lifespan than on healthy years because they remove decades of both healthy and unhealthy life
Chronic diseases in older age (cardiovascular, diabetes) have larger effects on healthy years than on total lifespan because they disproportionately affect quality of life in later years
Behavioral/external causes (suicide, road traffic, alcohol) affect both outcomes proportionally
Interpretation
What Does This Mean?
The gender gap in longevity is not primarily due to biological sex differences in chronic disease. Instead, it reflects behavioral and social patterns where men experience substantially higher mortality from:
Violence (homicide, suicide)
Injury-related causes (road traffic, unintentional injuries)
Substance use (drugs, alcohol, including alcohol-related liver disease)
Note on liver disease: Liver disease has multiple causes—approximately 40-50% is alcohol-attributable, with the remainder due to non-alcoholic fatty liver disease (~25-30%), viral hepatitis (~15-20%), and other causes (~10%). The analysis includes both alcohol as a risk factor and liver disease as an outcome, meaning reducing alcohol consumption would affect both components. This overlap is intentional in the IHME framework, as alcohol contributes to multiple causes of death.
The negative coefficients for cardiovascular disease and diabetes are not paradoxical—they reflect that these are “diseases of last resort” that primarily affect people who survive to older ages. In populations with low mortality from external causes, CVD becomes more dominant, but the overall longevity gap remains large because fewer people die young from preventable causes.
Answering the Motivating Question
Why do women live longer than men?
The data suggest the gap is driven primarily by preventable causes where men have substantially higher mortality rates. The gap could be substantially narrowed by addressing:
Traffic safety and road accidents
Mental health and suicide prevention
Drug overdose and substance abuse
Violence and homicide
These are all areas where evidence-based interventions exist and where progress has been demonstrated in some countries but not others.
Discussion: Policy Implications
Which Factors Offer the Biggest Opportunities?
Based on the magnitude of potential effects and feasibility of interventions:
Tier 1 - High Impact & High Feasibility:
Road Traffic Safety (potential: -0.83 years LE, -0.87 years HALE in USA)
Why it matters: Single largest contributor across both HALE and LE
Amenability to intervention: Very high. Proven interventions include:
Infrastructure improvements (roundabouts, protected bike lanes, median barriers)
Speed limit enforcement and traffic calming
Drunk driving prevention (ignition interlocks, sobriety checkpoints)
Graduated driver licensing for young drivers
Success stories: Iceland, Norway, and Sweden have achieved much smaller gender gaps through comprehensive road safety programs
Note: While men have higher road traffic mortality, comprehensive road safety improves outcomes for everyone
Suicide Prevention (potential: -0.52 years for both LE and HALE in USA)
Why it matters: Second or third largest factor; men have 3-4x higher suicide rates; affects lifespan and healthy years equally
Amenability to intervention: Moderate to high. Evidence-based approaches include:
Mental health treatment access and quality
Means restriction (firearm access, bridge barriers)
Crisis intervention services (988 hotline, mobile crisis teams)
Gatekeeper training in communities
Media guidelines for reporting
Success stories: Several countries have achieved substantial reductions through multi-pronged approaches
Note: Suicide prevention programs benefit both sexes but may need male-targeted outreach given lower help-seeking rates
Tier 2 - High Impact & Moderate Feasibility:
Drug Overdose Prevention (potential: -0.77 years LE, -0.47 years HALE in USA)
Why it matters: Largest effect on LE gap (second for HALE), reflecting the opioid epidemic; affects younger individuals, removing decades of life
Amenability to intervention: Moderate. Approaches include:
Harm reduction (naloxone distribution, supervised consumption sites)
Medication-assisted treatment (methadone, buprenorphine)
Prescription drug monitoring
Pain management alternatives
Challenge: Requires addressing underlying addiction, poverty, and despair
Note: Men account for ~70% of overdose deaths; both universal and targeted interventions needed
Violence Reduction (potential: -0.29 years LE, -0.20 years HALE in USA)
Why it matters: Substantial contributor, especially in countries with higher violence rates; larger effect on total lifespan as homicides affect younger individuals
Amenability to intervention: Moderate. Evidence-based approaches include:
Community violence intervention programs
Focused deterrence strategies
Youth development and mentoring
Firearm injury prevention
Success stories: Several cities have achieved major reductions through comprehensive strategies
Note: Homicide victims are predominantly male, but violence reduction benefits entire communities
Tier 3 - Moderate Impact:
Alcohol-Related Harm (potential: -0.16 years in USA)
Interventions: Pricing policies, treatment access, drunk driving prevention
Note: Substantial overlap with road traffic (drunk driving) and liver disease (approximately 40-50% of liver disease deaths are alcohol-attributable). Reducing alcohol consumption would reduce multiple components simultaneously
Chronic Respiratory Disease
Primarily reflects historical smoking patterns
Long latency period means current effects reflect past behaviors
Smoking cessation remains important but effects are delayed
Universal vs. Male-Targeted Interventions
An important insight from this analysis is that efforts to reduce death rates for both men and women would likely also reduce the gaps. For example:
Road safety improvements reduce fatalities for all road users, but since men account for ~70% of traffic deaths, comprehensive safety measures disproportionately benefit men and narrow the gap
Suicide prevention helps people of all genders, but men account for 75-80% of suicide deaths, so prevention efforts have larger absolute impacts on male mortality
Drug overdose prevention helps all people struggling with addiction, but men represent a larger share of overdose deaths
However, since men account for the majority of deaths in these categories, ensuring that interventions reach men effectively is critical to closing the gap. This may involve:
Designing outreach and services that successfully engage populations with higher mortality rates
Addressing any differential access or uptake patterns observed in service utilization data
Optimal Strategy: Combine universal interventions with attention to ensuring equitable reach across all population groups.
What About Chronic Diseases?
The competing risk effects for cardiovascular disease and diabetes suggest that as we successfully prevent deaths from external causes, chronic diseases in older age will become more prominent. This is a success story, not a failure—it means more people are surviving to older ages where these conditions become dominant.
However, the positive effects of cancer and chronic respiratory disease indicate that reducing gender disparities in these conditions would still narrow the gap. Efforts should focus on:
Continued smoking cessation (addressing historical and current gender differences)
Cancer screening and treatment access
Early detection and management of chronic conditions
Limitations and Caveats
Association vs. Causation: While the panel structure strengthens causal inference, these are still observational associations. Unmeasured confounders could influence the relationships.
Best-Case Targets: The counterfactual analysis assumes that achieving another country’s “best” level is feasible, but cultural, economic, and institutional differences may limit transferability.
Simultaneous Changes: The counterfactual effects are computed one at a time. Addressing multiple factors simultaneously might have interactive effects (positive or negative).
Data Quality: IHME GBD data involves substantial estimation and modeling, particularly for cause-specific mortality. Results should be interpreted in light of these measurement considerations.
Conclusion
The gender gap in life expectancy and healthy life expectancy is substantially explained by preventable causes of death where men have higher mortality rates: road traffic accidents, suicide, violence, and substance abuse. The gap could be meaningfully narrowed through evidence-based interventions in these areas.
Road traffic safety, suicide prevention, and substance abuse treatment represent the highest-priority opportunities, combining large potential effects with proven interventions. Progress in these areas would not only narrow the gender gap but would also improve population health overall, as these causes affect people of all genders at younger ages when interventions have the greatest impact on life-years saved.
The persistent nature of the gap across countries and time suggests that structural and cultural factors—not just individual choices—drive these patterns. Addressing the gap requires both universal public health interventions and targeted efforts to engage men in prevention and treatment services, recognizing that masculine norms and structural barriers can limit men’s access to help.