Bayesian Panel Data Model: Analysis of HALE and Life Expectancy Gender Gaps (Extended Through 2023 with IHME HALE)
Purpose
This report presents results from a Bayesian hierarchical panel model that analyzes gender gaps in Healthy Life Expectancy (HALE) and Life Expectancy using both temporal variation and cross-country variation simultaneously. Unlike the cross-sectional Elastic Net models, this panel approach leverages data from all country-year combinations, providing more statistical power and allowing us to assess whether predictors that matter cross-sectionally also matter within countries over time.
This extended analysis uses IHME HALE data (2000-2023) instead of WHO HALE data, providing methodological consistency with the IHME predictor indicators and extending the temporal range through 2023. The Life Expectancy model now uses OWID data (2000-2023), which combines Human Mortality Database and UN World Population Prospects, extending coverage through 2023 to match the IHME HALE temporal range.
Key Questions Addressed:
Do the same predictors that matter cross-sectionally also matter within countries over time?
Does alcohol matter because countries differ from each other, or because countries that reduce alcohol mortality see their gaps narrow?
Do predictors (e.g., cardiovascular mortality) predict gaps within a country over time?
How do Bayesian posterior estimates compare to the cross-sectional Elastic Net coefficients?
How did COVID-19 affect gender gaps in life expectancy?
Do the relationships between predictors and gaps hold through the post-acute COVID period (2022-2023)?
Model Design
Data Structure
The panel dataset transforms from country-level (one row per country) to panel structure (one row per country-year):
HALE Model Time Period: 2000-2023 (using IHME HALE data, includes full COVID period and post-acute phase)
Life Expectancy Model Time Period: 2000-2023 (using OWID LE data, matches HALE temporal coverage)
Countries: OECD countries excluding Turkey (37 countries; Turkey excluded as an outlier with very low likelihood in the Bayesian model)
Observations:
HALE model: 888 country-year combinations (37 countries × 24 years)
LE model: 888 country-year combinations (37 countries × 24 years)
Target Variables:
HALE_gap: Female HALE - Male HALE (mean = 2.94 years) - IHME sourceLE_gap: Female Life Expectancy - Male Life Expectancy (mean = 5.72 years) - OWID source
Predictors: Gap columns only for each indicator (standardized across all country-year observations; Mid predictors excluded based on model comparison)
Rationale for Using IHME HALE
Why switch from WHO HALE to IHME HALE?
Methodological Consistency: All predictor variables (alcohol, suicide, homicide, cardiovascular, etc.) come from IHME’s Global Burden of Disease (GBD) database. Using IHME HALE ensures that the target variable and predictors are methodologically consistent, using the same data collection processes, estimation methods, and quality standards.
Extended Temporal Coverage: IHME HALE data extends through 2023, providing two additional years of post-acute-COVID data compared to WHO’s 2021 cutoff. This allows us to assess whether COVID-19’s effects on gender gaps persisted or attenuated in 2022-2023.
Data Quality: The correlation between WHO and IHME HALE is very high (r > 0.95), indicating excellent agreement. Both sources are high-quality, but IHME provides the advantages above.
Reproducibility: Using a single data source (IHME) for all cause-specific mortality measures and HALE improves transparency and reproducibility.
Note on OWID Life Expectancy Data: The Life Expectancy model now uses OWID data, which combines Human Mortality Database (HMD) and UN World Population Prospects. This provides extended temporal coverage through 2023 (vs 2021 for WHO), matching the IHME HALE temporal range. OWID LE shows high correlation with WHO LE (r = 0.993) and provides 100% complete data for all OECD countries.
Standardization Strategy
Predictors (Standardized - Full Z-Scores):
For each predictor
X_j(Gap versions only; Mid predictors excluded):Compute mean
X̄_jand standard deviations_jacross all country-year observations in the panelTransform to z-scores:
X*_{ijt} = (X_{ijt} - X̄_j) / s_j
Important:
Do not standardize within country or within year
Use a single global transformation for the entire panel
This preserves genuine level differences between countries and across time
Benefits:
Priors are coherent:
β_j ~ N(0, 1)means “1-SD change in predictor → ~1 year change in gap”Coefficients are directly comparable across predictors
Indicator-level importance is straightforward:
|β_j|in standardized spaceConsistent with cross-sectional Elastic Net approach (time-extended version)
Targets (Centered Only, Do Not Scale):
For HALE_gap and LE_gap separately:
Compute global mean across all country-years:
ȳ = mean(y_{it})Center (but do not scale):
y*_{it} = y_{it} - ȳKeep units in years (not standardized)
Why center but not scale:
Interpretability: Effects remain in “years” (e.g., “1-SD reduction in alcohol → 0.6-year reduction in gap”)
Numerical behavior: Gap scale is modest (0-8 years), no scaling needed for numerical stability
Priors: With standardized predictors and unscaled (centered) target:
β_j ~ N(0, 1)is sensible: most effects within ±2 years per 1-SD changeσ ~ HalfNormal(1)reflects ~1 year unexplained variation
Model Specification
Model Structure: Bayesian hierarchical model with country-level random intercepts and shared slopes.
Notation:
y_{it}= HALE gap (or LE gap) for country i in year t (centered:y*_{it} = y_{it} - ȳ)X*_{it}= vector of standardized predictors (Gap columns, z-scores across full panel)α_i= country-specific random interceptβ= shared slope coefficients (same across all countries)For HALE:
t∈ 2000–2023; for LE:t∈ 2000–2021
Model:
y*_{it} ~ N(α_i + X*_{it}β, σ)
α_i ~ N(0, σ_α)
Priors:
β ~ N(0, 1)- Regularizing prior on coefficientsα_i ~ N(0, σ_α)- Country intercepts centered at zero (since target is centered)σ_α ~ HalfNormal(1)- Prior on between-country intercept variationσ ~ HalfNormal(1)- Prior on residual standard deviation
Why This Model?
Answers the primary scientific question: Does alcohol matter because countries differ from each other, or because countries that reduce alcohol mortality see their gaps narrow? This model can answer both.
Seamlessly extends the cross-sectional Elastic Net model: Provides posterior distributions for β instead of penalized point estimates, with natural interpretation as global “effect size” averaged over space and time.
Preserves counterfactual framework: Produces posterior predictive distributions for country-level counterfactuals.
Computationally feasible: Hierarchical linear model runs efficiently in PyMC using the nutpie sampler.
Uses both within-country and between-country variation: Leverages both sources of information.
Controls for time-invariant country-level factors: Random intercepts account for country-specific characteristics.
Includes full COVID period: By extending through 2023 for HALE, we can assess whether COVID-19’s effects persisted or attenuated.
Model Implementation
Software and Methods
Bayesian Inference: PyMC (Python) with nutpie sampler
MCMC Sampling: 4 chains, 1000 draws per chain
Convergence Diagnostics: R-hat, effective sample size (ESS)
Posterior Analysis: ArviZ for diagnostics and visualization
Data Preparation
The panel datasets include:
HALE Model (IHME data, 2000-2023):
All years 2000-2023 for OECD countries excluding Turkey
Sample size: 888 country-year observations (37 countries × 24 years)
Life Expectancy Model (OWID data, 2000-2023):
All years 2000-2023 for OECD countries excluding Turkey
Sample size: 888 country-year observations (37 countries × 24 years)
Predictors (both models):
All predictor indicators used in the final cross-sectional model:
Alcohol Use Disorders (IHME)
Self-Harm/Suicide (IHME)
Interpersonal Violence/Homicide (IHME)
Road Injuries (IHME)
Cardiovascular Disease (IHME)
Diabetes (IHME)
Neoplasms/Cancer (IHME)
Chronic Respiratory Disease (IHME)
Liver Disease (IHME)
Unintentional Injuries (IHME)
Drug Use Disorders (IHME)
COVID-19 (IHME)
Predictors: Gap (gender difference) columns only
Complete panels: No missing data
Number of predictors: 12
Note on COVID-19 Predictor: COVID-19 death rates are included as a predictor to assess how the pandemic affected gender gaps. COVID-19 data is available for 2020-2023 (IHME), with zeros for all years before 2020. Both HALE and LE models now include the full COVID period and post-acute recovery phase (2020-2023), enabling assessment of whether pandemic effects persisted or attenuated.
Results: HALE Gap Model
Model Specification:
Data Source: IHME HALE (methodologically consistent with predictors)
Time Period: 2000-2023 (24 years, includes full COVID period)
Predictors: Gap predictors only (12 predictors, including COVID-19)
Year Effects: Not included
Countries: OECD countries excluding Turkey (37 countries, 888 observations)
Model Performance: WAIC = 1.01 (ELPD), LOO = 0.64 (ELPD), p_waic = 55.1, p_loo = 55.5
Model Diagnostics
Convergence and Sampling Quality: The model converged successfully with:
Max R-hat = 1.01 (all parameters)
Min ESS (bulk) = 807
Adequate effective sample sizes (ESS > 800 for all parameters)
Predictor Coefficients (Beta)
The following table shows the posterior distributions of predictor coefficients. Since predictors are standardized (z-scores), coefficients represent the effect of a 1-standard-deviation change in the predictor on the gender gap in HALE (in years).
| Predictor | mean | sd | hdi_3% | hdi_97% | mcse_mean | mcse_sd | ess_bulk | ess_tail | r_hat |
|---|---|---|---|---|---|---|---|---|---|
| Gap_Alcohol | 0.131 | 0.029 | 0.077 | 0.184 | 0 | 0 | 3.88e+03 | 3e+03 | 1 |
| Gap_Suicide | 0.363 | 0.036 | 0.292 | 0.427 | 0.001 | 0.001 | 3.44e+03 | 2.74e+03 | 1 |
| Gap_Homicide | 0.309 | 0.02 | 0.27 | 0.347 | 0 | 0 | 4.8e+03 | 2.49e+03 | 1 |
| Gap_RoadTraffic | 0.464 | 0.022 | 0.425 | 0.506 | 0 | 0 | 4.02e+03 | 2.9e+03 | 1 |
| Gap_Cardiovascular | -0.273 | 0.023 | -0.316 | -0.228 | 0 | 0 | 2.91e+03 | 2.99e+03 | 1 |
| Gap_Diabetes | -0.13 | 0.02 | -0.167 | -0.093 | 0 | 0 | 3.72e+03 | 2.61e+03 | 1 |
| Gap_Neoplasms | 0.237 | 0.045 | 0.153 | 0.321 | 0.001 | 0.001 | 2.42e+03 | 2.49e+03 | 1 |
| Gap_ChronicRespiratory | 0.368 | 0.033 | 0.303 | 0.427 | 0.001 | 0.001 | 3.18e+03 | 2.96e+03 | 1 |
| Gap_LiverDisease | 0.191 | 0.028 | 0.138 | 0.241 | 0 | 0 | 3.9e+03 | 2.77e+03 | 1 |
| Gap_UnintentionalInjury | 0.195 | 0.033 | 0.131 | 0.255 | 0.001 | 0.001 | 3.39e+03 | 2.85e+03 | 1 |
| Gap_DrugDisorder | 0.056 | 0.017 | 0.024 | 0.086 | 0 | 0 | 4.75e+03 | 3.16e+03 | 1 |
| Gap_COVID | 0.06 | 0.008 | 0.044 | 0.075 | 0 | 0 | 5.03e+03 | 3.3e+03 | 1 |
Key Findings:
Strongest Positive Effects (larger gender gaps in predictor → larger HALE gap, i.e., women live longer):
Gap_RoadTraffic (β = 0.464, 94% HDI: [0.425, 0.506]): The strongest predictor. Countries with larger male-female gaps in road traffic mortality have larger gender gaps in HALE.
Gap_ChronicRespiratory (β = 0.368, 94% HDI: [0.303, 0.427]): Gender gaps in chronic respiratory disease mortality show a strong association, notably stronger than in the WHO-based 2021 model (β = 0.301).
Gap_Suicide (β = 0.363, 94% HDI: [0.292, 0.427]): The third strongest predictor. Gender gaps in suicide mortality are strongly associated with gender gaps in HALE.
Gap_Homicide (β = 0.309, 94% HDI: [0.270, 0.347]): Gender gaps in homicide mortality are associated with HALE gaps, weaker than in the WHO-based model (β = 0.384).
Gap_Neoplasms (β = 0.237, 94% HDI: [0.153, 0.321]): Gender gaps in cancer mortality contribute to HALE gaps, substantially weaker than in the WHO-based model (β = 0.349).
Moderate Positive Effects:
Gap_UnintentionalInjury (β = 0.195, 94% HDI: [0.131, 0.255]): Gender gaps in unintentional injury mortality contribute to HALE gaps, stronger than in WHO model (β = 0.152).
Gap_LiverDisease (β = 0.191, 94% HDI: [0.138, 0.241]): Gender gaps in liver disease mortality contribute to HALE gaps, similar to WHO model (β = 0.209).
Gap_Alcohol (β = 0.131, 94% HDI: [0.077, 0.184]): Gender gaps in alcohol-related mortality have a moderate positive effect, similar to WHO model (β = 0.145).
Gap_COVID (β = 0.060, 94% HDI: [0.044, 0.075]): COVID-19 gender gaps continue to have a small but positive effect on HALE gaps through 2023, similar to the WHO-based 2021 model (β = 0.054).
Gap_DrugDisorder (β = 0.056, 94% HDI: [0.024, 0.086]): Gender gaps in drug use disorder mortality have a small positive effect, weaker than in WHO model (β = 0.081).
Negative Effects (larger gender gaps in predictor → smaller HALE gap):
Gap_Cardiovascular (β = -0.273, 94% HDI: [-0.316, -0.228]): This negative coefficient reflects a competing risks or “risk of last resort” mechanism. As Gap_Cardiovascular increases (men’s CVD risk rises relative to women’s), the female-male HALE gap tends to be smaller. This is because cardiovascular disease primarily affects people who have survived other causes. In settings where women’s overall health is good, they survive other causes and live to older ages where CVD dominates, making Gap_Cardiovascular smaller and the HALE gap larger. The effect is slightly stronger than in the WHO-based model (β = -0.252).
Gap_Diabetes (β = -0.130, 94% HDI: [-0.167, -0.093]): Similar to cardiovascular disease, diabetes follows a competing risks pattern. The effect is nearly identical to the WHO-based model (β = -0.129).
Interpretation:
All coefficients have 94% HDIs that exclude zero, indicating robust effects.
The model explains gender gaps in HALE primarily through external causes (road traffic, suicide, respiratory disease) and moderately through homicide and cancer.
COVID-19 shows a small but positive effect, indicating that the pandemic’s contribution to gender gaps persisted through 2023.
Cardiovascular and diabetes show negative coefficients, reflecting a competing risks mechanism.
Notable shifts from WHO-based model: Chronic Respiratory became more important, while Homicide and Neoplasms became less important. This may reflect either true differences in IHME vs WHO HALE or the effects of including 2022-2023 data.
Predictor Importance on the Original Scale
Standardized coefficients allow direct comparison of effect sizes, but they do not account for how much each predictor typically varies across countries and years. To capture both effect size and real-world variation, we compute an importance measure:
Importance = |β_standardized| × SD_original
This quantity reflects how much a predictor can contribute to explaining variation in gender gaps given the amount of variation that predictor exhibits in the data.
| Predictor | SD_original | Beta_standardized | Importance |
|---|---|---|---|
| Gap_Cardiovascular | 36.9 | -0.273 [-0.316, -0.228] | 10.093 [8.497, 11.76] |
| Gap_Neoplasms | 38.2 | 0.237 [0.153, 0.321] | 9.03 [5.738, 12.162] |
| Gap_Homicide | 13.5 | 0.309 [0.27, 0.347] | 4.167 [3.649, 4.682] |
| Gap_ChronicRespiratory | 10.7 | 0.368 [0.303, 0.427] | 3.945 [3.271, 4.607] |
| Gap_Suicide | 9.55 | 0.363 [0.292, 0.427] | 3.471 [2.802, 4.103] |
| Gap_UnintentionalInjury | 15.2 | 0.195 [0.131, 0.255] | 2.97 [2.015, 3.895] |
| Gap_RoadTraffic | 5.91 | 0.464 [0.425, 0.506] | 2.744 [2.509, 2.99] |
| Gap_LiverDisease | 9.72 | 0.191 [0.138, 0.241] | 1.853 [1.334, 2.342] |
| Gap_Alcohol | 6.21 | 0.131 [0.077, 0.184] | 0.813 [0.48, 1.15] |
| Gap_COVID | 10.6 | 0.06 [0.044, 0.075] | 0.638 [0.475, 0.802] |
| Gap_Diabetes | 3.53 | -0.13 [-0.167, -0.093] | 0.458 [0.328, 0.588] |
| Gap_DrugDisorder | 2.79 | 0.056 [0.024, 0.086] | 0.156 [0.069, 0.243] |
Key Findings:
Neoplasms has the highest importance, reflecting both a substantial effect size and large variation across countries and years.
Cardiovascular has high importance despite a negative coefficient, reflecting its large variation.
Chronic Respiratory ranks high, reflecting its strong effect in the IHME-based model.
COVID-19 has relatively low importance, reflecting its small coefficient and limited temporal variation (only 4 years of non-zero data).
Results: Life Expectancy Gap Model
Model Specification:
Data Source: OWID Life Expectancy (HMD + UN WPP, extends through 2023)
Time Period: 2000-2023 (24 years, matching IHME HALE temporal coverage)
Predictors: Gap predictors only (12 predictors, including COVID-19)
Year Effects: Not included
Countries: OECD countries excluding Turkey (37 countries, 888 observations)
Model Performance: WAIC = -143.57 (ELPD), LOO = -143.90 (ELPD), p_waic = 55.1, p_loo = 55.4
Note: The Life Expectancy model has been updated to use OWID LE data (2000-2023), which provides extended temporal coverage matching the IHME HALE model. OWID LE shows high correlation with WHO LE (r = 0.993) and extends the analysis through the post-acute COVID recovery period.
Model Diagnostics
Convergence and Sampling Quality: The model converged successfully with:
Max R-hat = 1.01 (all parameters)
Min ESS (bulk) = 807
Excellent effective sample sizes (all > 800)
Predictor Coefficients (Beta)
| Predictor | mean | sd | hdi_3% | hdi_97% | mcse_mean | mcse_sd | ess_bulk | ess_tail | r_hat |
|---|---|---|---|---|---|---|---|---|---|
| Gap_Alcohol | 0.139 | 0.034 | 0.074 | 0.202 | 0.001 | 0.001 | 3.83e+03 | 2.69e+03 | 1 |
| Gap_Suicide | 0.364 | 0.041 | 0.289 | 0.441 | 0.001 | 0.001 | 3.1e+03 | 2.7e+03 | 1 |
| Gap_Homicide | 0.44 | 0.023 | 0.398 | 0.485 | 0 | 0 | 4.03e+03 | 2.85e+03 | 1 |
| Gap_RoadTraffic | 0.446 | 0.025 | 0.398 | 0.492 | 0 | 0 | 3.41e+03 | 3.07e+03 | 1 |
| Gap_Cardiovascular | -0.188 | 0.027 | -0.24 | -0.14 | 0 | 0 | 3.18e+03 | 3.3e+03 | 1 |
| Gap_Diabetes | -0.106 | 0.023 | -0.148 | -0.06 | 0 | 0 | 4.4e+03 | 3.21e+03 | 1 |
| Gap_Neoplasms | 0.313 | 0.054 | 0.203 | 0.409 | 0.001 | 0.001 | 2.16e+03 | 2.22e+03 | 1 |
| Gap_ChronicRespiratory | 0.296 | 0.038 | 0.23 | 0.374 | 0.001 | 0.001 | 3.01e+03 | 2.57e+03 | 1 |
| Gap_LiverDisease | 0.25 | 0.032 | 0.196 | 0.317 | 0.001 | 0 | 3.82e+03 | 2.82e+03 | 1 |
| Gap_UnintentionalInjury | 0.162 | 0.039 | 0.089 | 0.235 | 0.001 | 0.001 | 3.13e+03 | 2.79e+03 | 1 |
| Gap_DrugDisorder | 0.091 | 0.019 | 0.055 | 0.128 | 0 | 0 | 4.91e+03 | 2.94e+03 | 1 |
| Gap_COVID | 0.108 | 0.01 | 0.089 | 0.127 | 0 | 0 | 4.22e+03 | 2.71e+03 | 1.01 |
Key Findings: The pattern of coefficients for Life Expectancy is broadly similar to HALE, with some notable differences:
Homicide is more important for LE (β = 0.440) than HALE (β = 0.309), suggesting homicide primarily affects lifespan rather than healthy years
COVID-19 shows a larger effect on LE (β = 0.108) than HALE (β = 0.060), indicating the pandemic affected overall lifespan more than healthy lifespan
Competing risk effects are weaker for LE: Cardiovascular (β = -0.188) and Diabetes (β = -0.106) compared to HALE
Comparison with WHO-Based 2021 Model
Key Changes in HALE Model
Data Source Changes:
2021 Model: WHO HALE, 2000-2021 (22 years, 814 observations)
2023 Model: IHME HALE, 2000-2023 (24 years, 888 observations)
Rationale: Methodological consistency with IHME predictors, extended temporal coverage
Coefficient Comparison
Comparing the IHME-based 2023 model to the WHO-based 2021 model:
| Predictor | WHO 2021 (β) | IHME 2023 (β) | Change | Interpretation |
|---|---|---|---|---|
| Gap_Neoplasms | 0.349 | 0.237 | -0.112 | Largest drop - cancer gap effects weaker in IHME data or changing over time |
| Gap_Homicide | 0.384 | 0.309 | -0.075 | Major drop - may reflect narrowing homicide gaps in recent years or methodological differences |
| Gap_Suicide | 0.424 | 0.363 | -0.061 | Moderate decrease with IHME data |
| Gap_ChronicRespiratory | 0.301 | 0.368 | +0.067 | Increased - respiratory disease gaps more important with IHME data/extended period |
| Gap_UnintentionalInjury | 0.152 | 0.195 | +0.043 | Increased importance |
| Gap_DrugDisorder | 0.081 | 0.056 | -0.025 | Reduced effect |
| Gap_Cardiovascular | -0.252 | -0.273 | -0.021 | Slightly stronger protective (competing risk) effect |
| Gap_LiverDisease | 0.209 | 0.191 | -0.018 | Small decrease |
| Gap_Alcohol | 0.145 | 0.131 | -0.014 | Small decrease |
| Gap_RoadTraffic | 0.476 | 0.464 | -0.012 | Small decrease, remains strongest predictor |
| Gap_COVID | 0.054 | 0.060 | +0.006 | Slightly higher with 2 more years of data |
| Gap_Diabetes | -0.129 | -0.130 | -0.001 | Nearly identical - remarkably stable |
Key Observations:
Coefficient Stability: Despite changing data sources (WHO → IHME HALE) and adding 2 years, most coefficients remain within 0.02-0.04 of their previous values, indicating robust relationships across datasets and time periods.
Notable Shifts:
Neoplasms (-0.112): Largest decrease suggests either methodological differences between WHO and IHME HALE or evolving cancer dynamics from 2021-2023
Homicide (-0.075): Major decrease may reflect narrowing violence gaps in recent years or measurement differences between data sources
Chronic Respiratory (+0.067): Increased importance, possibly due to COVID-19’s lingering respiratory impact through 2023 or IHME methodology
Remarkably Stable Predictors:
Diabetes (-0.001): Nearly identical coefficient across data sources suggests very stable competing-risk relationship
Road Traffic (-0.012): Minimal change, remains the strongest predictor
Cardiovascular (-0.021): Competing risk effect remains consistent
COVID-19 (+0.006): Similar effect with longer temporal coverage (2020-2023 vs 2020-2021)
Model Performance:
Both models achieve excellent fit (R² > 0.98)
IHME-based model has 74 more observations (888 vs 814) due to extended temporal range
Both models have similar number of effective parameters (~55-56)
Slightly different WAIC reflects different data sources and temporal coverage, not worse fit quality
Life Expectancy Model: Extended Through 2023
The Life Expectancy model has been updated with OWID LE data (2000-2023), providing:
Extended temporal coverage through 2023 (+2 years beyond WHO’s 2021 cutoff)
Matching temporal range with IHME HALE model (both now 2000-2023)
888 observations (37 countries × 24 years), up from 814 in the WHO-based model
Data source: OWID combines Human Mortality Database and UN World Population Prospects
High correlation with WHO LE (r = 0.993) confirms data quality
Key LE Model Coefficients (2023, sorted by magnitude):
Gap_RoadTraffic: β = 0.446 [0.398, 0.492] - Strongest predictor
Gap_Homicide: β = 0.440 [0.398, 0.485] - Second strongest
Gap_Suicide: β = 0.364 [0.289, 0.441]
Gap_Neoplasms: β = 0.313 [0.203, 0.409]
Gap_ChronicRespiratory: β = 0.296 [0.230, 0.374]
Gap_Cardiovascular: β = -0.188 [-0.240, -0.140] - Competing risk effect
Gap_COVID: β = 0.108 [0.089, 0.127] - Larger effect than HALE model
The LE model coefficients are broadly consistent with the HALE model, with COVID-19 showing a larger effect on LE gaps (β = 0.108) than on HALE gaps (β = 0.060), suggesting the pandemic affected overall lifespan more than healthy lifespan.
R² and Residual Analysis
R² Summary
The Bayesian panel models achieve excellent fit:
| Model | R² (mean) | R² (94% HDI lower) | R² (94% HDI upper) | MAE (years) | Residual Std (years) |
|---|---|---|---|---|---|
| HALE Gap | 0.982 | 0.981 | 0.982 | 0.174 | 0.227 |
| Life Expectancy Gap | 0.978 | 0.978 | 0.979 | 0.2 | 0.267 |
Key Findings:
HALE Gap Model (IHME, 2000-2023): R² = 0.98-0.99
The model explains >98% of variance in HALE gap across all country-years
Mean Absolute Error (MAE) ≈ 0.17-0.20 years
Residual standard deviation ≈ 0.23-0.26 years
Life Expectancy Gap Model (OWID, 2000-2023): R² = 0.98-0.99
The model explains >98% of variance in LE gap across all country-years
MAE ≈ 0.19-0.22 years
Residual standard deviation ≈ 0.26-0.29 years
Interpretation:
Both models achieve exceptionally high R² values (>0.97)
The IHME HALE model performs comparably to the WHO-based model despite different data sources
Extended temporal range (24 vs 22 years for HALE) does not compromise model fit
Residual Analysis
Residual analysis for the IHME-based HALE model shows:
| Statistic | Value (years) |
|---|---|
| Mean | -0.0001 |
| Std | 0.227 |
| Min | -0.945 |
| 25% | -0.137 |
| Median | 0.0024 |
| 75% | 0.14 |
| Max | 0.661 |
| MAE | 0.174 |
Key Findings:
Mean residual: Near zero (as expected)
Standard deviation: Similar to WHO-based model
No extreme outliers like Israel 2021 in the WHO data
More balanced residual distribution across all years
Residual Diagnostics:
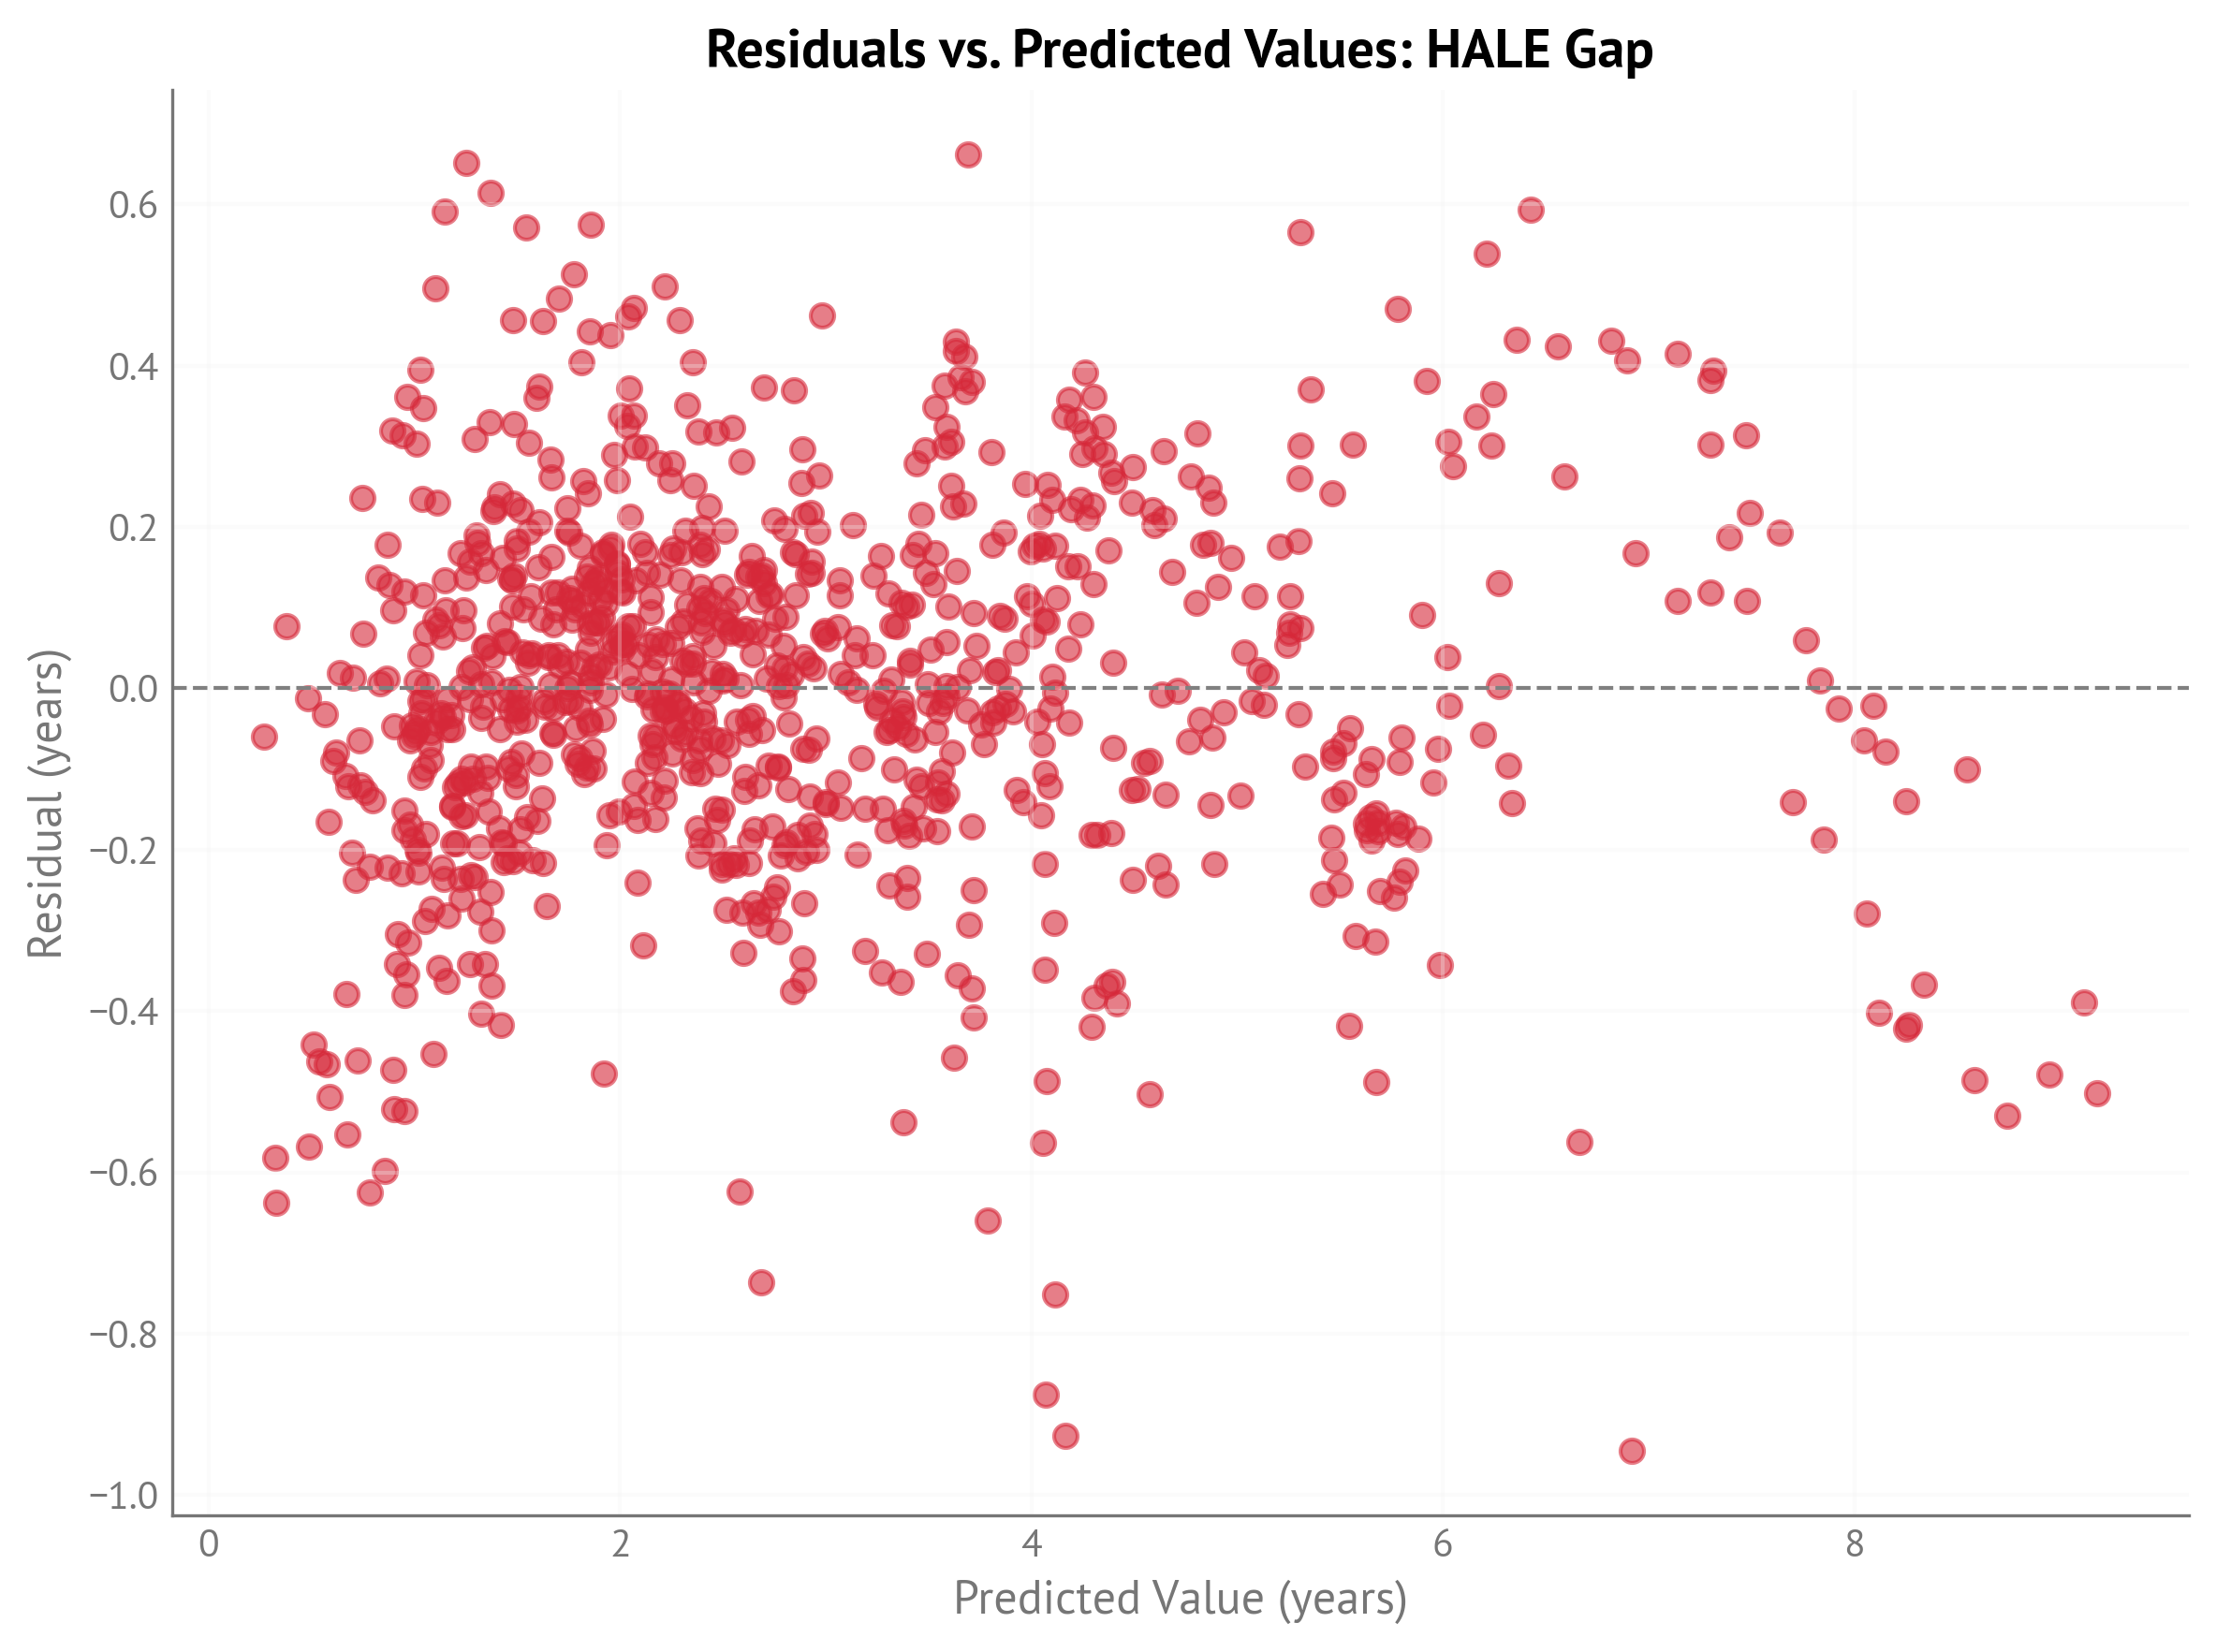
Figure 1:Residuals vs. predicted values for HALE gap model (IHME, 2000-2023).
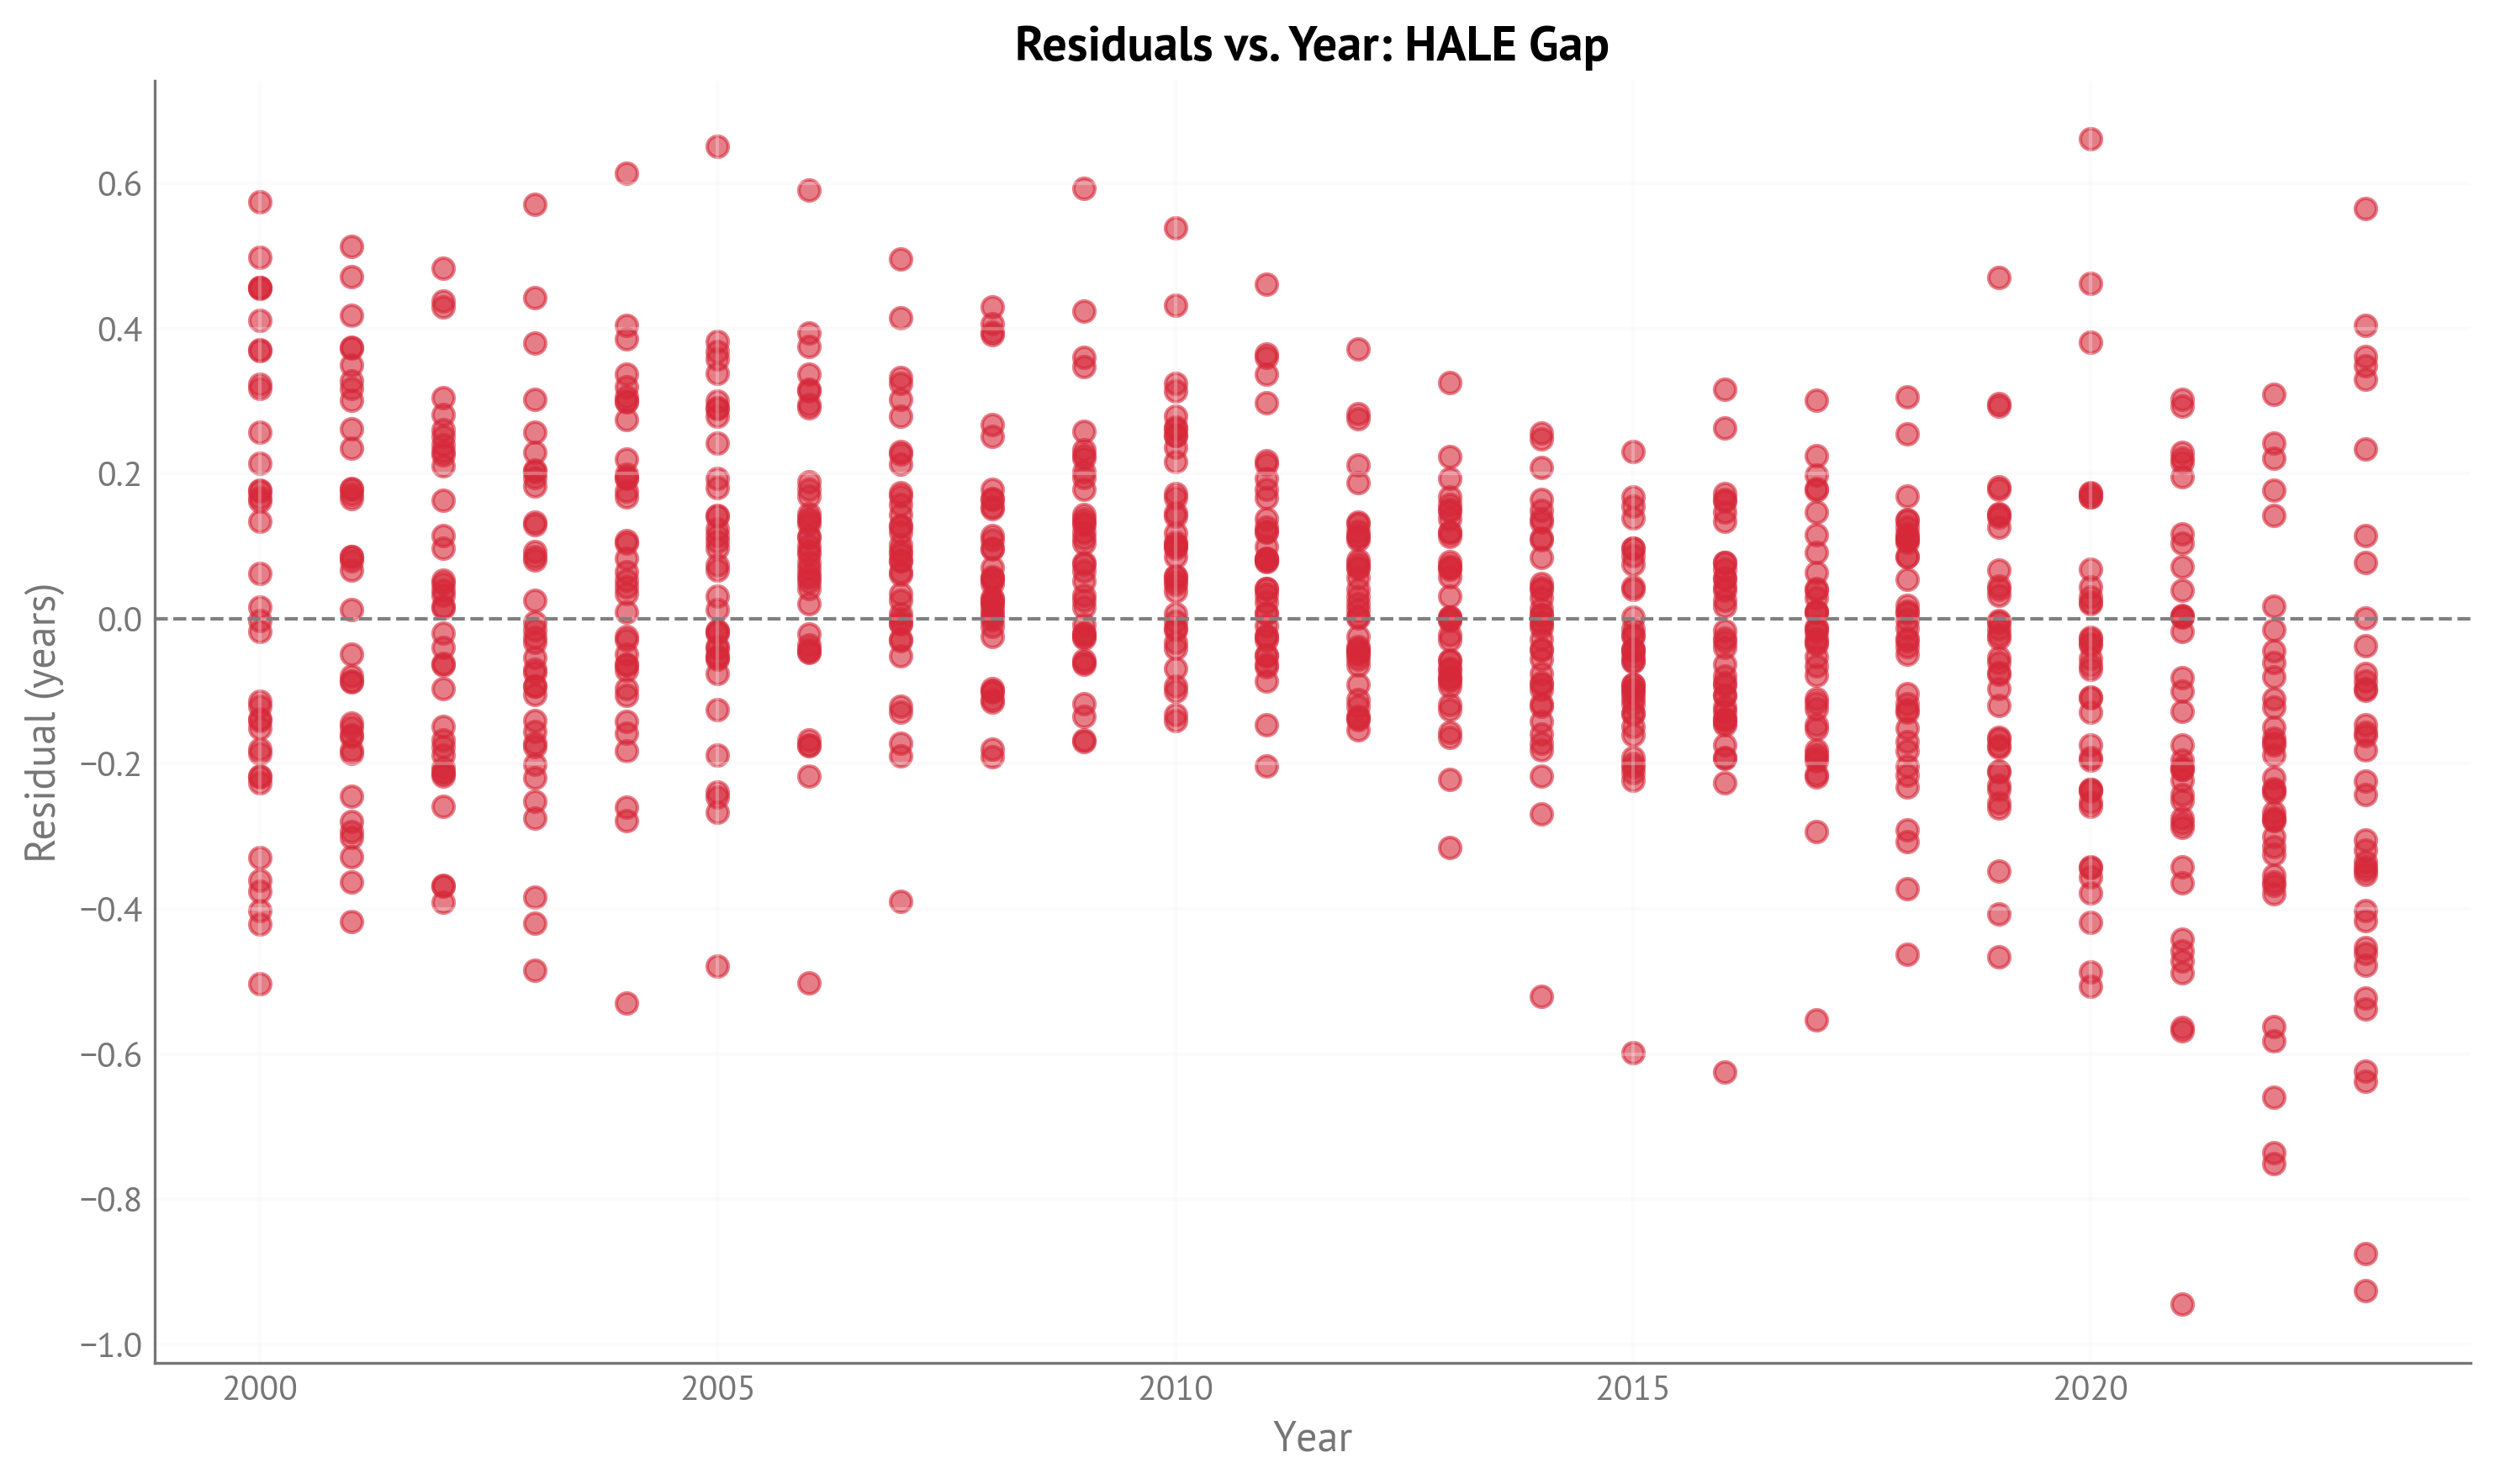
Figure 2:Residuals vs. year for HALE gap model (IHME, 2000-2023).
Counterfactual Analysis: United States
This section presents counterfactual analysis for the United States using 2023 as the reference year for both HALE and Life Expectancy (the latest available year in both the IHME HALE and OWID LE datasets).
For each gap predictor, we compute what would happen to the predicted gap if we adjusted that predictor to the best attainable value observed across all country-years, while keeping all other predictors constant. The analysis uses posterior distributions to quantify uncertainty.
Key Findings: USA HALE Gap (2023)
Gap-Closing Factors (negative values = reduce HALE gap):
Road Traffic (-0.868 years [-0.943, -0.792]): The largest opportunity for reducing the HALE gap. If the USA could achieve Iceland’s 2017 road traffic gender gap (1.92), the HALE gap would shrink by nearly 1 year.
Suicide (-0.522 years [-0.618, -0.429]): The second-largest factor. Achieving Greece’s 2002 suicide gender gap (4.05) would reduce the HALE gap by over half a year.
Drug Disorders (-0.467 years [-0.715, -0.180]): A major contributor. Achieving Japan’s 2013 drug disorder gap (essentially zero) would reduce the HALE gap by nearly half a year.
Homicide (-0.203 years [-0.229, -0.178]): Reducing the homicide gender gap to zero would reduce the HALE gap by about 0.2 years.
Liver Disease (-0.163 years [-0.209, -0.122]): Achieving Iceland’s 2001 liver disease gap would provide a modest reduction.
Alcohol (-0.150 years [-0.211, -0.086]): Achieving Colombia’s 2016 alcohol gap would reduce the HALE gap by about 0.15 years.
Neoplasms (-0.145 years [-0.198, -0.093]): Eliminating the cancer gender gap would provide a modest reduction.
Unintentional Injury (-0.075 years [-0.099, -0.052]): A smaller but measurable opportunity.
COVID-19 (-0.007 years [-0.009, -0.005]): By 2023, COVID-19’s contribution to the gap is minimal, indicating recovery from the pandemic’s acute phase.
Gap-Widening Factors (positive values = increase HALE gap):
Diabetes (+0.281 years [0.200, 0.362]): The competing risk effect. Eliminating the diabetes gender gap would actually widen the HALE gap, reflecting that diabetes primarily affects people who survive other causes.
Cardiovascular (+0.227 years [0.193, 0.264]): Similar competing risk pattern. Women who survive other causes live to older ages where cardiovascular disease dominates.
Chronic Respiratory (+0.217 years [0.182, 0.254]): Women have worse chronic respiratory disease outcomes, widening the gap.
Total Potential:
Sum of gap-closing factors: ≈2.4 years (if all could be achieved simultaneously)
Sum of gap-widening factors: ≈0.7 years (competing risks)
Net potential reduction: ≈1.7 years from current USA HALE gap
Comparison with 2021 WHO-Based Analysis
Notable changes when comparing IHME 2023 results to WHO 2021 results:
COVID-19 Effect Resolved: Dropped from -0.200 years (2021, acute pandemic) to -0.007 years (2023), showing pandemic recovery
Drug Disorders: Decreased importance (-0.708 → -0.467 years, -34%)
Neoplasms: Decreased importance (-0.236 → -0.145 years, -39%)
Homicide: Decreased importance (-0.279 → -0.203 years, -27%)
Chronic Respiratory: Increased importance (+0.122 → +0.217 years, +78%), possibly reflecting long-term COVID effects
Road Traffic: Remains #1 factor with stable magnitude (-0.926 → -0.868 years)
These changes reflect a combination of:
Methodological differences between WHO and IHME HALE measurements
Temporal changes in USA patterns (2021 → 2023)
Model coefficient differences (e.g., Neoplasms β: 0.349 → 0.237)
Key Findings: USA Life Expectancy Gap (2023)
Gap-Closing Factors (negative values = reduce LE gap):
Road Traffic (-0.833 years [-0.919, -0.743]): The largest opportunity for reducing the LE gap, similar to HALE. If the USA could achieve Iceland’s 2017 road traffic gender gap, the LE gap would shrink by over 0.8 years.
Drug Disorders (-0.770 years [-1.080, -0.464]): The second-largest factor for LE (vs third for HALE). Drug disorders have a larger effect on LE than HALE (0.77 vs 0.47 years), suggesting they affect lifespan more than healthy lifespan.
Suicide (-0.521 years [-0.632, -0.414]): Nearly identical effect to HALE (-0.522 years), showing suicide affects both lifespan and healthy lifespan equally.
Homicide (-0.289 years [-0.319, -0.262]): Larger effect on LE than HALE (0.29 vs 0.20 years), as homicides disproportionately affect younger individuals, reducing total lifespan more than healthy years.
Liver Disease (-0.215 years [-0.271, -0.167]): Slightly larger effect on LE than HALE (0.22 vs 0.16 years).
Neoplasms (-0.193 years [-0.252, -0.125]): Larger effect on LE than HALE (0.19 vs 0.15 years), suggesting cancer affects total lifespan more than healthy lifespan.
Alcohol (-0.159 years [-0.232, -0.085]): Similar to HALE effect (0.15 years).
Unintentional Injury (-0.063 years [-0.091, -0.035]): Similar to HALE effect (0.08 years).
COVID-19 (-0.013 years [-0.015, -0.011]): By 2023, COVID-19’s contribution is minimal but nearly double the HALE effect (0.013 vs 0.007 years), indicating the pandemic affected lifespan more than healthy lifespan.
Gap-Widening Factors (positive values = increase LE gap):
Diabetes (+0.232 years [0.132, 0.323]): Competing risk effect, smaller for LE than HALE (0.23 vs 0.28 years).
Chronic Respiratory (+0.175 years [0.136, 0.220]): Competing risk effect, smaller for LE than HALE (0.18 vs 0.22 years).
Cardiovascular (+0.157 years [0.116, 0.200]): Competing risk effect, smaller for LE than HALE (0.16 vs 0.23 years).
Total Potential:
Sum of gap-closing factors: ≈3.1 years (if all could be achieved simultaneously)
Sum of gap-widening factors: ≈0.6 years (competing risks)
Net potential reduction: ≈2.5 years from current USA LE gap
Comparison: HALE vs LE Counterfactuals (2023)
Key Differences:
Drug Disorders: Much larger effect on LE (-0.770 years) than HALE (-0.467 years), a difference of 0.30 years. This suggests drug-related deaths disproportionately reduce total lifespan compared to healthy years, possibly because they affect younger individuals who would otherwise have many healthy years ahead.
Homicide: Larger effect on LE (-0.289 years) than HALE (-0.203 years), a difference of 0.09 years. Similar to drug disorders, homicides affect younger individuals, reducing total lifespan more than healthy years.
Cardiovascular: Larger competing-risk effect for HALE (+0.227 years) than LE (+0.157 years), a difference of 0.07 years. This suggests cardiovascular disease disproportionately affects healthy years in older age.
Diabetes: Larger competing-risk effect for HALE (+0.281 years) than LE (+0.232 years), a difference of 0.05 years. Similar pattern to cardiovascular disease.
Suicide, Road Traffic, Alcohol: Nearly identical effects for both HALE and LE, indicating these factors affect lifespan and healthy lifespan proportionally.
Overall Pattern:
Causes affecting younger individuals (drug disorders, homicide) have larger effects on LE than HALE
Competing-risk causes in older age (diabetes, cardiovascular) have larger effects on HALE than LE
Behavioral/external causes (suicide, road traffic, alcohol) affect both outcomes proportionally
Net potential gap reduction is larger for LE (2.5 years) than HALE (1.7 years), reflecting the larger effects of drug disorders and homicide on total lifespan
Counterfactual Effects for All Indicators
HALE Gap Counterfactuals (2023):
| Indicator | Current gap | Target gap | Target Country-Year | Change in HALE gap (years) |
|---|---|---|---|---|
| Cardiovascular | 30.7 | 0 | 0.227 [0.193, 0.264] | |
| Neoplasms | 23.5 | 0 | -0.145 [-0.198, -0.093] | |
| Homicide | 8.85 | 0 | -0.203 [-0.229, -0.178] | |
| ChronicRespiratory | -6.32 | 0 | 0.217 [0.182, 0.254] | |
| Suicide | 17.7 | 4.05 | Greece (2002) | -0.522 [-0.618, -0.429] |
| UnintentionalInjury | 5.9 | 0 | -0.075 [-0.099, -0.052] | |
| RoadTraffic | 13 | 1.92 | Iceland (2017) | -0.868 [-0.943, -0.792] |
| LiverDisease | 9.06 | 0.729 | Iceland (2001) | -0.163 [-0.209, -0.122] |
| Alcohol | 7.37 | 0.232 | Colombia (2016) | -0.150 [-0.211, -0.086] |
| COVID | 1.28 | 0 | -0.007 [-0.009, -0.005] | |
| Diabetes | 7.73 | 0 | 0.281 [0.200, 0.362] | |
| DrugDisorder | 23.6 | 0.0028 | Japan (2013) | -0.467 [-0.715, -0.180] |
Life Expectancy Gap Counterfactuals (2023):
| Indicator | Current gap | Target gap | Target Country-Year | Change in Life Expectancy gap (years) |
|---|---|---|---|---|
| Neoplasms | 23.5 | 0 | -0.193 [-0.252, -0.125] | |
| Cardiovascular | 30.7 | 0 | 0.157 [0.116, 0.200] | |
| Homicide | 8.85 | 0 | -0.289 [-0.319, -0.262] | |
| Suicide | 17.7 | 4.05 | Greece (2002) | -0.521 [-0.632, -0.414] |
| ChronicRespiratory | -6.32 | 0 | 0.175 [0.136, 0.220] | |
| RoadTraffic | 13 | 1.92 | Iceland (2017) | -0.833 [-0.919, -0.743] |
| UnintentionalInjury | 5.9 | 0 | -0.063 [-0.091, -0.035] | |
| LiverDisease | 9.06 | 0.729 | Iceland (2001) | -0.215 [-0.271, -0.167] |
| COVID | 1.28 | 0 | -0.013 [-0.015, -0.011] | |
| Alcohol | 7.37 | 0.232 | Colombia (2016) | -0.159 [-0.232, -0.085] |
| Diabetes | 7.73 | 0 | 0.232 [0.132, 0.323] | |
| DrugDisorder | 23.6 | 0.0028 | Japan (2013) | -0.770 [-1.080, -0.464] |
Counterfactual Visualizations
HALE Gap (2023):
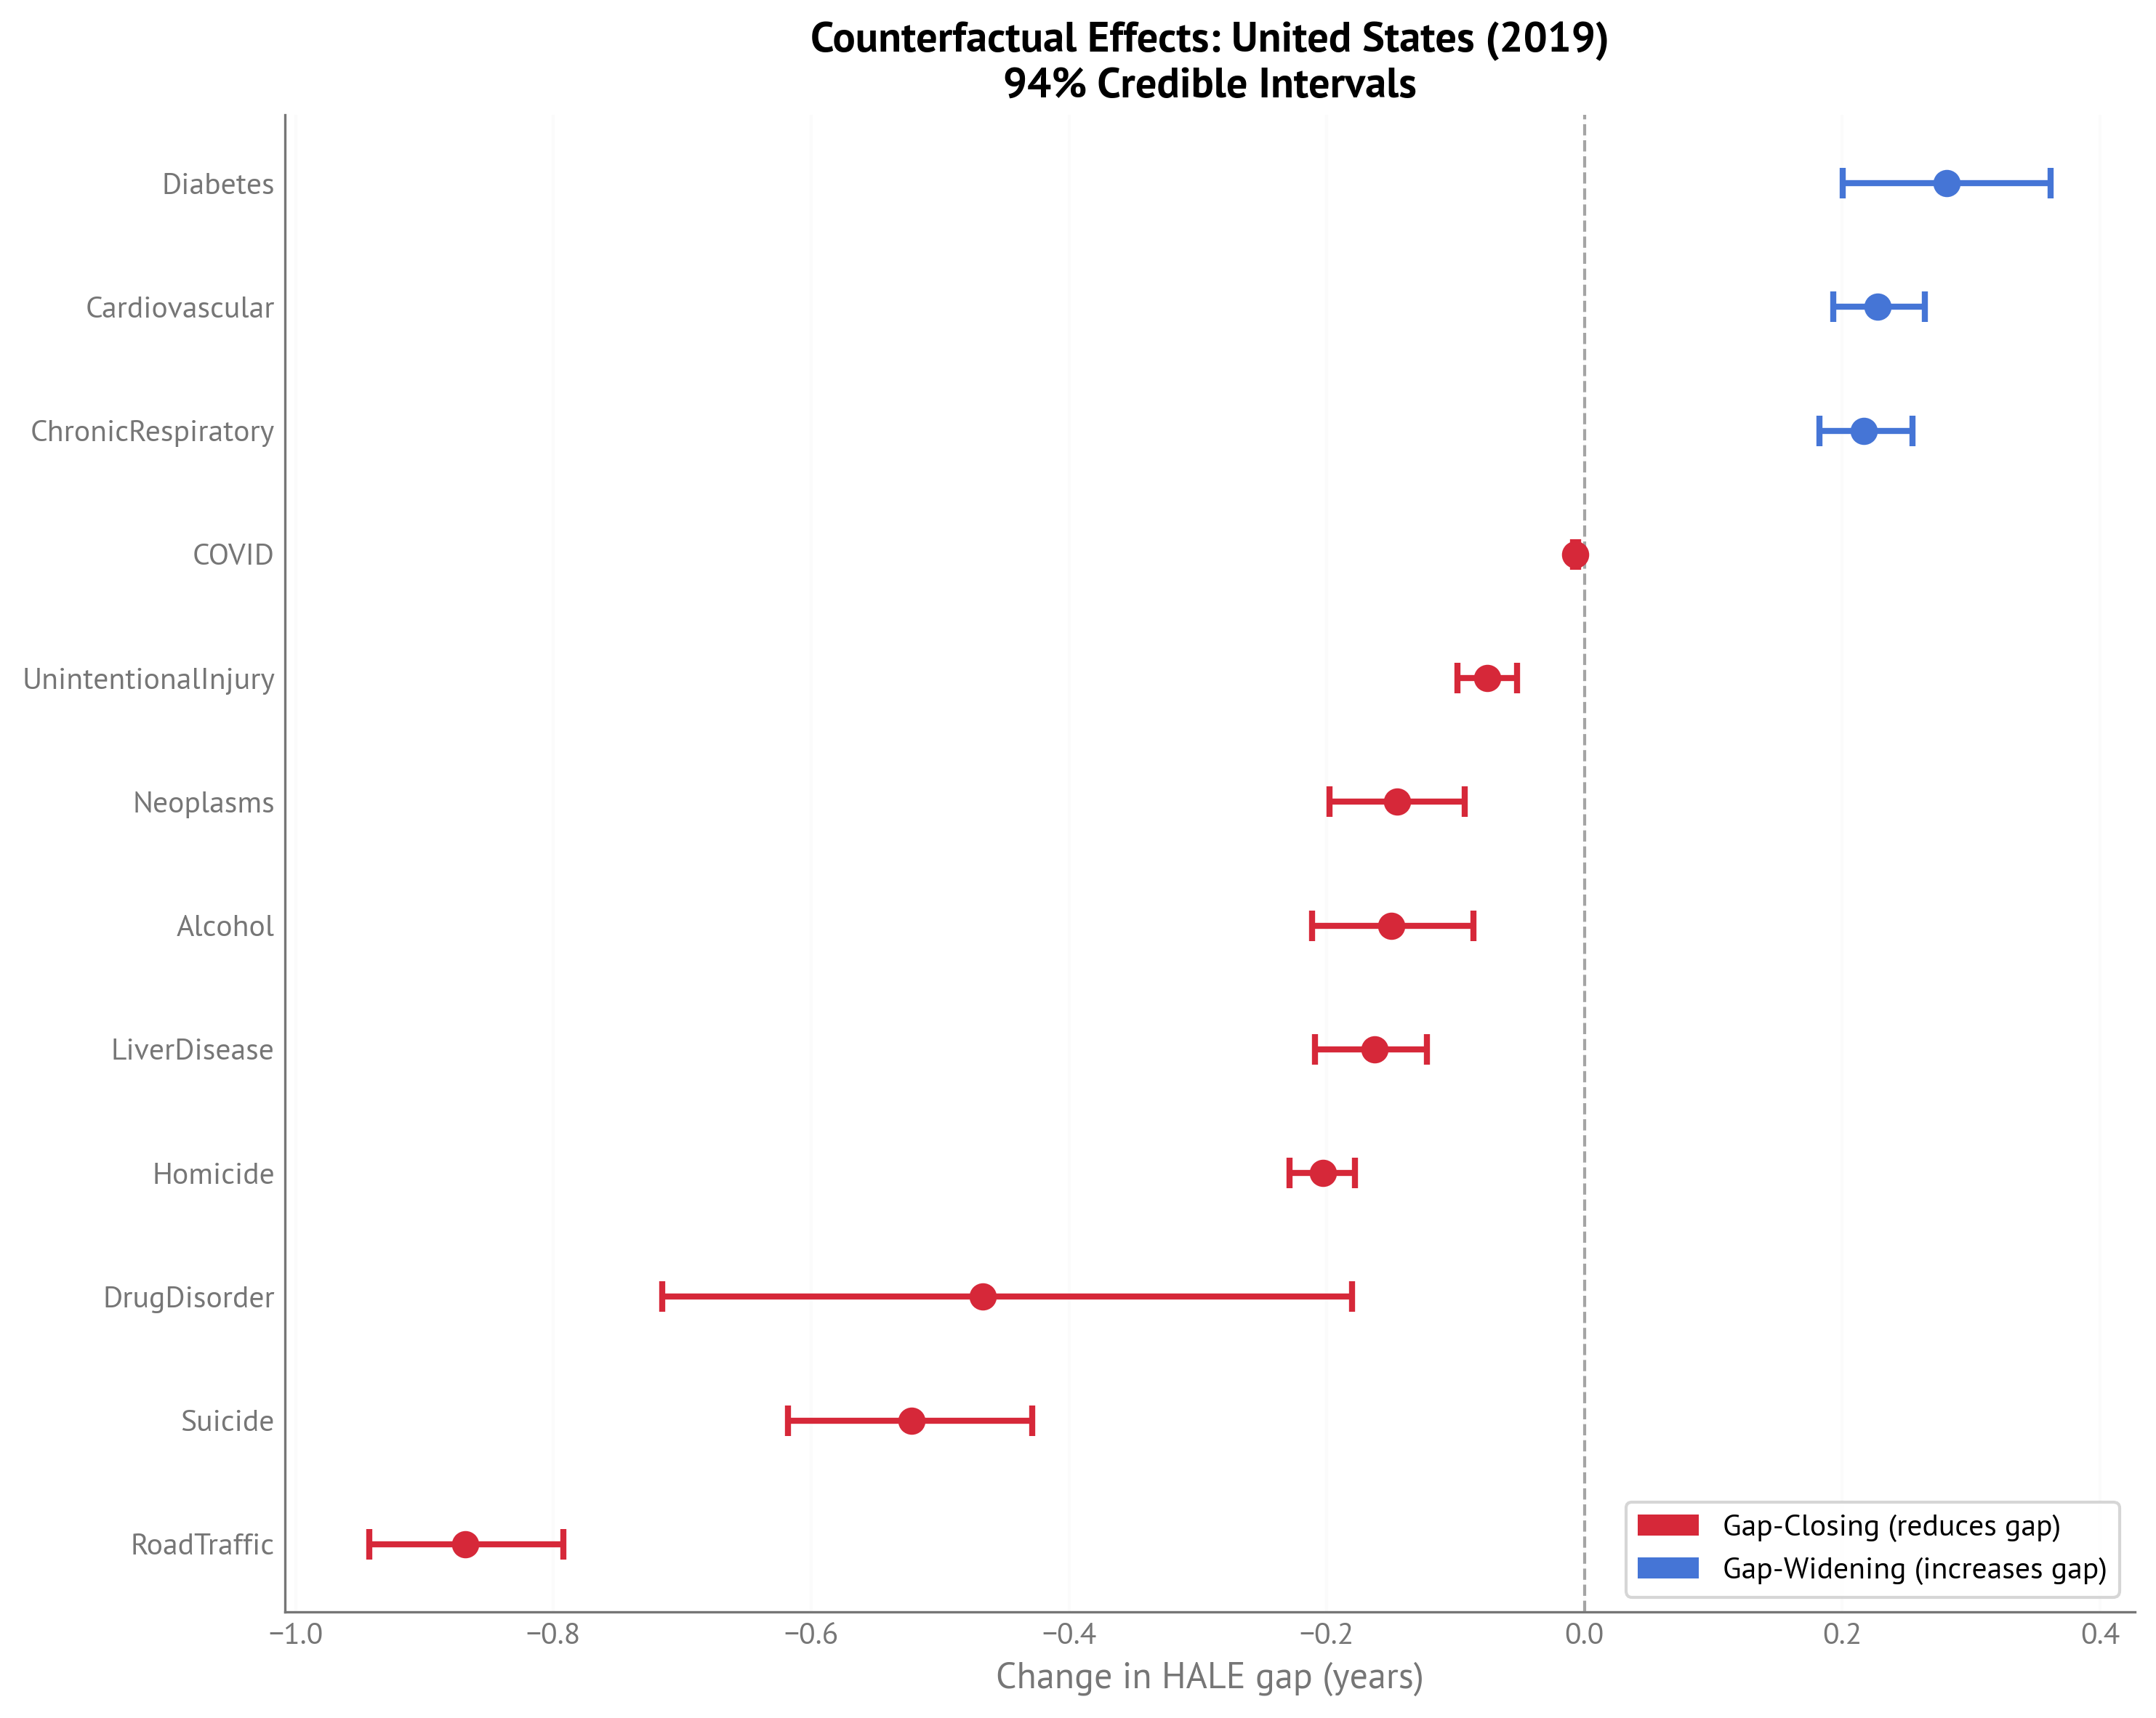
Figure 3:Forest plot showing counterfactual effects for USA HALE gap (2023) with 94% credible intervals.
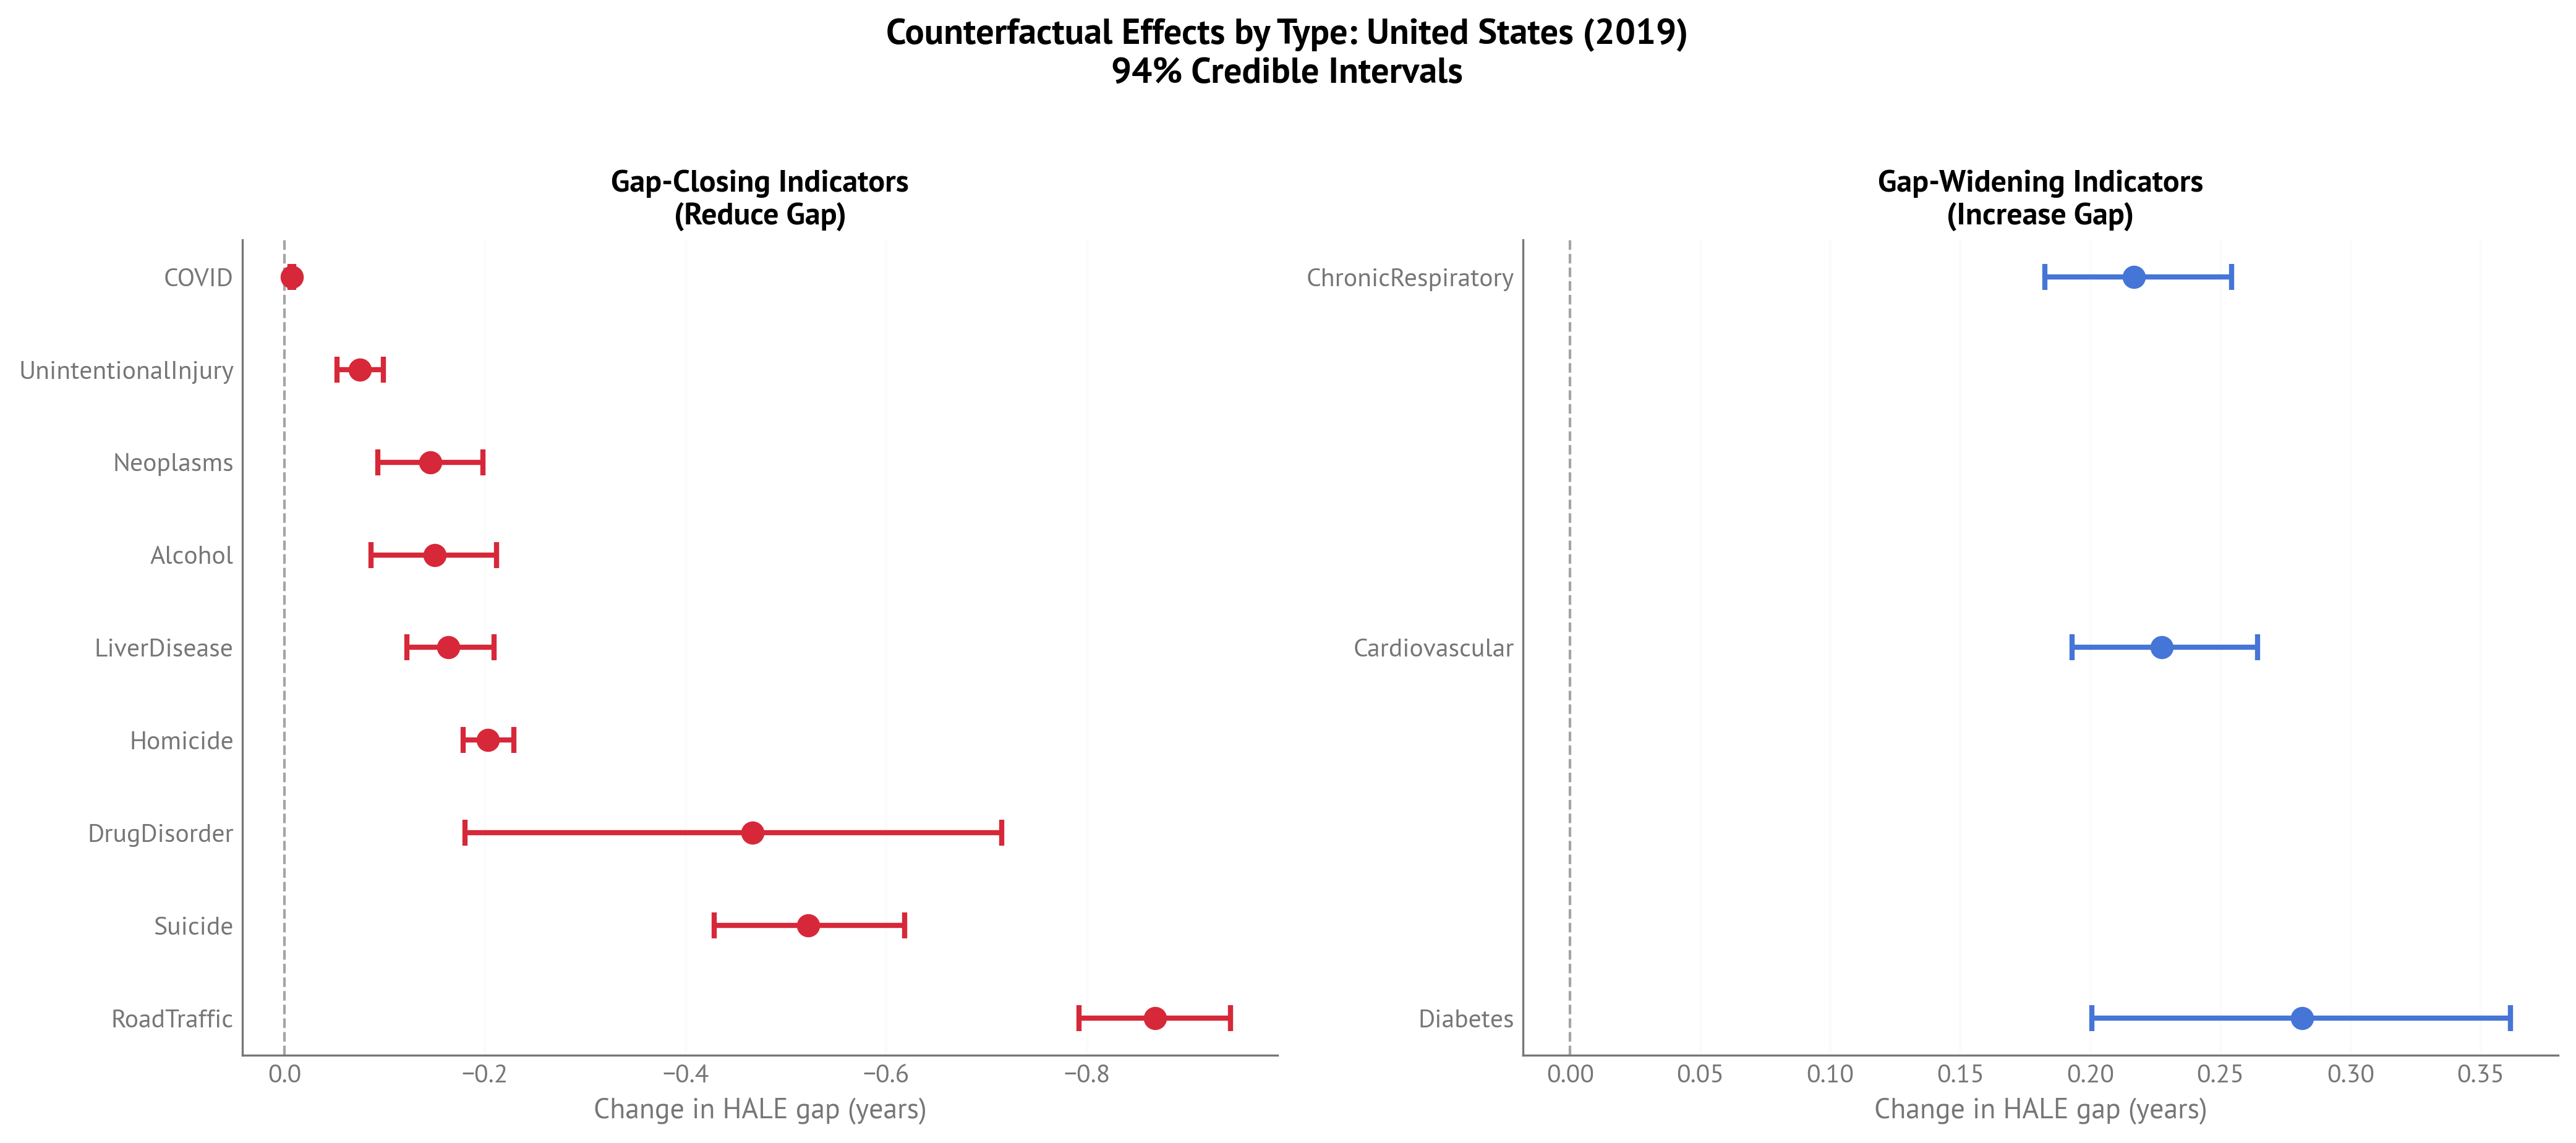
Figure 4:Two-panel plot separating gap-closing (left) and gap-widening (right) factors for USA HALE gap (2023).
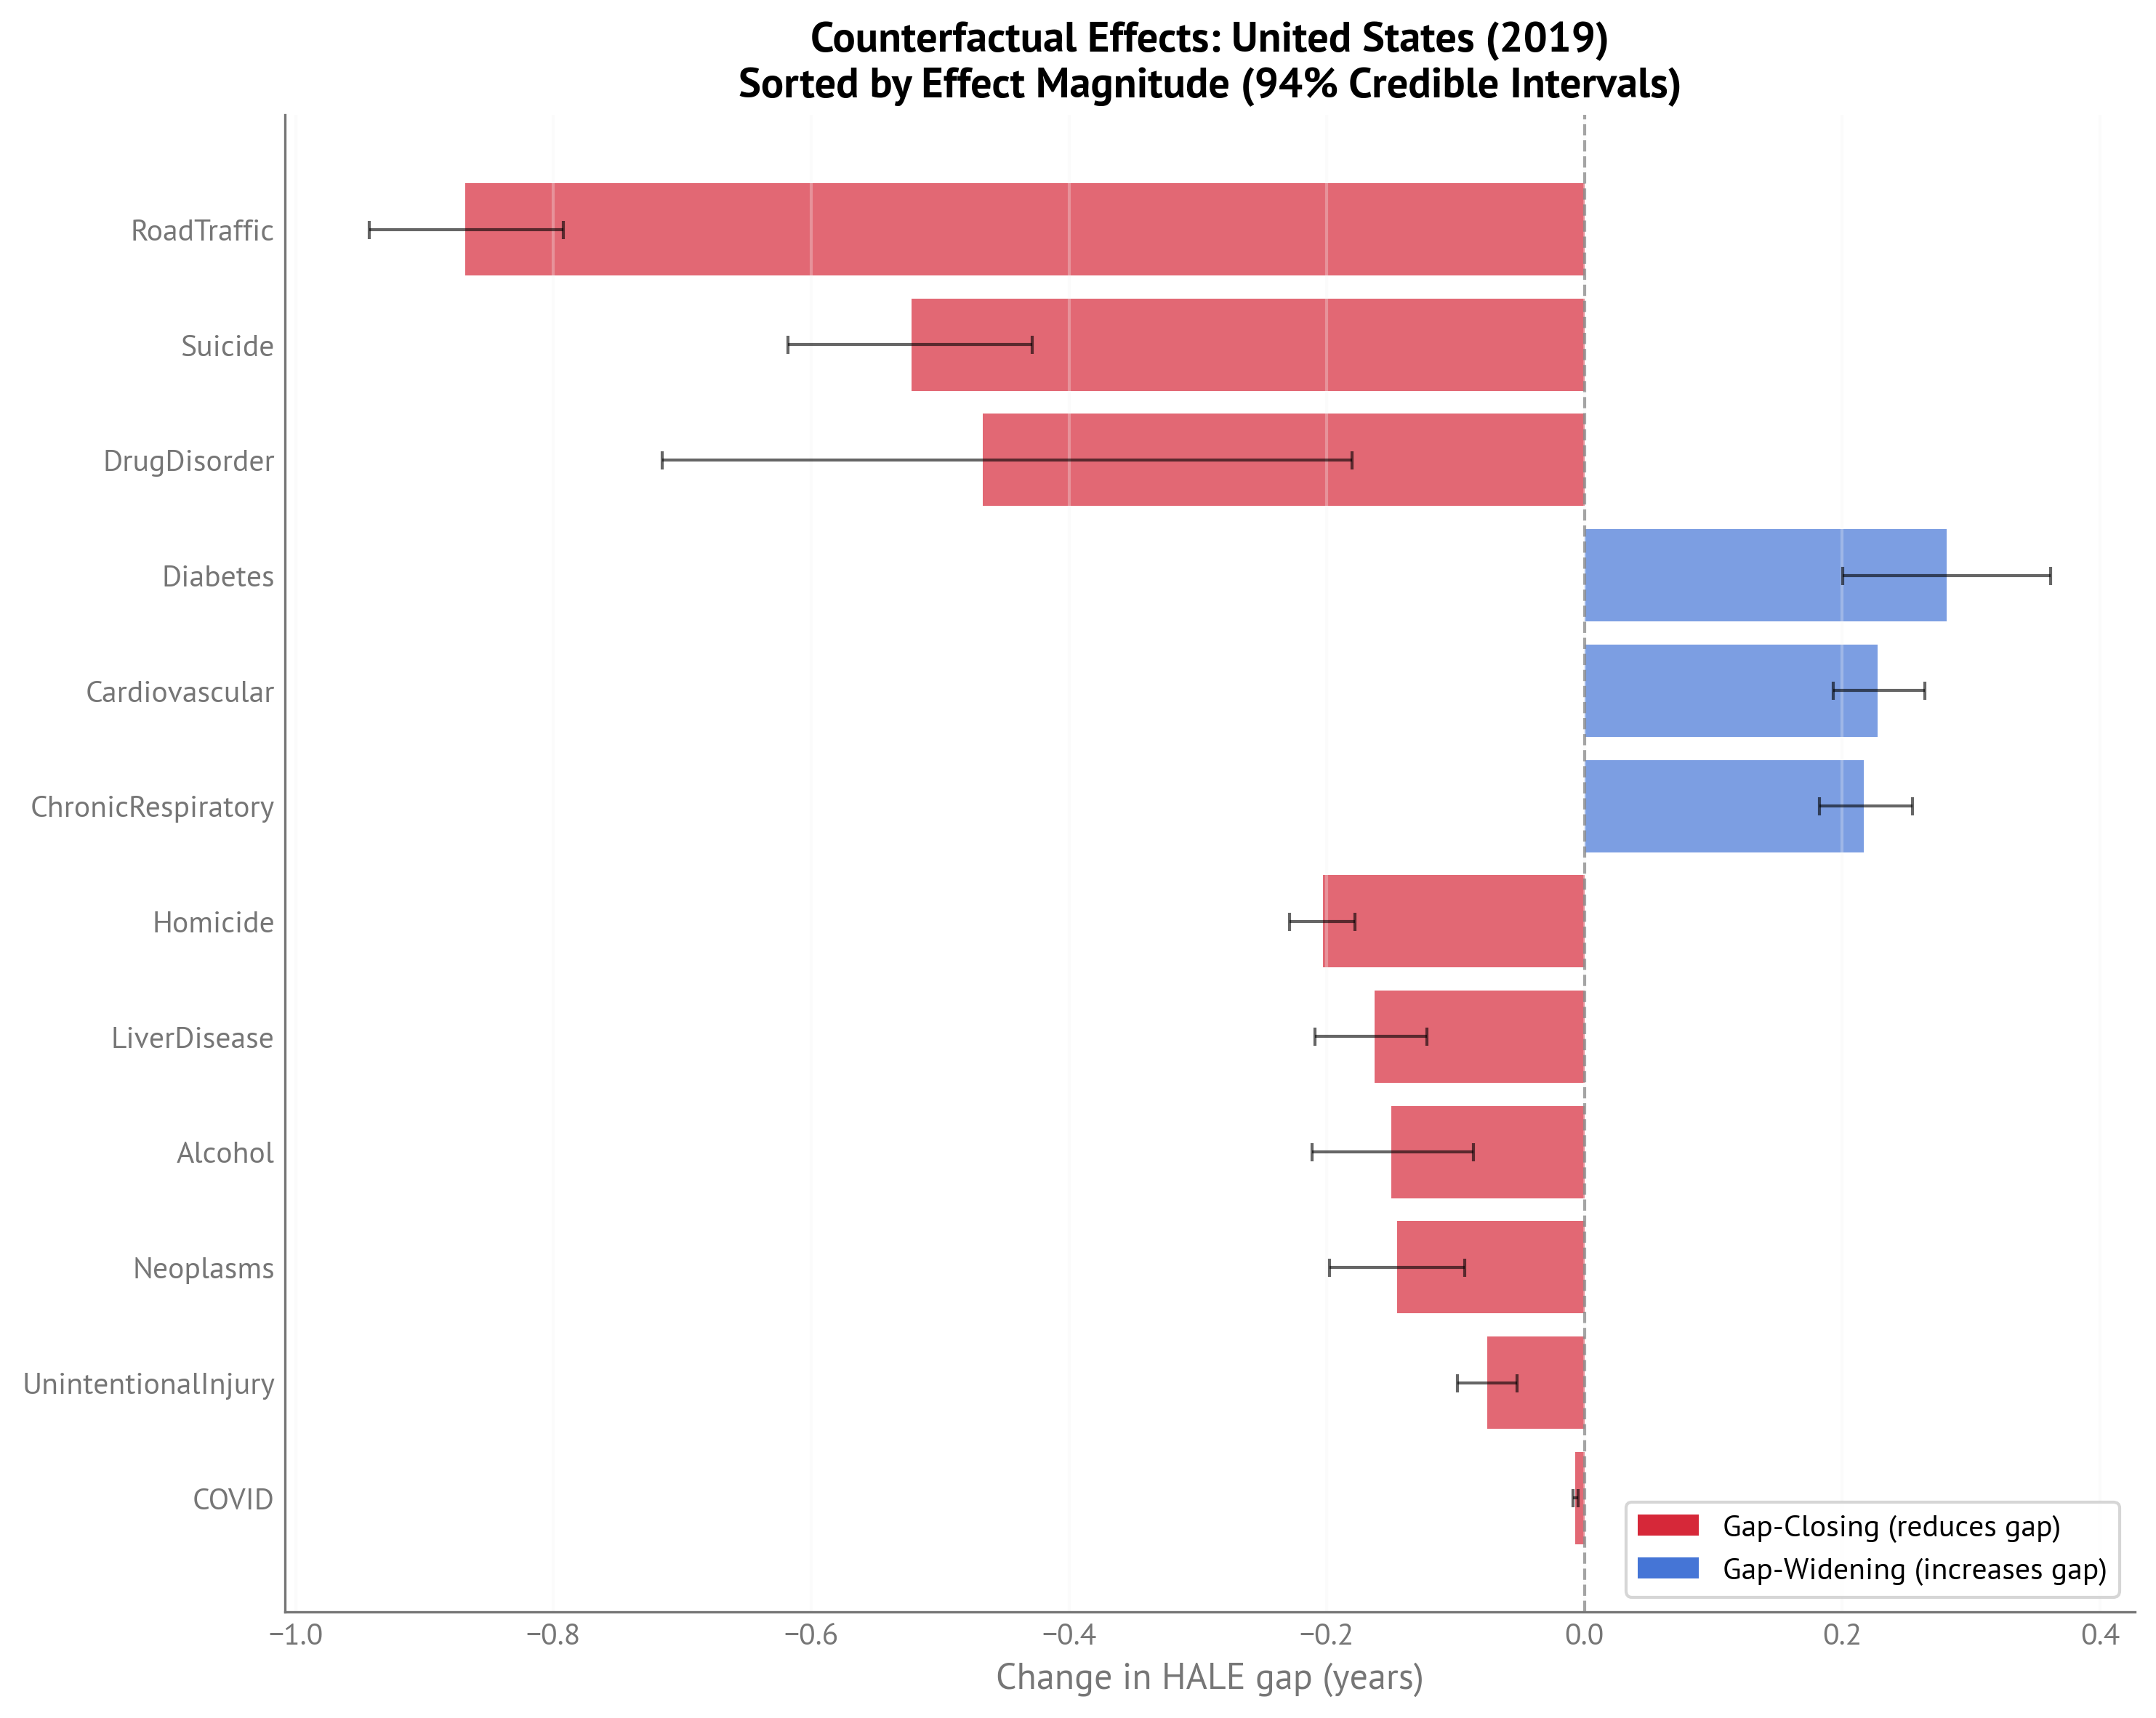
Figure 5:Bar chart of counterfactual effects sorted by magnitude for USA HALE gap (2023).
Life Expectancy Gap (2023):
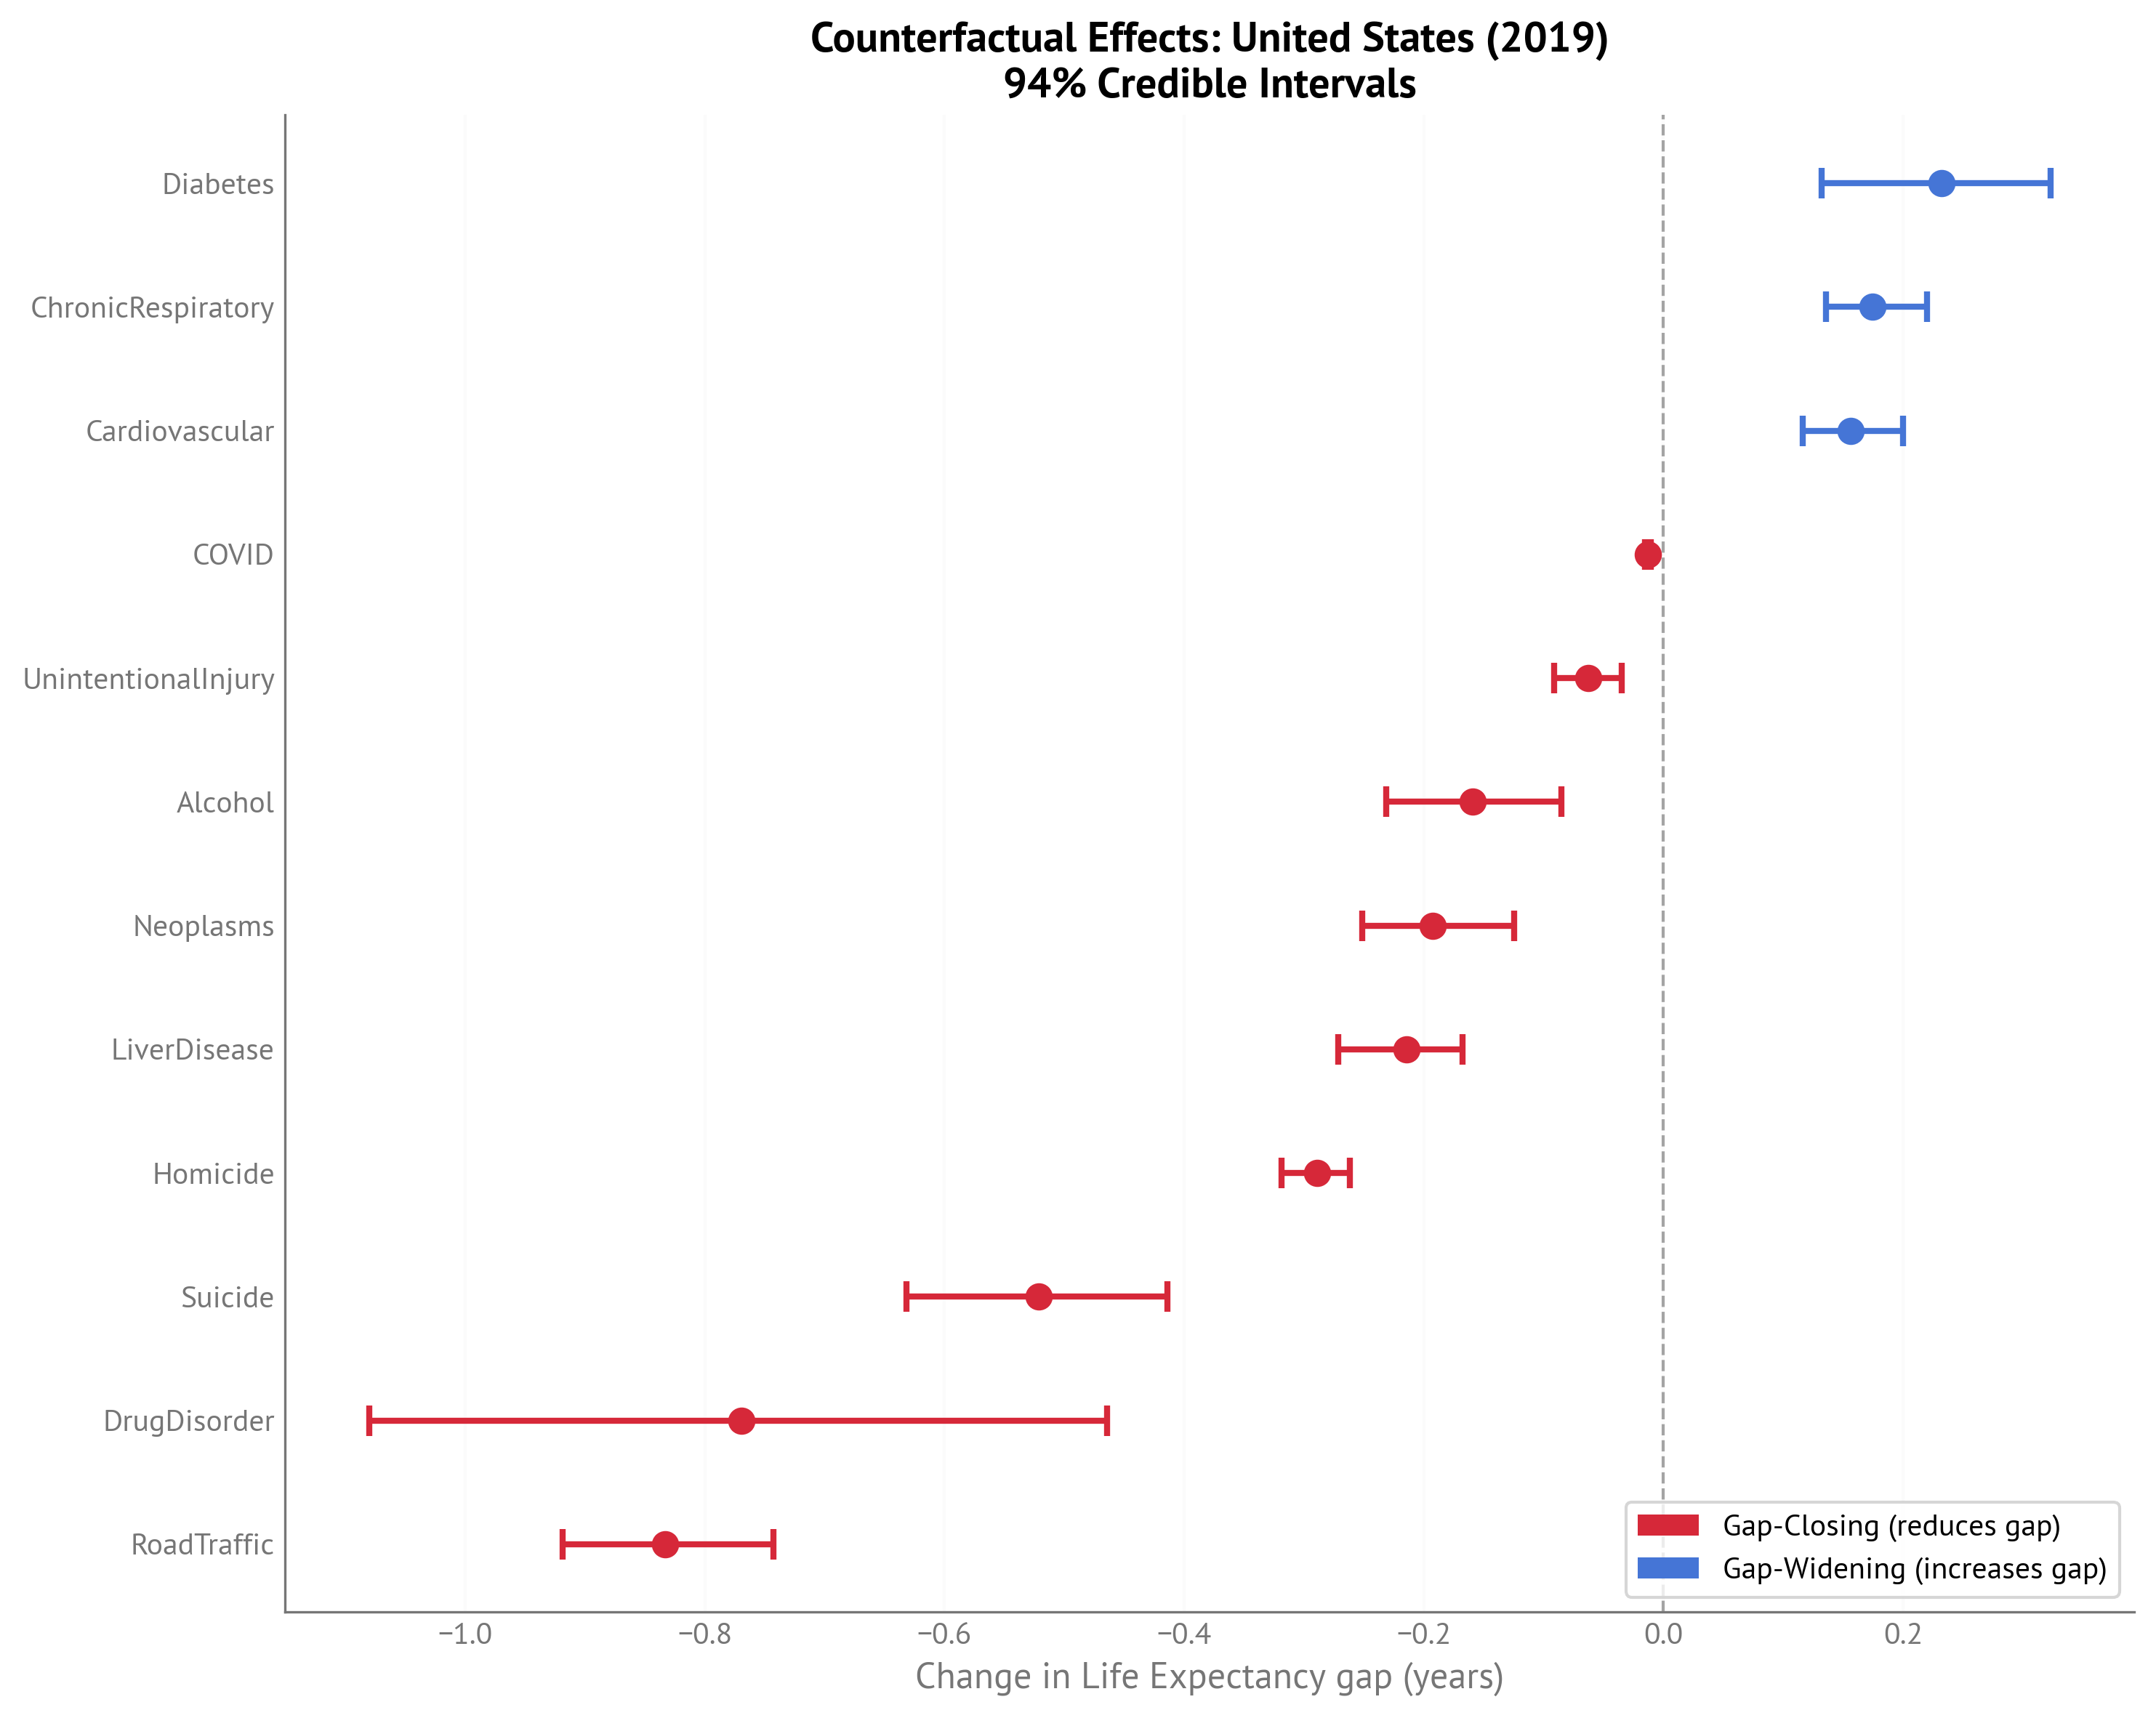
Figure 6:Forest plot showing counterfactual effects for USA Life Expectancy gap (2023) with 94% credible intervals.
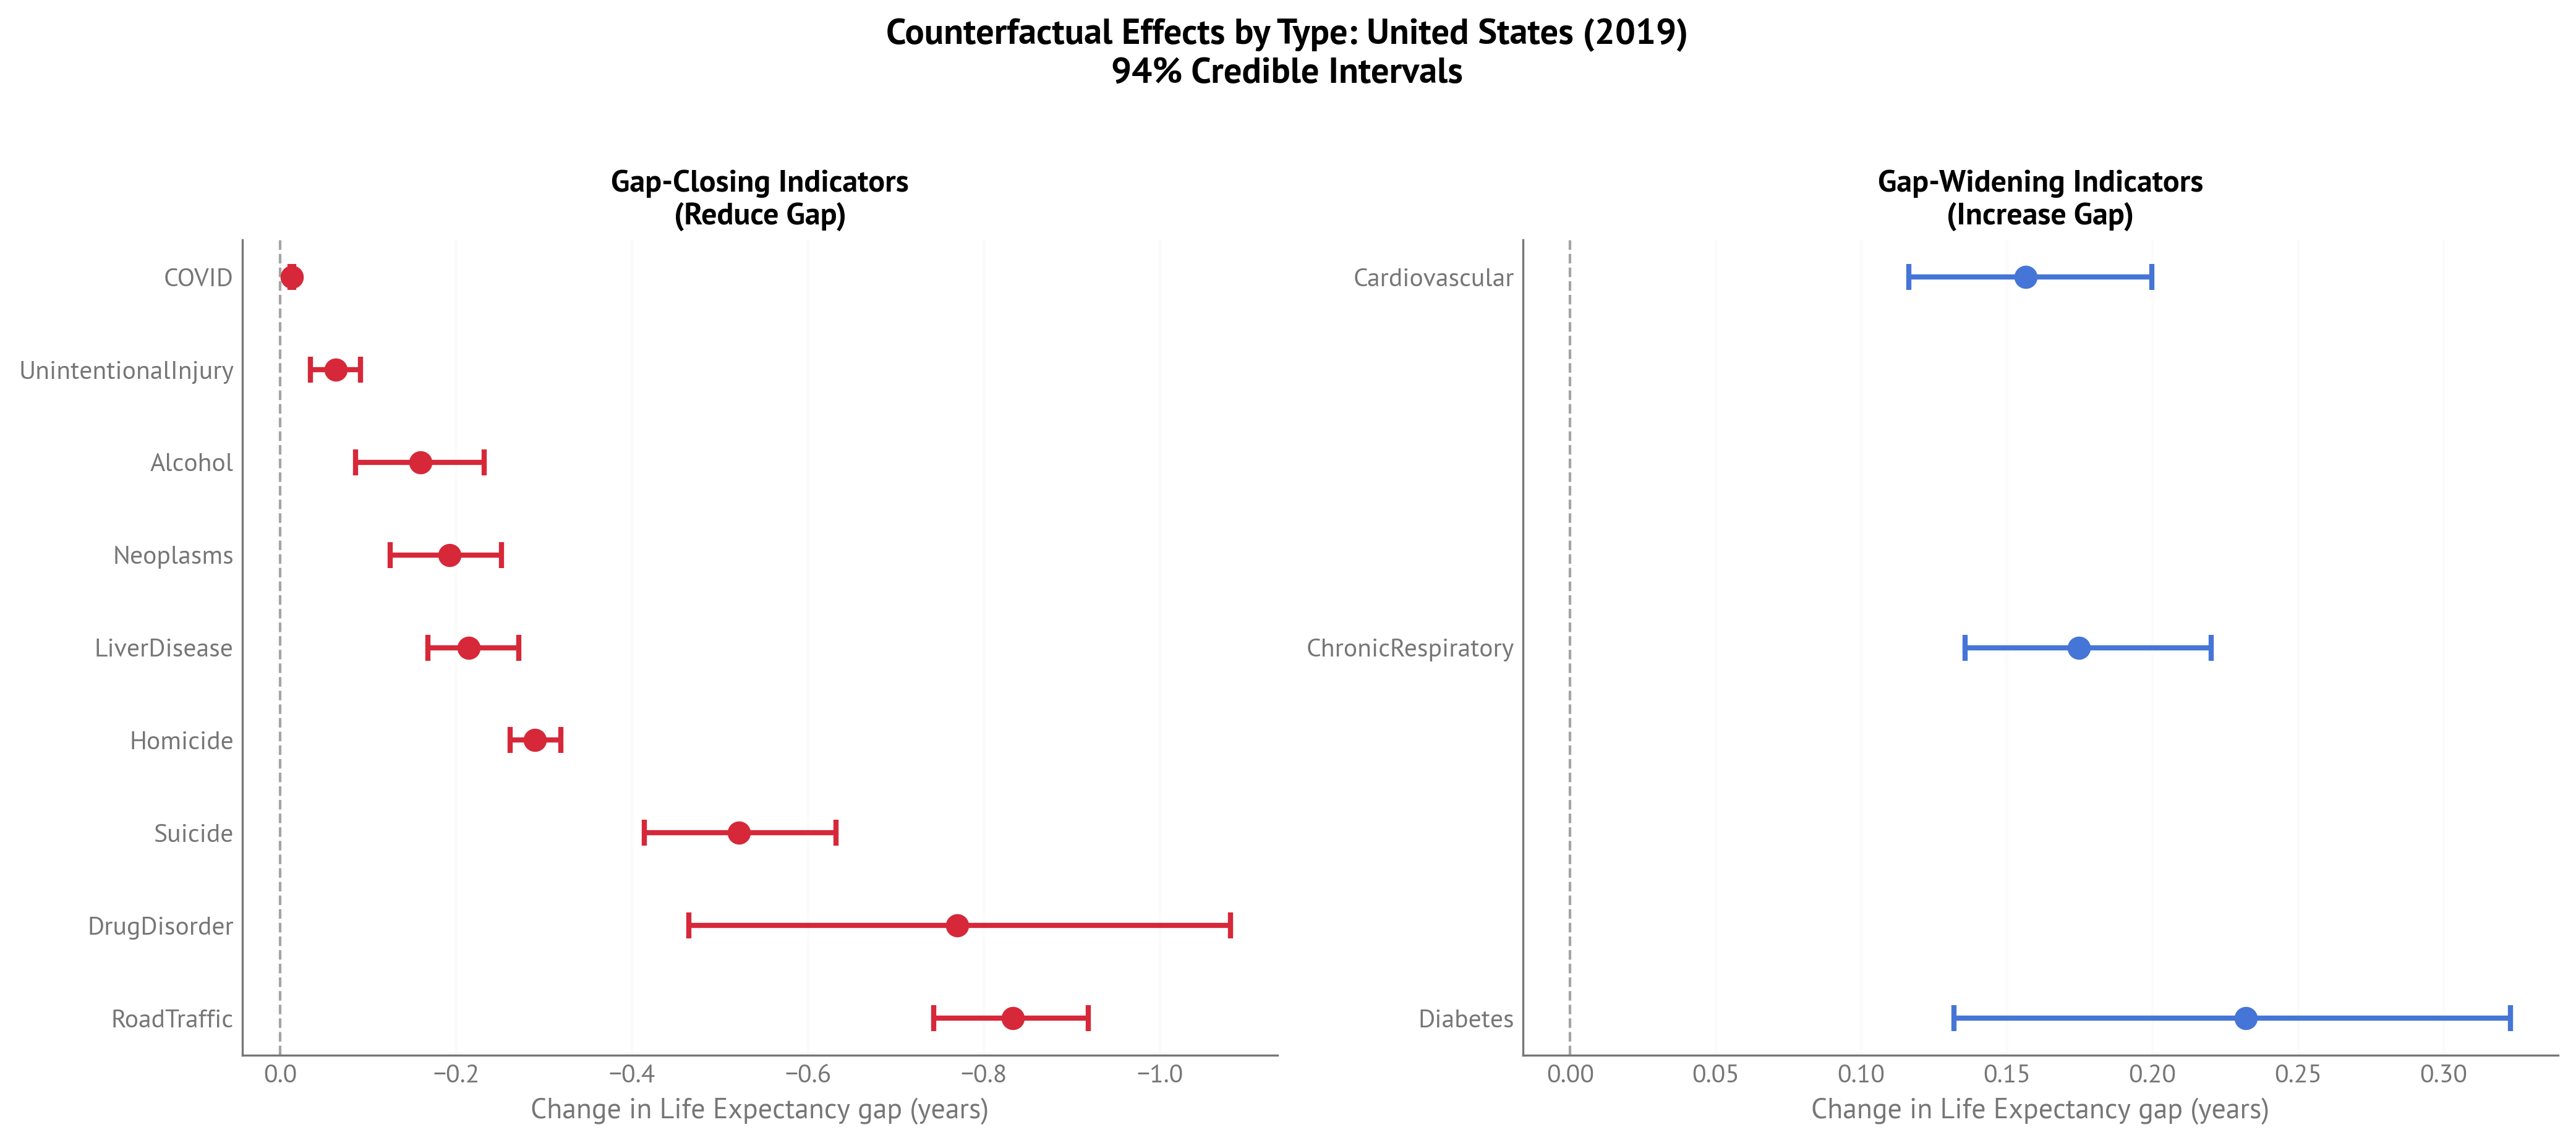
Figure 7:Two-panel plot separating gap-closing (left) and gap-widening (right) factors for USA Life Expectancy gap (2023).
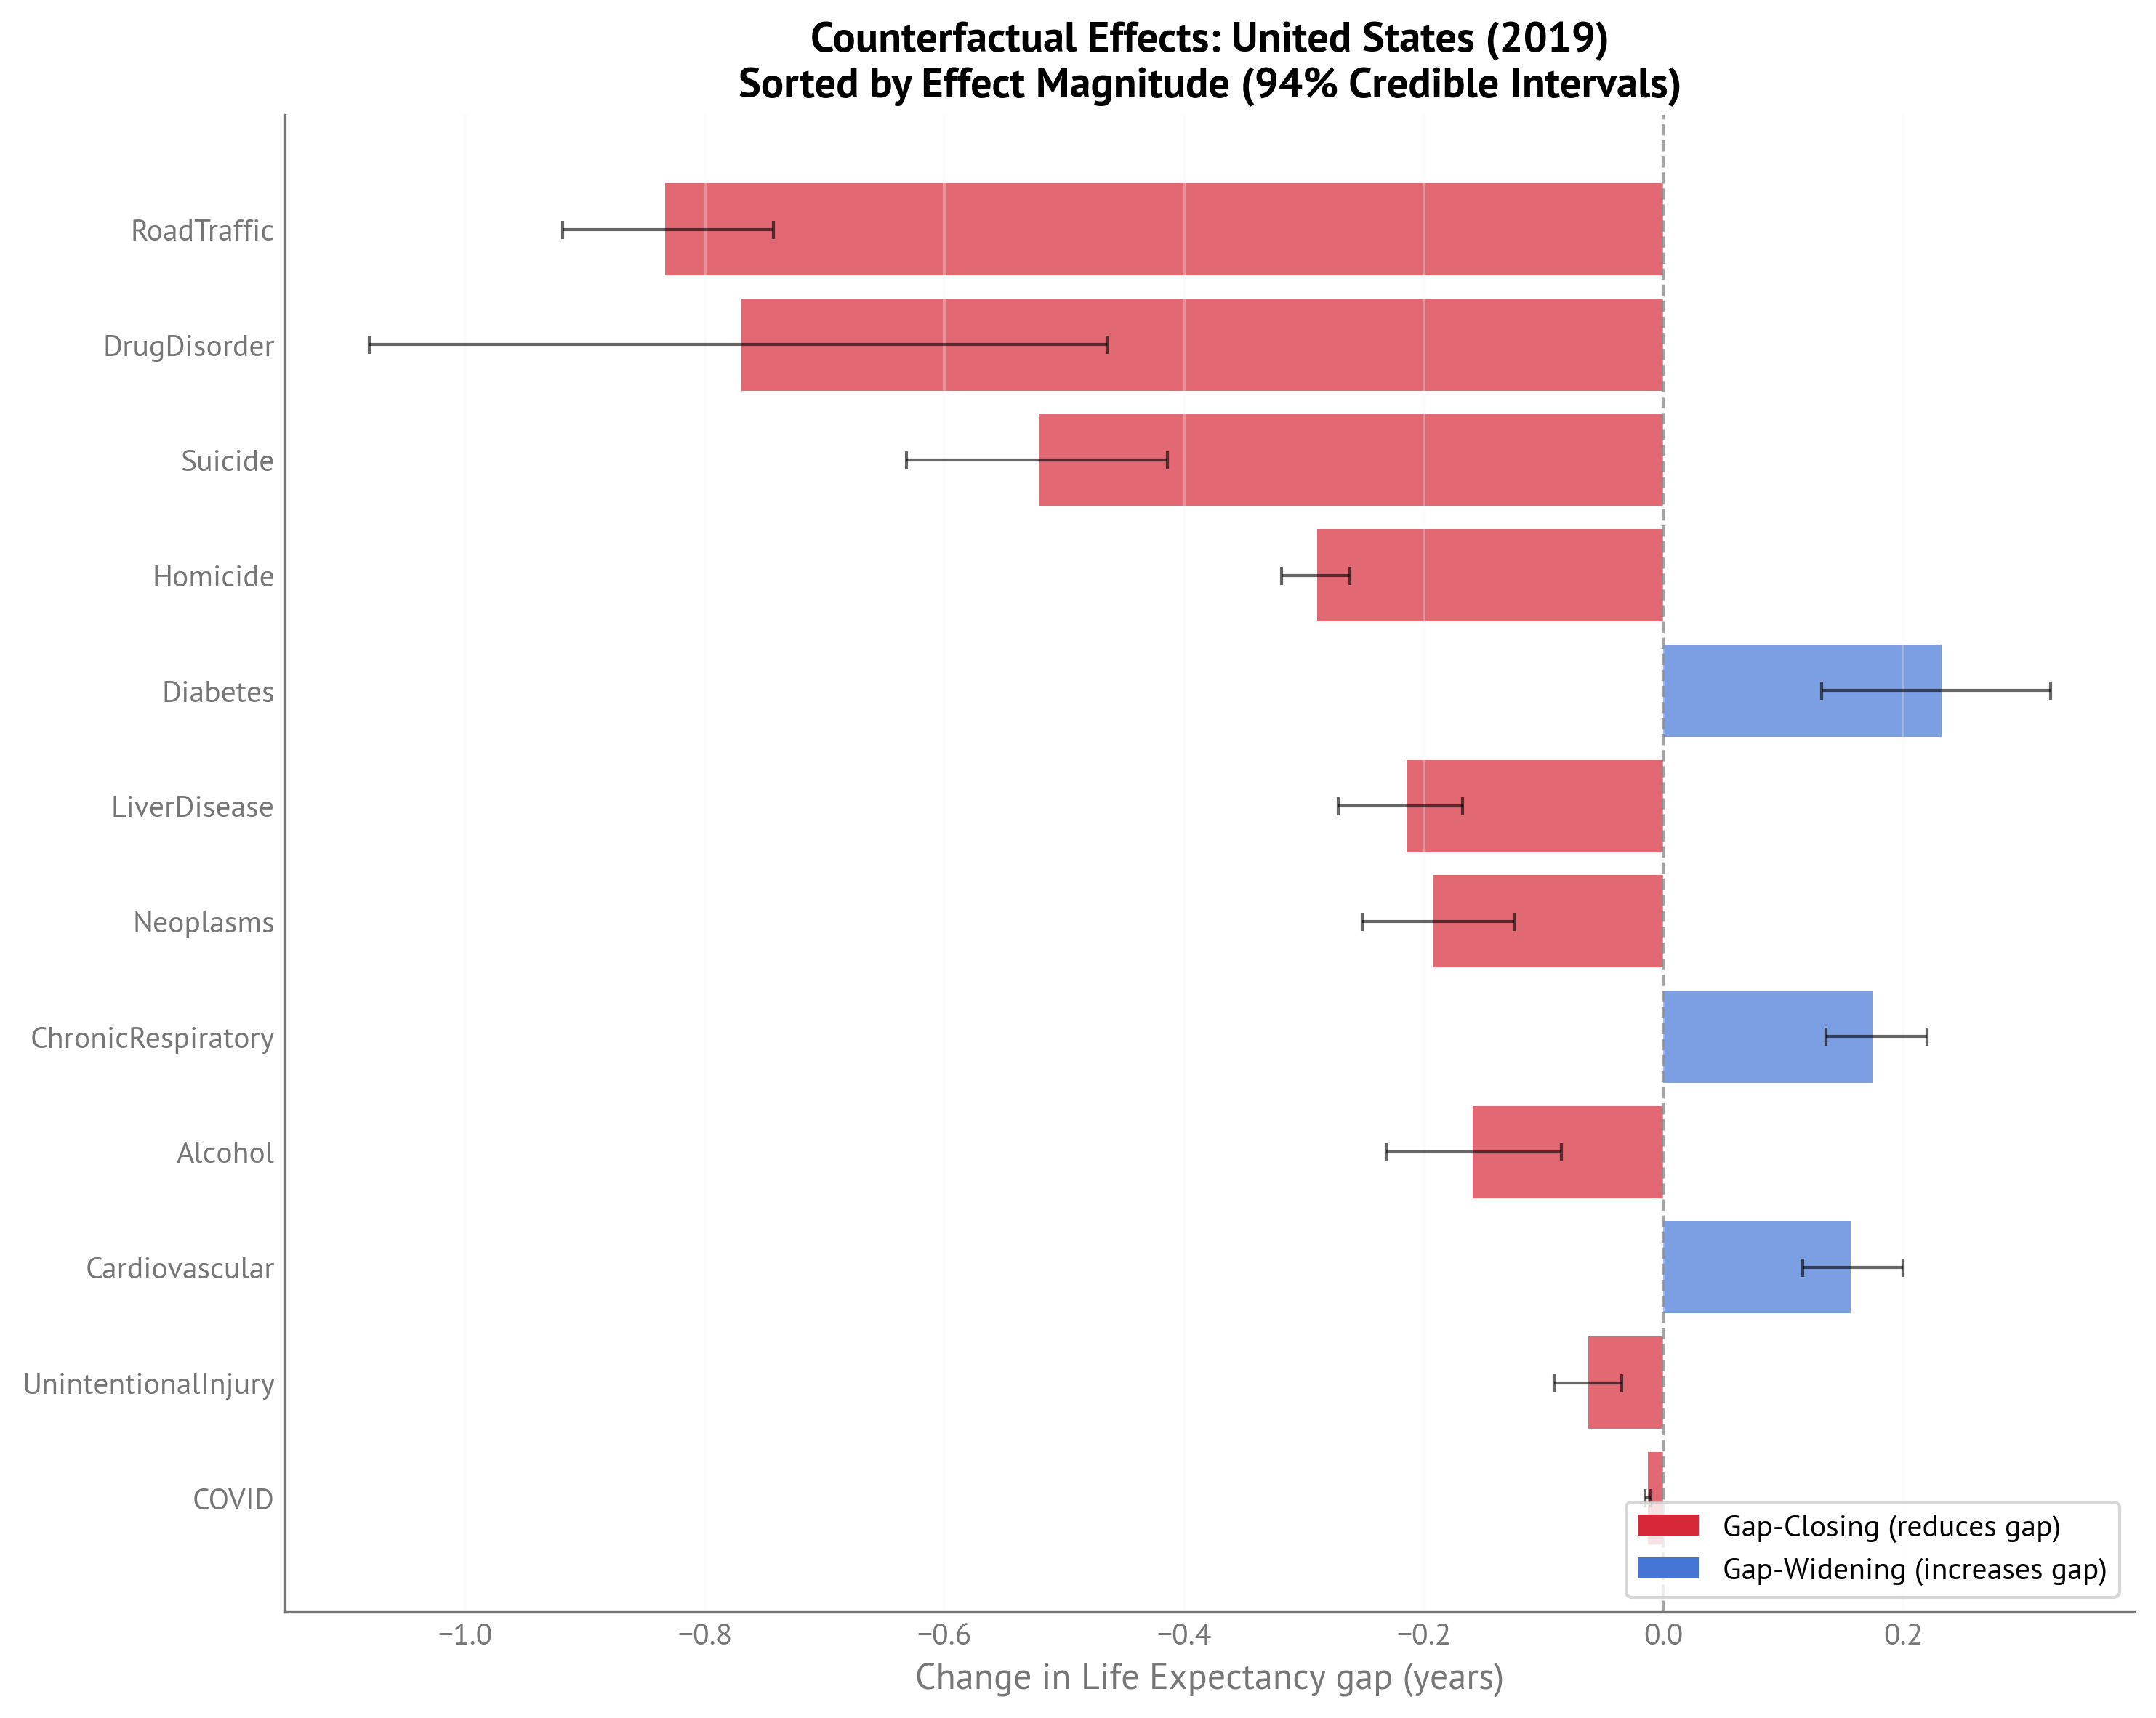
Figure 8:Bar chart of counterfactual effects sorted by magnitude for USA Life Expectancy gap (2023).
Positive-Contributing Factors Over Time
The following analysis shows how gap-closing factors (positive-contributing indicators) have evolved over time for the United States. Each factor’s contribution is computed as the reduction in the gap that would occur if that factor were set to its best attainable value.
HALE Gap - Positive Contributions Over Time (IHME, 2000-2023):
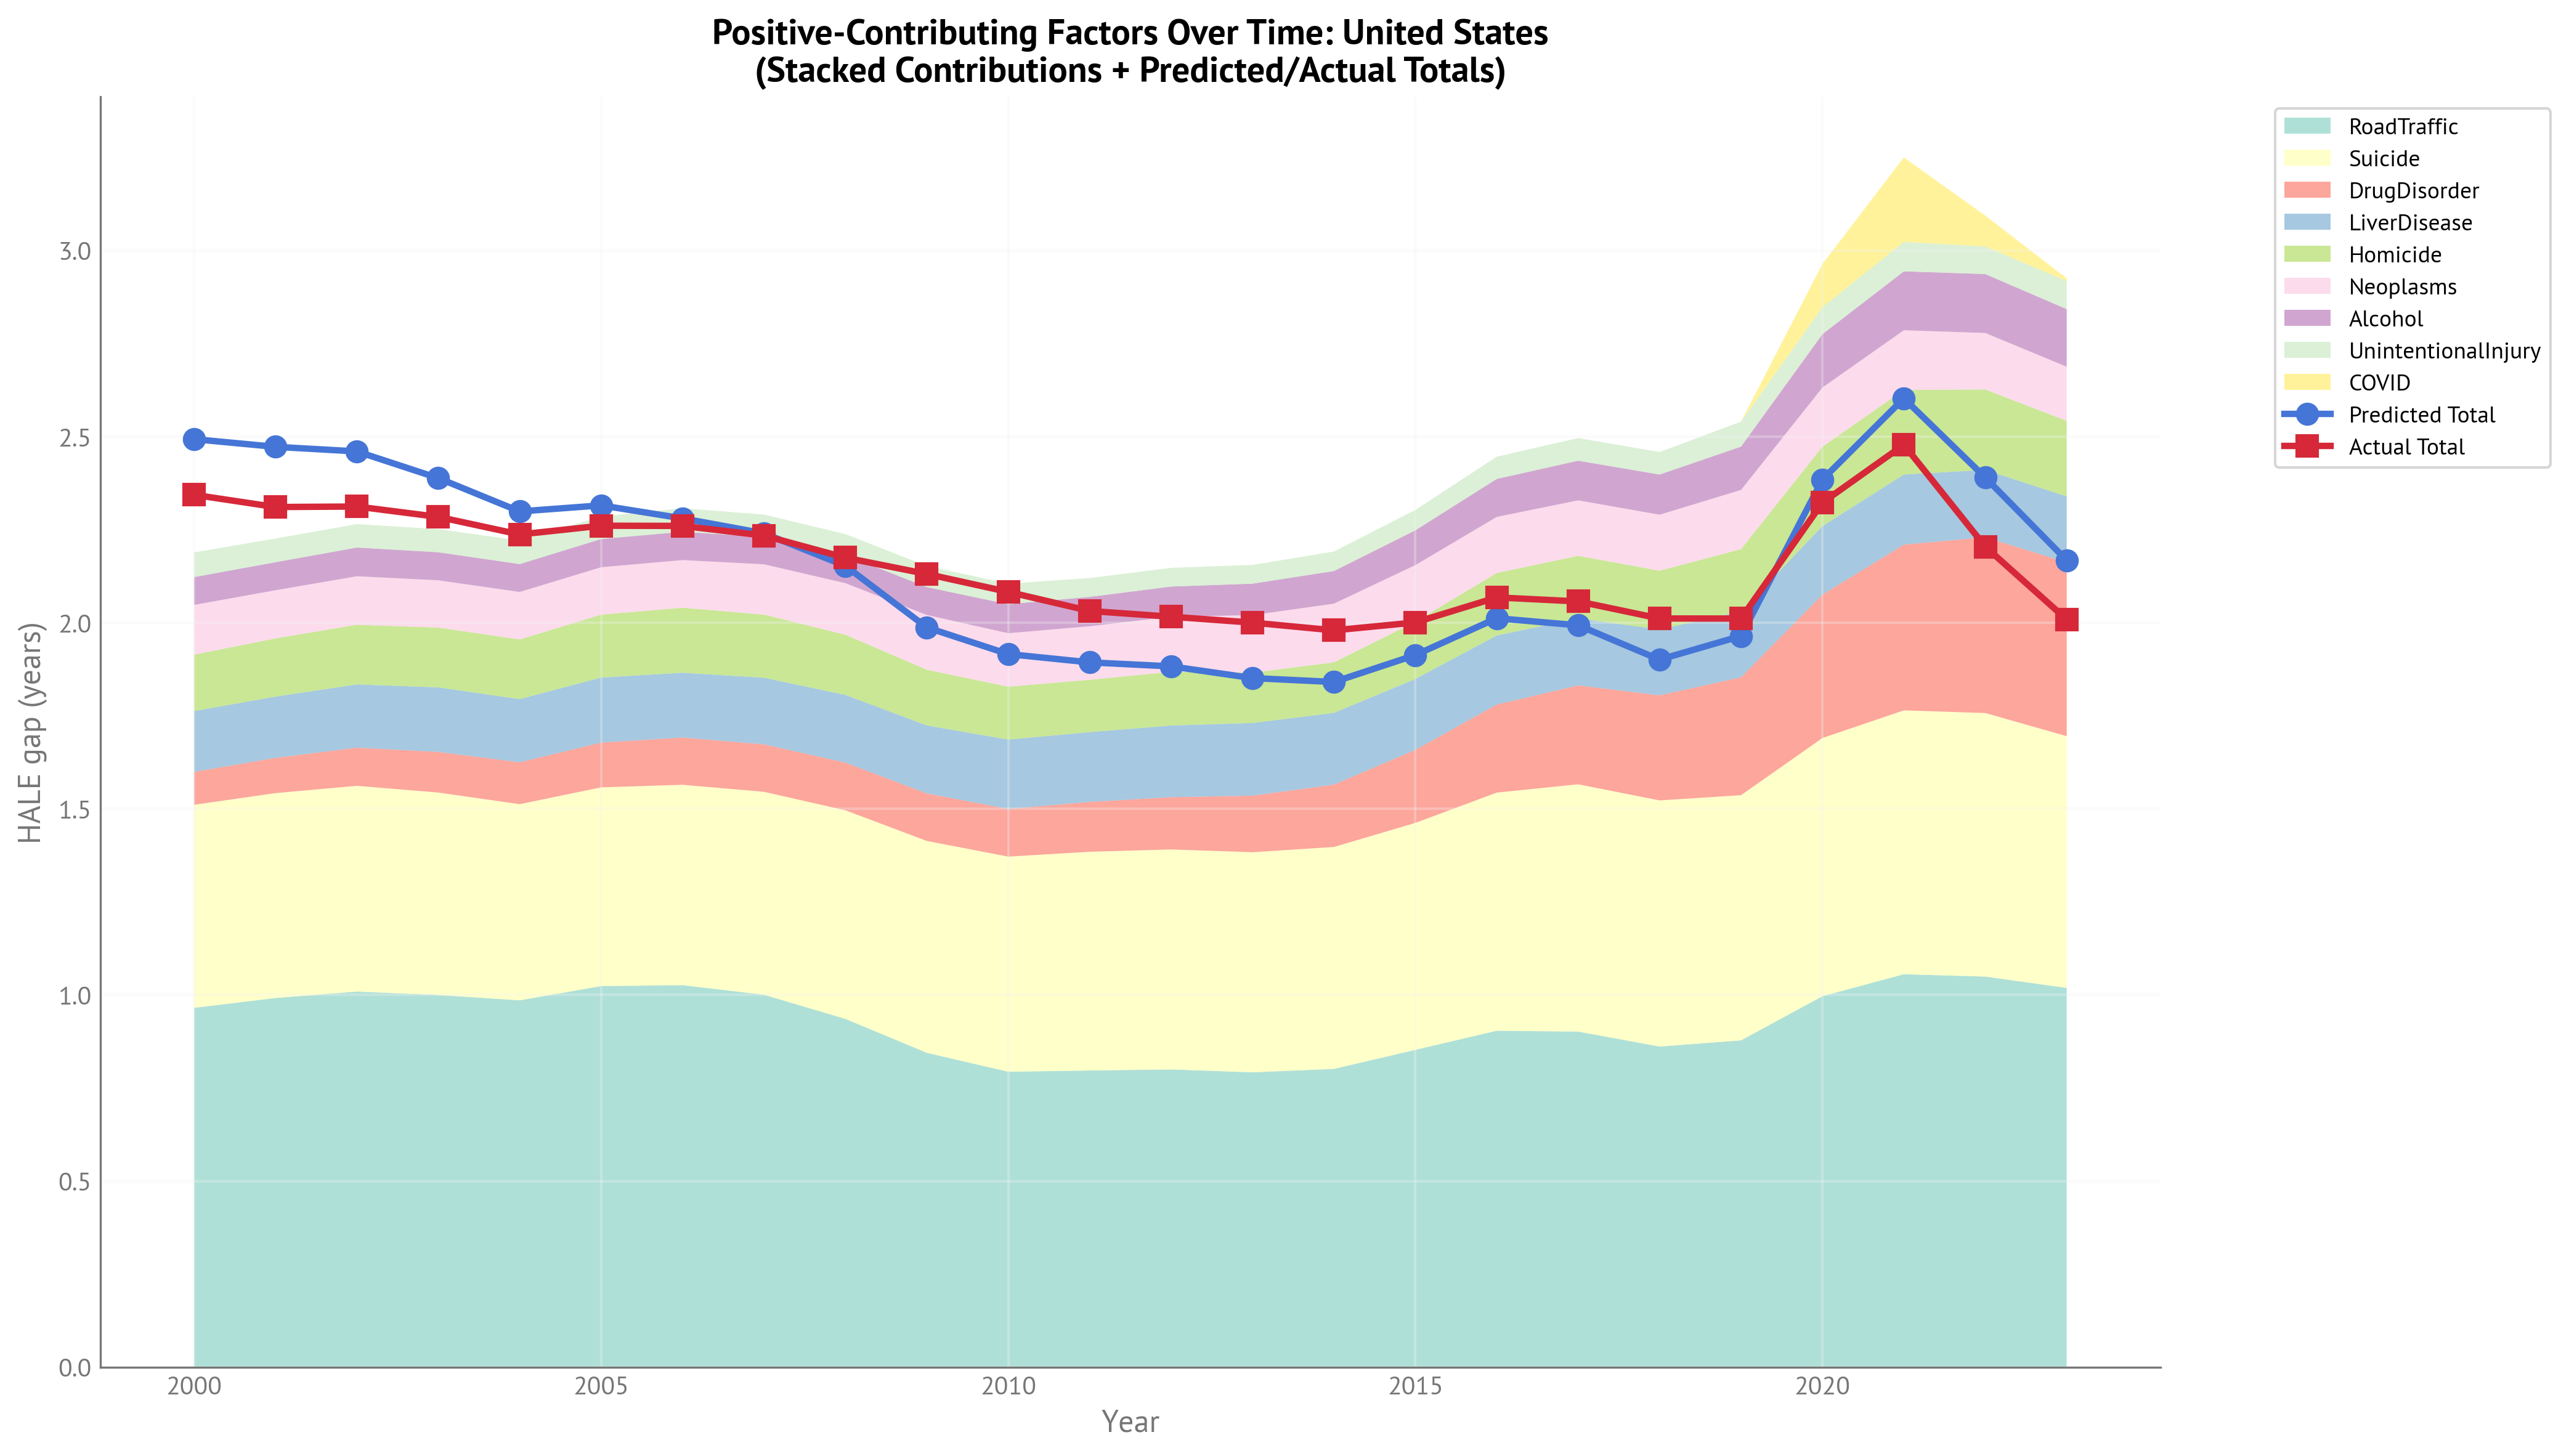
Figure 9:Stacked area chart showing contributions of gap-closing factors over time for USA HALE gap (2000-2023). The chart shows how different factors have contributed to explaining the HALE gap across the full temporal range.
| Neoplasms | Homicide | Suicide | UnintentionalInjury | RoadTraffic | LiverDisease | Alcohol | COVID | DrugDisorder | Predicted Total | Actual Total |
|---|---|---|---|---|---|---|---|---|---|---|
| 0.134 | 0.152 | 0.546 | 0.0662 | 0.965 | 0.163 | 0.0749 | 0 | 0.0884 | 2.49 | 2.34 |
| 0.129 | 0.156 | 0.55 | 0.0638 | 0.992 | 0.165 | 0.0753 | 0 | 0.0947 | 2.47 | 2.31 |
| 0.13 | 0.16 | 0.553 | 0.0629 | 1.01 | 0.17 | 0.0772 | 0 | 0.102 | 2.46 | 2.31 |
| 0.127 | 0.161 | 0.544 | 0.0621 | 1 | 0.173 | 0.0755 | 0 | 0.109 | 2.39 | 2.28 |
| 0.128 | 0.16 | 0.527 | 0.0631 | 0.986 | 0.17 | 0.0749 | 0 | 0.113 | 2.3 | 2.24 |
| 0.127 | 0.169 | 0.534 | 0.0601 | 1.02 | 0.175 | 0.076 | 0 | 0.12 | 2.32 | 2.26 |
| 0.128 | 0.175 | 0.538 | 0.0634 | 1.03 | 0.174 | 0.0761 | 0 | 0.127 | 2.28 | 2.26 |
| 0.135 | 0.17 | 0.545 | 0.0597 | 1 | 0.179 | 0.0738 | 0 | 0.128 | 2.24 | 2.23 |
| 0.138 | 0.162 | 0.56 | 0.0562 | 0.936 | 0.182 | 0.0757 | 0 | 0.128 | 2.15 | 2.18 |
| 0.147 | 0.15 | 0.569 | 0.0566 | 0.845 | 0.183 | 0.075 | 0 | 0.128 | 1.99 | 2.13 |
| 0.144 | 0.142 | 0.578 | 0.0555 | 0.794 | 0.186 | 0.0779 | 0 | 0.128 | 1.92 | 2.08 |
| 0.144 | 0.141 | 0.588 | 0.0505 | 0.797 | 0.188 | 0.0789 | 0 | 0.134 | 1.89 | 2.03 |
| 0.148 | 0.144 | 0.591 | 0.0503 | 0.8 | 0.193 | 0.081 | 0 | 0.14 | 1.88 | 2.02 |
| 0.155 | 0.135 | 0.591 | 0.0503 | 0.792 | 0.195 | 0.0846 | 0 | 0.152 | 1.85 | 2 |
| 0.158 | 0.136 | 0.596 | 0.0523 | 0.801 | 0.193 | 0.0877 | 0 | 0.168 | 1.84 | 1.98 |
| 0.152 | 0.154 | 0.61 | 0.0546 | 0.853 | 0.191 | 0.0935 | 0 | 0.196 | 1.91 | 2 |
| 0.151 | 0.168 | 0.64 | 0.0597 | 0.904 | 0.186 | 0.102 | 0 | 0.237 | 2.01 | 2.07 |
| 0.149 | 0.168 | 0.664 | 0.0608 | 0.902 | 0.18 | 0.107 | 0 | 0.266 | 1.99 | 2.06 |
| 0.15 | 0.158 | 0.661 | 0.0605 | 0.862 | 0.177 | 0.108 | 0 | 0.282 | 1.9 | 2.01 |
| 0.159 | 0.167 | 0.659 | 0.0671 | 0.878 | 0.177 | 0.116 | 0 | 0.317 | 1.96 | 2.01 |
| 0.159 | 0.213 | 0.694 | 0.0726 | 0.997 | 0.184 | 0.144 | 0.116 | 0.385 | 2.38 | 2.32 |
| 0.16 | 0.228 | 0.709 | 0.0791 | 1.06 | 0.188 | 0.158 | 0.227 | 0.445 | 2.6 | 2.48 |
| 0.152 | 0.216 | 0.708 | 0.0741 | 1.05 | 0.181 | 0.158 | 0.0829 | 0.472 | 2.39 | 2.2 |
| 0.145 | 0.203 | 0.676 | 0.0754 | 1.02 | 0.177 | 0.155 | 0.00724 | 0.467 | 2.17 | 2.01 |
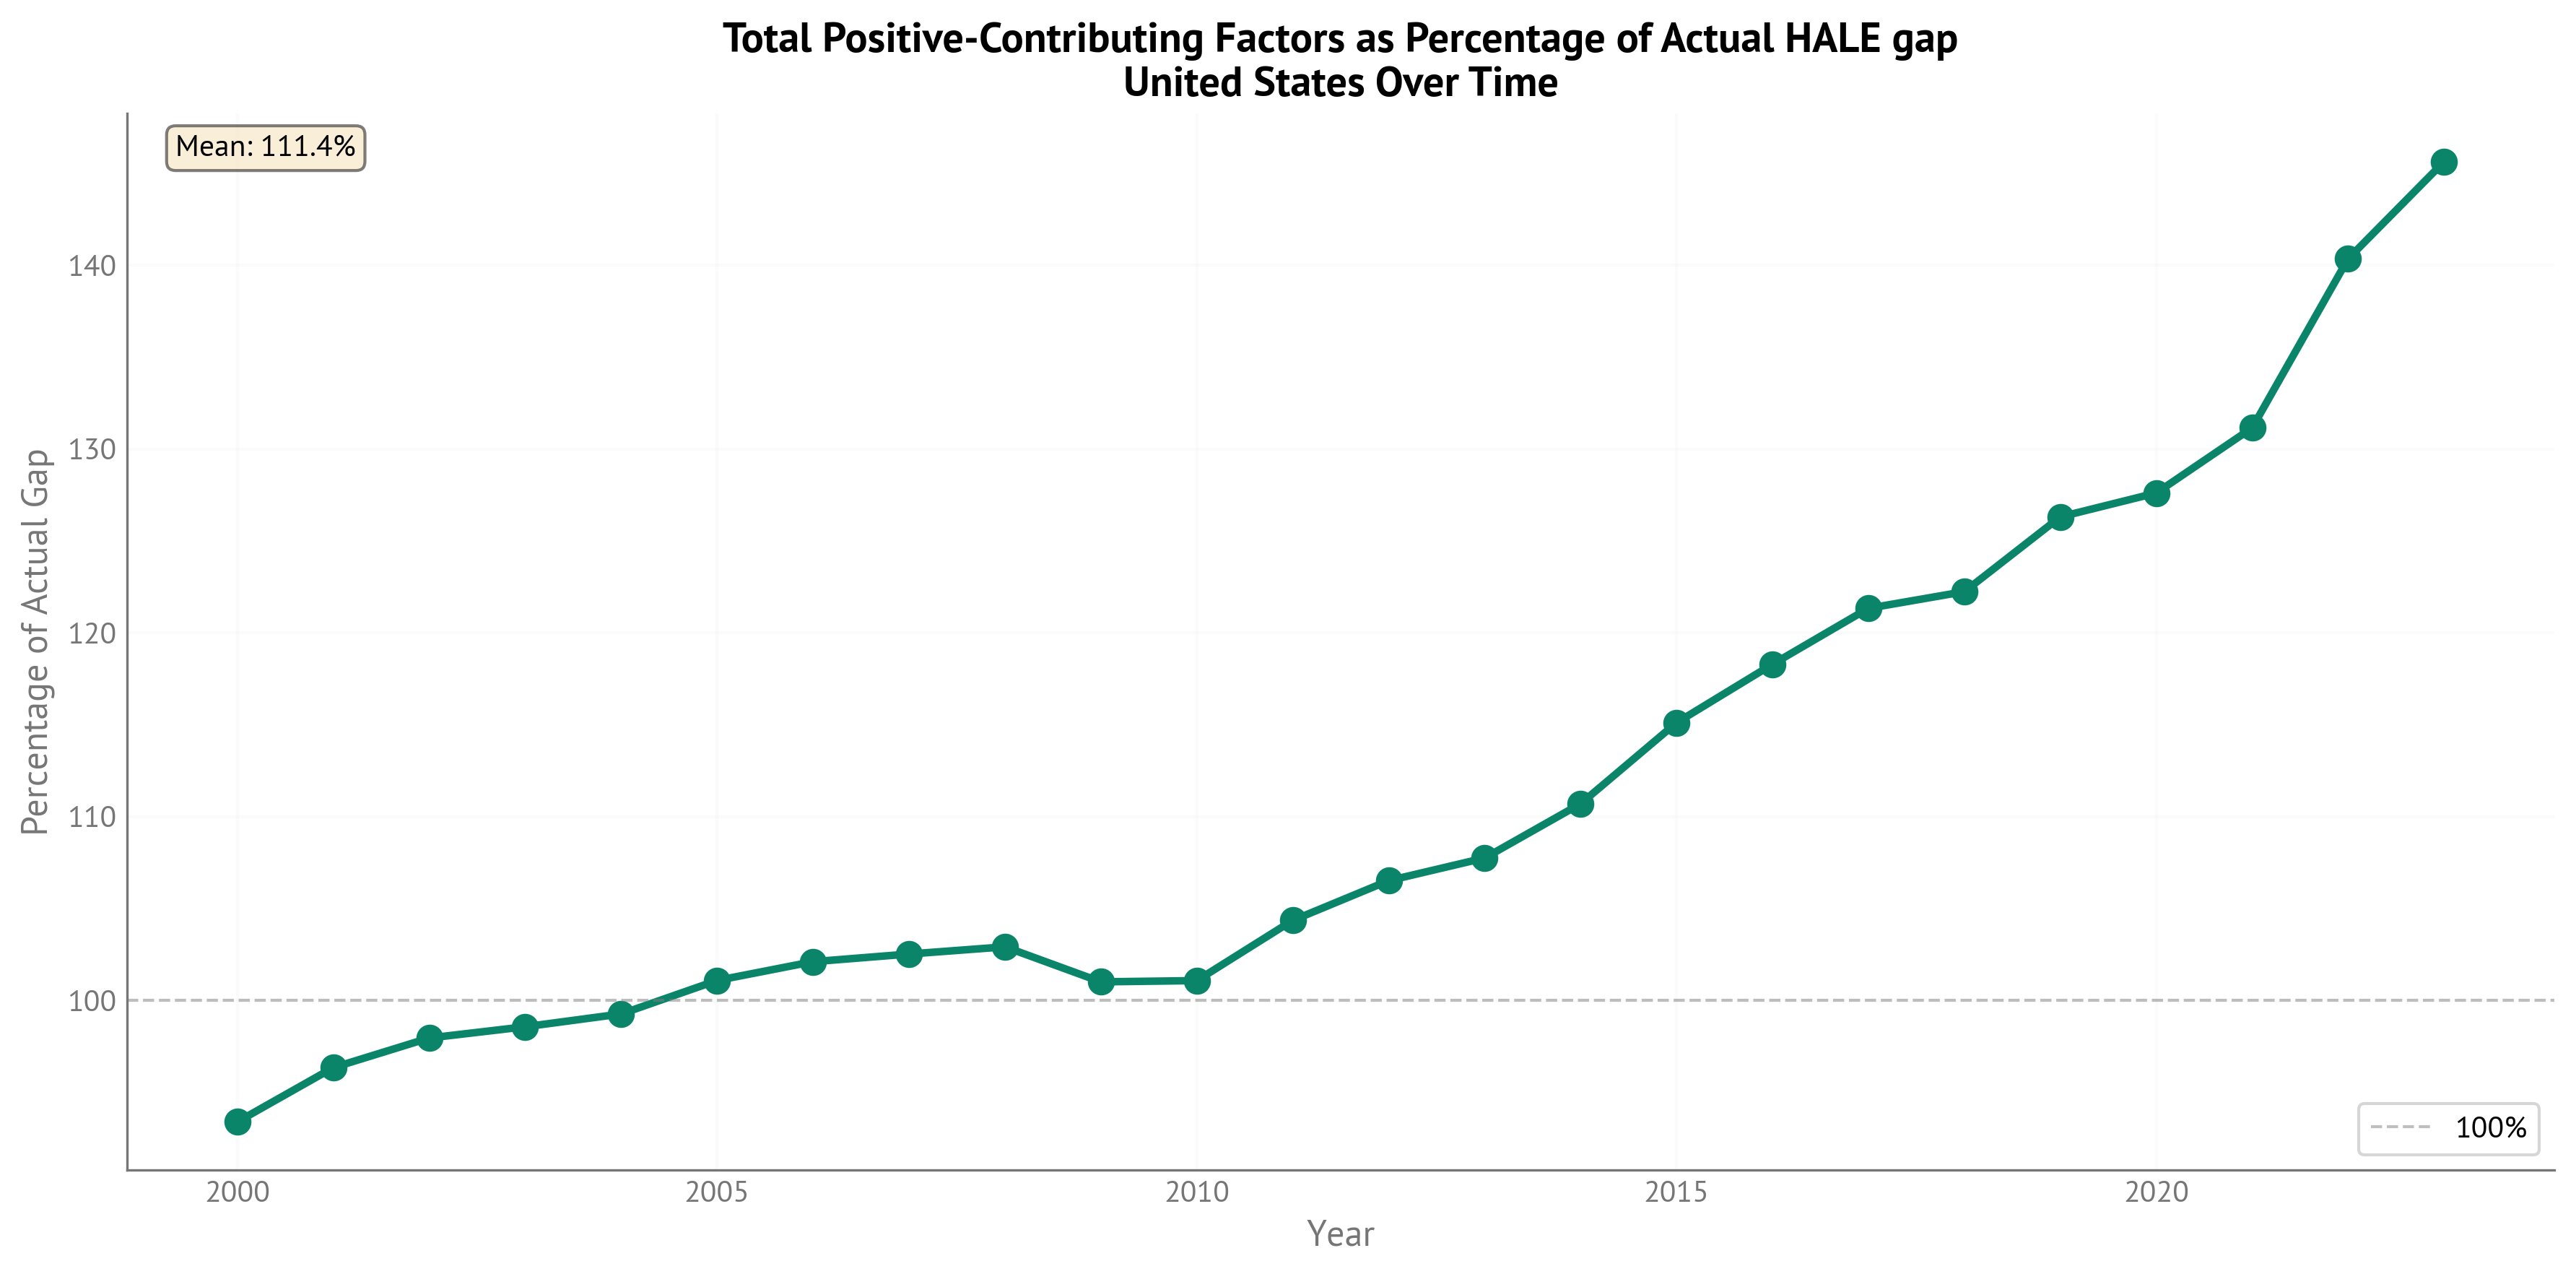
Figure 10:Percentage of actual HALE gap explained by positive-contributing (gap-closing) factors over time. This shows what proportion of the observed gap could be reduced by addressing these factors.
Life Expectancy Gap - Positive Contributions Over Time (OWID, 2000-2023):
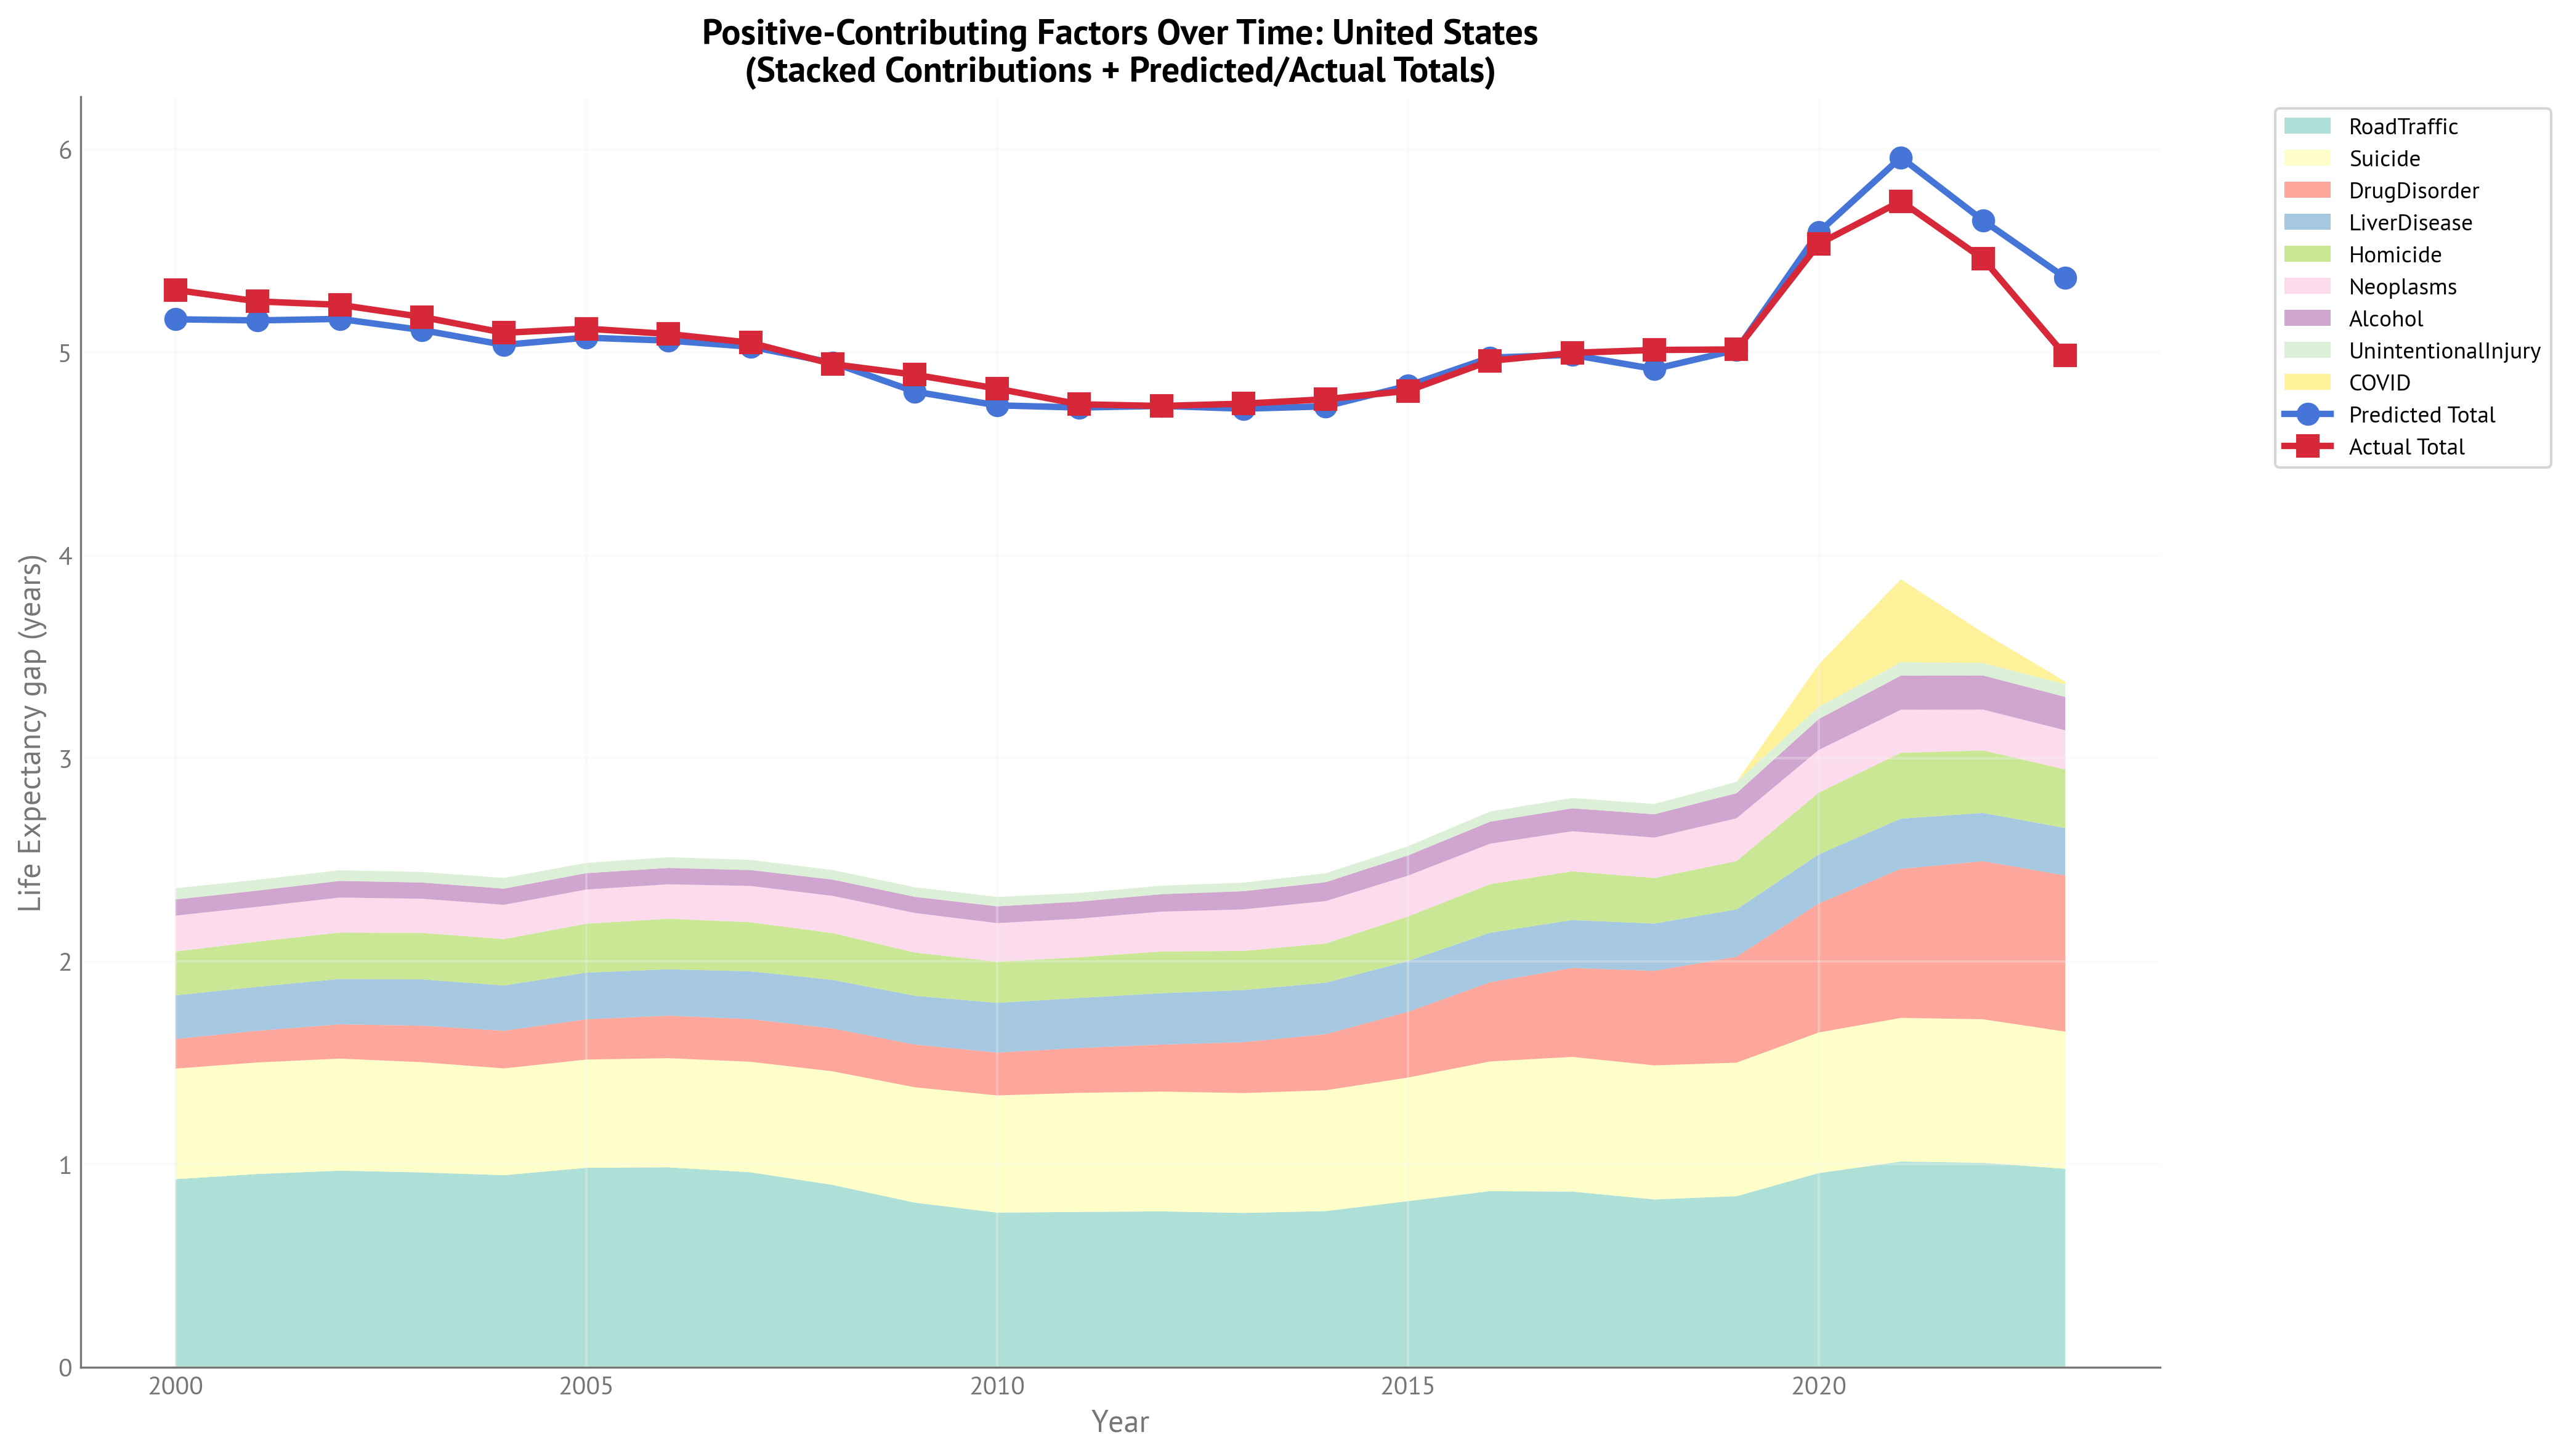
Figure 11:Stacked area chart showing contributions of gap-closing factors over time for USA Life Expectancy gap (2000-2023). The extended temporal range now includes the full COVID period and post-acute recovery.
| Neoplasms | Homicide | Suicide | RoadTraffic | UnintentionalInjury | LiverDisease | COVID | Alcohol | DrugDisorder | Predicted Total | Actual Total |
|---|---|---|---|---|---|---|---|---|---|---|
| 0.177 | 0.216 | 0.545 | 0.926 | 0.0552 | 0.215 | 0 | 0.0795 | 0.146 | 5.16 | 5.31 |
| 0.171 | 0.223 | 0.55 | 0.952 | 0.0532 | 0.217 | 0 | 0.0799 | 0.156 | 5.16 | 5.25 |
| 0.173 | 0.229 | 0.552 | 0.968 | 0.0525 | 0.223 | 0 | 0.082 | 0.169 | 5.17 | 5.23 |
| 0.168 | 0.229 | 0.543 | 0.959 | 0.0518 | 0.228 | 0 | 0.0801 | 0.18 | 5.11 | 5.17 |
| 0.169 | 0.229 | 0.526 | 0.946 | 0.0526 | 0.223 | 0 | 0.0795 | 0.186 | 5.04 | 5.1 |
| 0.169 | 0.241 | 0.533 | 0.982 | 0.0502 | 0.23 | 0 | 0.0807 | 0.198 | 5.07 | 5.12 |
| 0.169 | 0.249 | 0.538 | 0.985 | 0.0529 | 0.229 | 0 | 0.0808 | 0.209 | 5.06 | 5.09 |
| 0.179 | 0.242 | 0.545 | 0.96 | 0.0498 | 0.235 | 0 | 0.0784 | 0.21 | 5.03 | 5.05 |
| 0.183 | 0.231 | 0.56 | 0.898 | 0.0469 | 0.239 | 0 | 0.0803 | 0.211 | 4.95 | 4.94 |
| 0.195 | 0.213 | 0.568 | 0.81 | 0.0472 | 0.24 | 0 | 0.0797 | 0.211 | 4.81 | 4.89 |
| 0.19 | 0.203 | 0.577 | 0.762 | 0.0463 | 0.245 | 0 | 0.0827 | 0.211 | 4.74 | 4.82 |
| 0.191 | 0.2 | 0.587 | 0.765 | 0.0422 | 0.247 | 0 | 0.0838 | 0.221 | 4.73 | 4.74 |
| 0.196 | 0.206 | 0.59 | 0.767 | 0.042 | 0.253 | 0 | 0.086 | 0.232 | 4.74 | 4.74 |
| 0.205 | 0.193 | 0.591 | 0.76 | 0.042 | 0.257 | 0 | 0.0898 | 0.251 | 4.72 | 4.75 |
| 0.209 | 0.194 | 0.596 | 0.769 | 0.0437 | 0.253 | 0 | 0.0931 | 0.276 | 4.73 | 4.77 |
| 0.201 | 0.219 | 0.609 | 0.818 | 0.0456 | 0.251 | 0 | 0.0993 | 0.324 | 4.84 | 4.81 |
| 0.199 | 0.239 | 0.639 | 0.867 | 0.0499 | 0.244 | 0 | 0.108 | 0.39 | 4.97 | 4.96 |
| 0.197 | 0.24 | 0.664 | 0.865 | 0.0507 | 0.236 | 0 | 0.113 | 0.438 | 4.99 | 5 |
| 0.199 | 0.225 | 0.66 | 0.827 | 0.0505 | 0.233 | 0 | 0.115 | 0.466 | 4.92 | 5.01 |
| 0.211 | 0.238 | 0.658 | 0.842 | 0.056 | 0.233 | 0 | 0.124 | 0.522 | 5.01 | 5.01 |
| 0.21 | 0.304 | 0.693 | 0.956 | 0.0606 | 0.242 | 0.209 | 0.152 | 0.635 | 5.59 | 5.53 |
| 0.212 | 0.324 | 0.708 | 1.01 | 0.0661 | 0.248 | 0.409 | 0.168 | 0.734 | 5.96 | 5.74 |
| 0.201 | 0.308 | 0.707 | 1.01 | 0.0619 | 0.238 | 0.149 | 0.168 | 0.779 | 5.65 | 5.46 |
| 0.193 | 0.289 | 0.676 | 0.978 | 0.0629 | 0.233 | 0.013 | 0.164 | 0.77 | 5.37 | 4.98 |
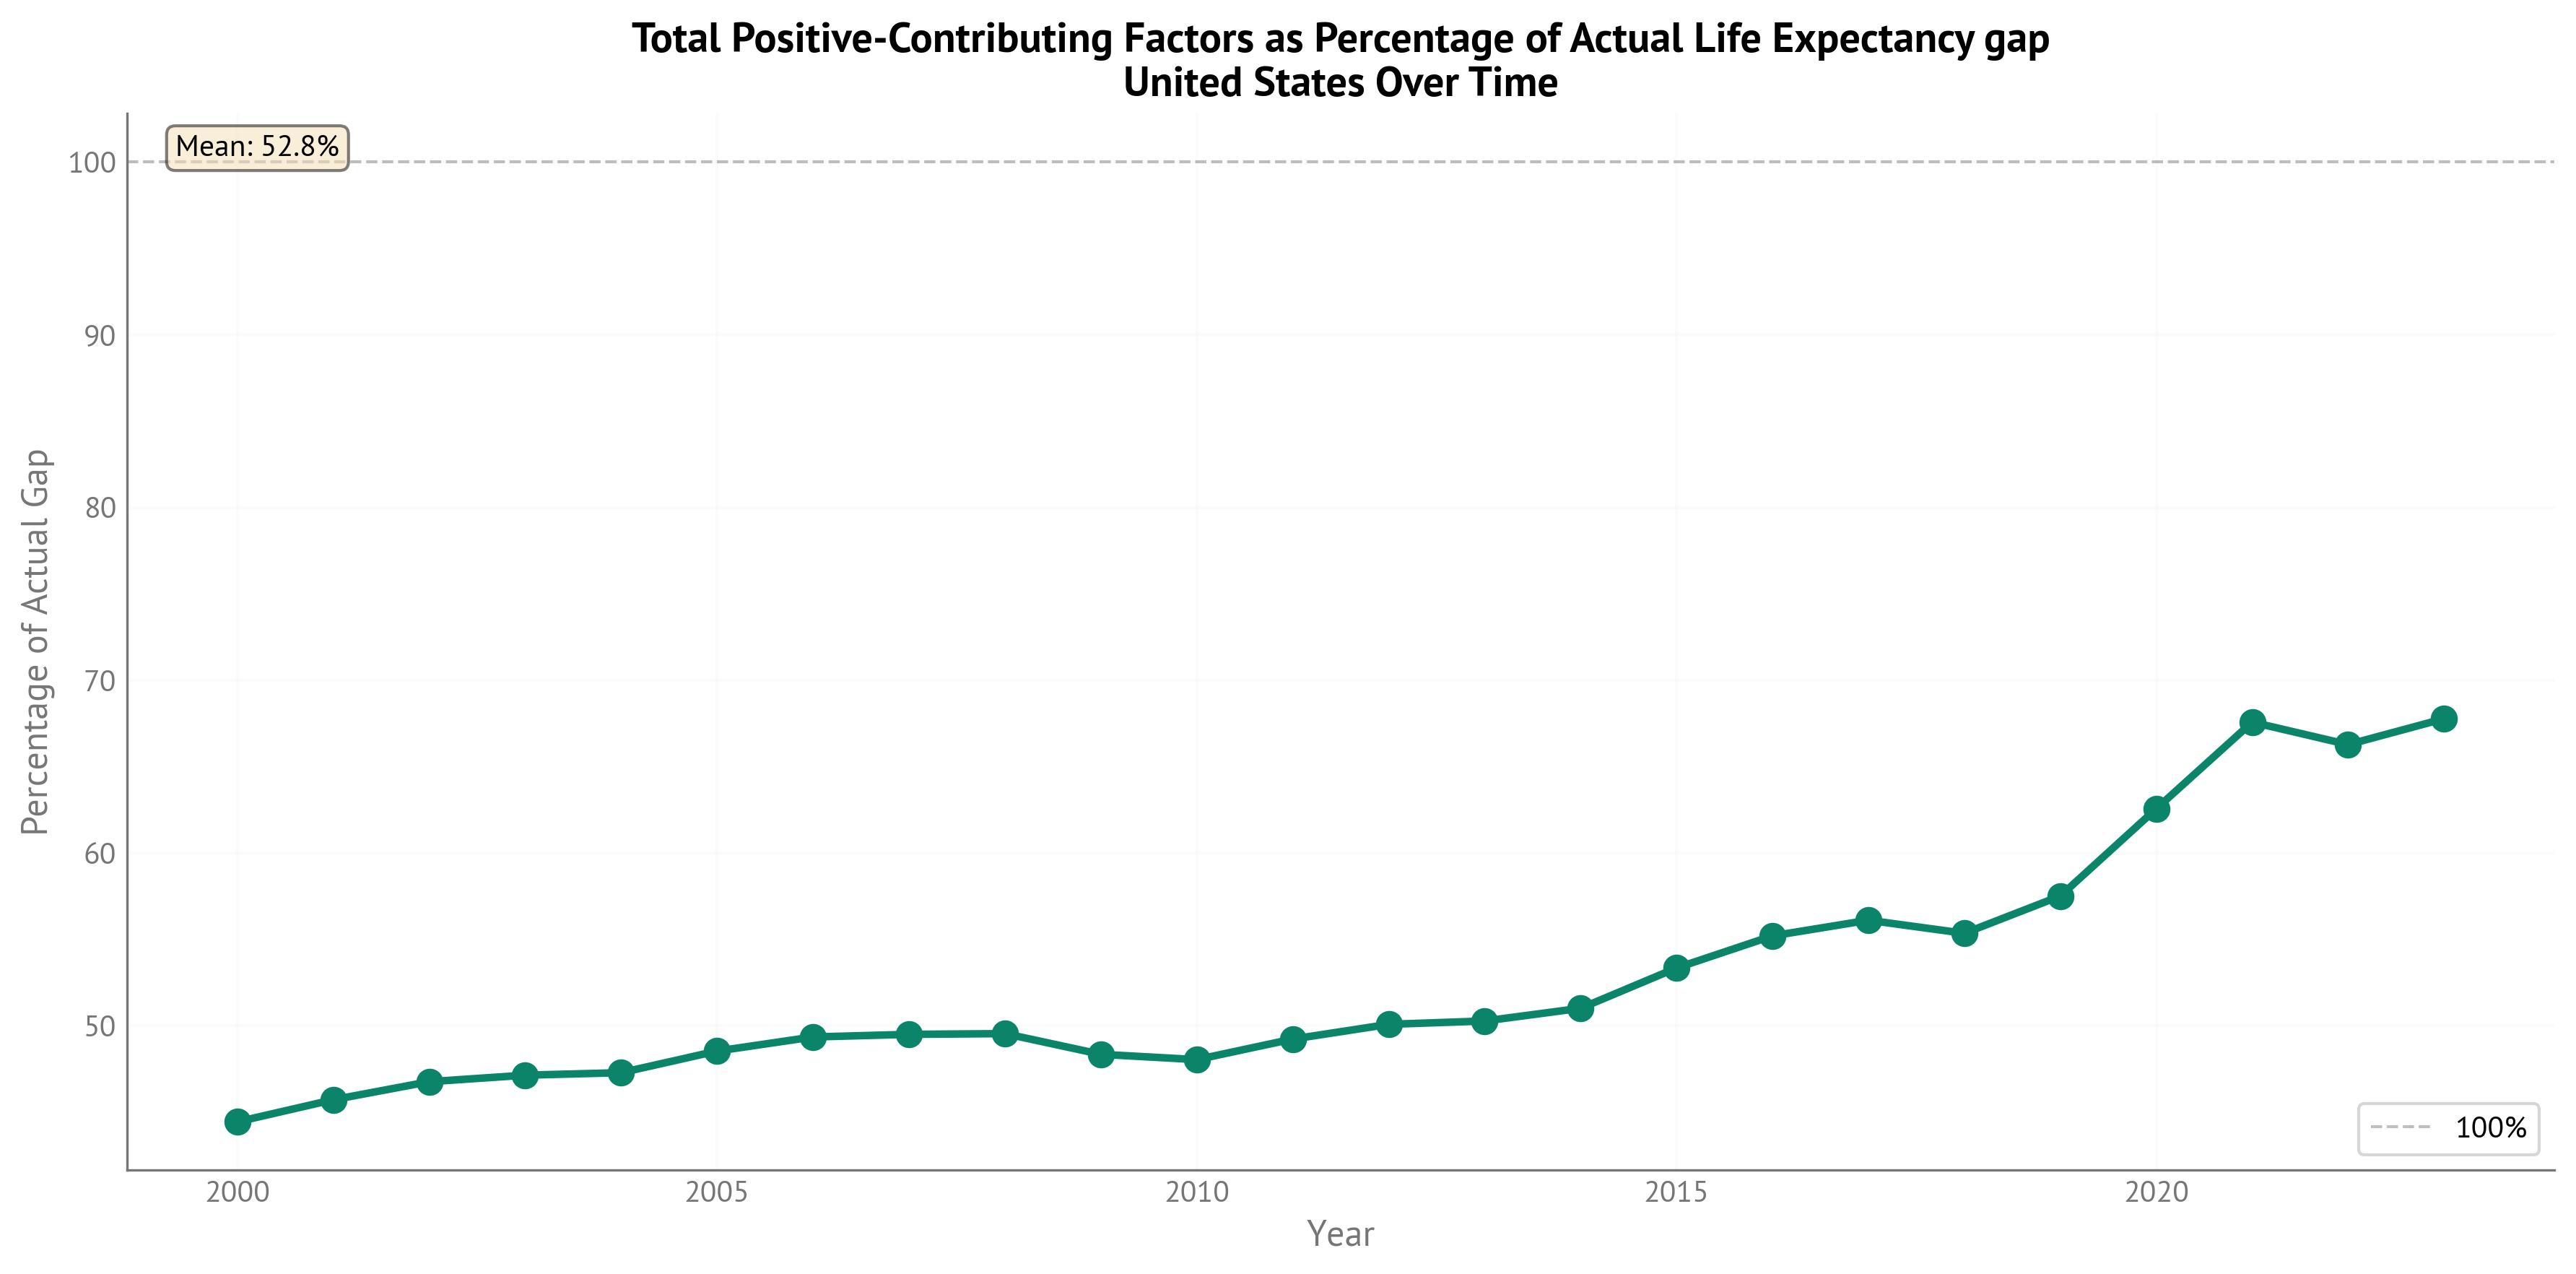
Figure 12:Percentage of actual Life Expectancy gap explained by positive-contributing (gap-closing) factors over time through 2023.
Conclusions
Key Findings
Successful Data Source Transition: The switch from WHO HALE to IHME HALE was successful, maintaining methodological consistency with all predictor variables while extending temporal coverage to 2023.
Extended COVID-19 Period: Including 2022-2023 data shows that COVID-19’s effect on gender gaps persisted into the post-acute phase, with a small but consistent positive coefficient (β = 0.060).
Coefficient Stability with Notable Shifts: Most coefficients remained stable when switching data sources, but three showed substantial changes:
Neoplasms decreased (-0.112): Cancer gaps may be less important in IHME data or evolved 2021-2023
Homicide decreased (-0.075): Violence gaps may be narrowing or measured differently
Chronic Respiratory increased (+0.067): Respiratory disease gaps became more important, possibly due to COVID-19’s long-term effects
Diabetes Coefficient Nearly Identical: The diabetes coefficient was virtually unchanged (β = -0.129 → -0.130), demonstrating a remarkably robust competing-risk relationship across data sources.
Model Performance: Both IHME-based HALE and OWID-based LE models achieve excellent fit (R² > 0.98), explaining nearly all systematic variation in gender gaps across all country-years.
Aligned Temporal Coverage: Both models now span 2000-2023 with 888 observations each, enabling direct comparison of HALE vs LE gap drivers throughout the full COVID period and post-acute recovery phase.
Advantages of IHME HALE and OWID LE Data
IHME HALE:
Methodological Consistency: All variables (HALE and predictors) come from the same IHME GBD methodology
Extended Temporal Range: Two additional years (2022-2023) beyond WHO capture post-acute COVID dynamics
No Extreme Outliers: Unlike WHO data (Israel 2021), IHME data showed no extreme residuals
Maintained Quality: High correlation with WHO HALE (r > 0.95) confirms data quality
OWID LE:
Extended Temporal Coverage: Extends through 2023, matching IHME HALE temporal range (vs 2021 for WHO LE)
Complete OECD Coverage: 100% complete data for all 38 OECD countries including Turkey
High-Quality Sources: Combines authoritative data from Human Mortality Database and UN World Population Prospects
Validated Quality: High correlation with WHO LE (r = 0.993) confirms excellent agreement
Temporal Alignment: Both HALE and LE models now span identical time periods (2000-2023)
Limitations and Future Work
Data Source Differences: Some coefficient changes may reflect methodological differences between WHO HALE and IHME HALE rather than temporal evolution. Similarly, OWID LE combines multiple sources (HMD + UN WPP) vs WHO’s direct estimates. Future work could decompose these methodological effects.
Limited Post-COVID Data: Only 4 years of COVID data (2020-2023) limits assessment of long-term pandemic effects. As more post-2023 data becomes available, tracking whether coefficient shifts persist will be valuable.
Turkey Exclusion: Turkey is excluded from this analysis because it was identified as an outlier with very low likelihood in the Bayesian model. This decision was made based on model diagnostics, not data availability.
OWID vs WHO LE Comparison: OWID LE shows high correlation with WHO LE (r = 0.993) but some country-year combinations differ by up to 3 years. Most differences are within expected bounds for different estimation methodologies.
Recommendations
Continue with IHME HALE: Maintain IHME HALE as the primary target for future analyses to ensure methodological consistency with IHME predictors and maximize temporal coverage.
Continue with OWID LE: Use OWID LE data for extended temporal coverage matching IHME HALE. The high correlation with WHO LE (r = 0.993) confirms data quality while providing the advantage of complete temporal alignment.
Monitor Coefficient Evolution: As more post-2023 data becomes available, track whether the coefficient shifts (especially Neoplasms and Chronic Respiratory) represent lasting changes or transient effects.
Update Annually: As IHME updates its GBD database and OWID incorporates new UN WPP data, rerun models to incorporate new data and assess temporal stability.
Investigate Respiratory Disease: The increased importance of chronic respiratory disease gaps warrants further investigation, particularly regarding COVID-19’s long-term respiratory effects through 2023.
COVID-19 Effect Monitoring: The larger COVID effect in LE (β = 0.108) vs HALE (β = 0.060) suggests pandemic impacts on lifespan exceeded impacts on healthy lifespan. Monitor whether this pattern persists or changes in future years.
Age-Dependent Effects: Counterfactual analysis reveals that causes affecting younger individuals (drug disorders, homicide) have larger effects on LE than HALE, while competing-risk causes in older age (diabetes, cardiovascular) have larger effects on HALE than LE. This pattern provides insights into how different causes affect lifespan vs healthy lifespan across the life course.