Recent generations of Americans are on track to have fewer children than previous generations. Based on projections from a Bayesian model, cohorts born in the 2000s could end up with fewer than 1 child per woman on average—a level of fertility comparable to present-day South Korea.
The following figure shows the results from the model for US women born from 1920 to 2009, along with observed cohort fertility rates (CFR) from Census data.
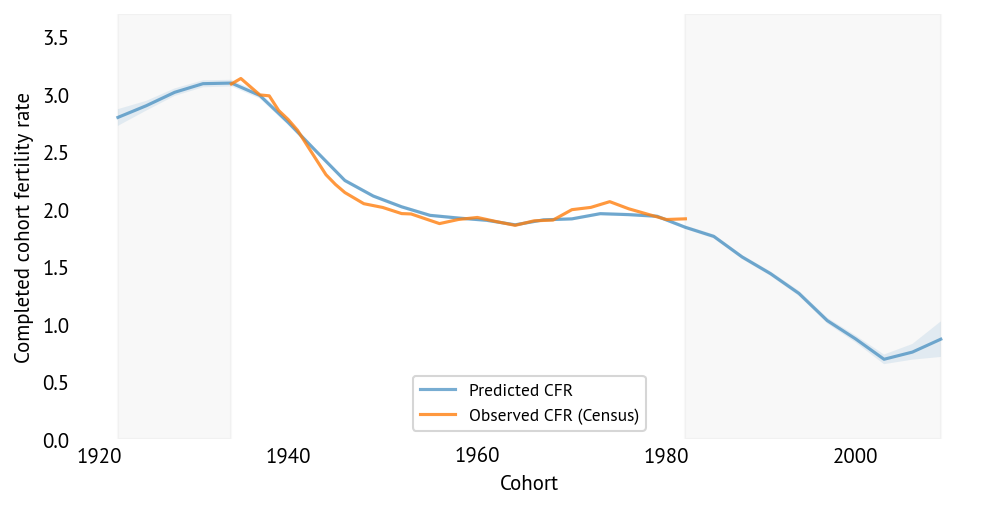
Fertility peaked with the cohort born in 1934, who had 3.1 children per woman.
The cohort born in 1980 have 1.9 children on average, having reached the end of their childbearing years.
Women born in 1990 might have 1.4 children on average, based on data up to age 34 and the model’s projections.
Women born in 2000 might have only 0.9 children on average, based on data up to age 24 and projections.
The shaded area is a credible interval for the projections, showing increasing uncertainty for the youngest cohorts.
For cohorts who have completed their childbearing, we can compare the model’s retrodictions to data from the CPS Fertility Supplement. The agreement is very good.
Note that this figure shows completed cohort fertility rates (CFR), not total fertility rates (TFR). This article explains the difference.
How the Model Works
These projections are based on a Bayesian hierarchical model that uses data from the CPS Fertility Supplement, which includes 1.17 million women observed during 1976-2024 at ages 15-54. The model estimates two sets of parameters:
Cohort effects (α): For each 3-year cohort group, this parameter quantifies overall fertility level.
Age effects (β): For each 3-year age group, this parameter quantifies age-specific fertility.
The model uses a log-linear structure:
where is the expected birth rate for cohort at age (Poisson intensity, births per woman-year). The parameters are on a log scale, so they’re not easy to interpret in absolute terms. But we can understand them as differences in fertility between groups.
Cohort and age effects
The next figure shows the cohort effects—that is, a fertility level for each generation.
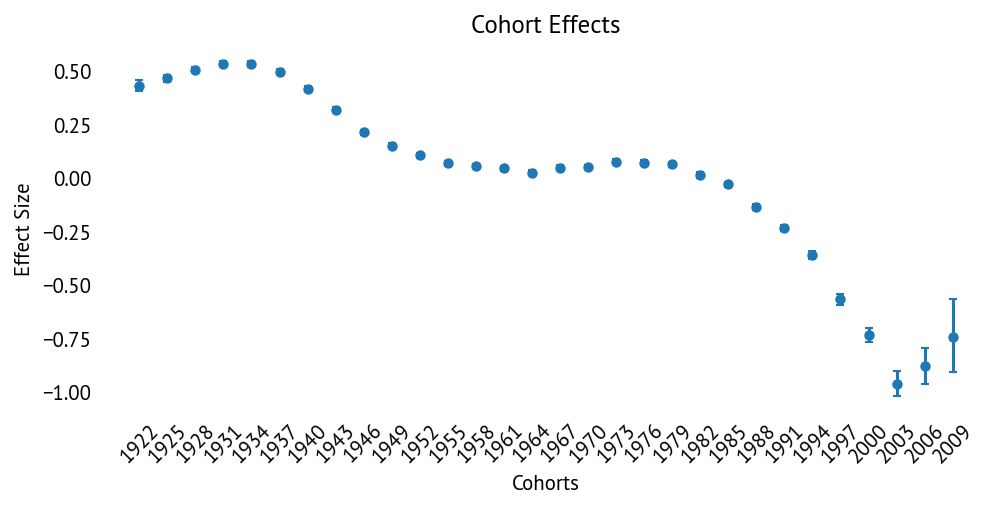
The cohort effects capture the overall fertility level for each generation.
Fertility was highest among the cohorts born between 1925 and 1940, who were the parents of the Baby Boomers.
Fertility was lower but mostly unchanged among cohorts born between 1950 and 1985.
Estimated fertility declines substantially among cohorts born after 1985.
But for the youngest cohorts we have limited data. For example, the cohort born in 2000 has been observed at ages 15-24, covering just one-third of their reproductive span. The last cohort, born in 2009, has been observed only at age 15, which provides minimal information about their future fertility.
Projections for these cohorts rely on the model’s assumptions, not just on observed data. For cohort effects, the model uses a Gaussian random walk, which assumes each cohort will be similar to the previous one unless there is evidence of a change.
For generations where we have complete data, we can estimate these changes precisely. Where we have less data, the random walk levels out -- so it doesn’t extrapolate the trend or assume it will reverse -- and becomes more uncertain.
The next figure shows the age effects—the typical age pattern of childbearing.
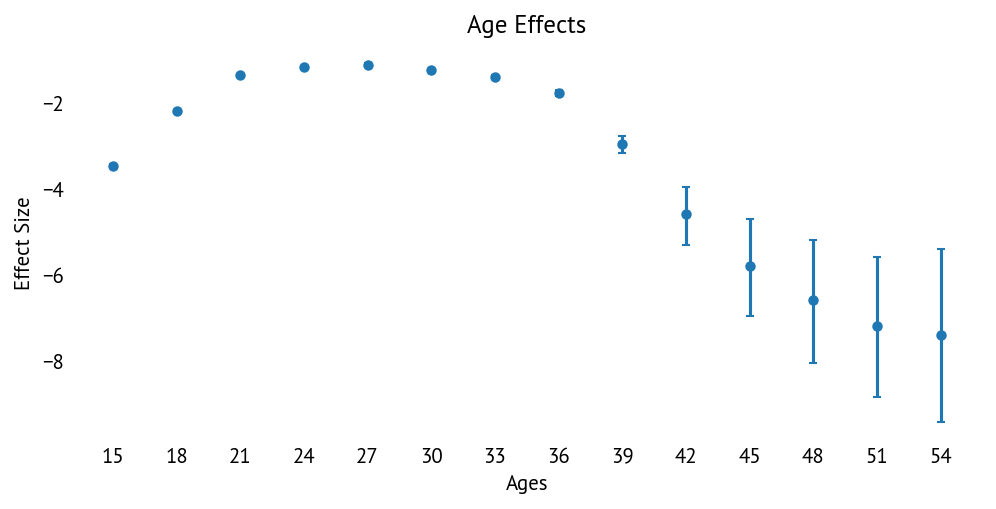
The age effects show that fertility peaks in the mid-20s and declines thereafter. The age effects are also based on a random walk, so where we have limited data, the estimates level off and become more uncertain.
By combining cohort and age effects, we can project lifetime fertility for cohorts still in their reproductive years.
Model Extensions
The previous version of the model (v3) does not take into account timing effects -- that is, whether a given cohort has children earlier or later than the typical age pattern.
I also tested an extended version (v4) that adds a timing parameter (γ):
where is a cohort-specific parameter that tilts the age-fertility curve. Positive values of mean delayed childbearing (fertility shifts to older ages), while negative values mean earlier childbearing (fertility shifts to younger ages).
The extended model fits the data better, but the projections it produces are not substantially different. The following figure shows the differences.
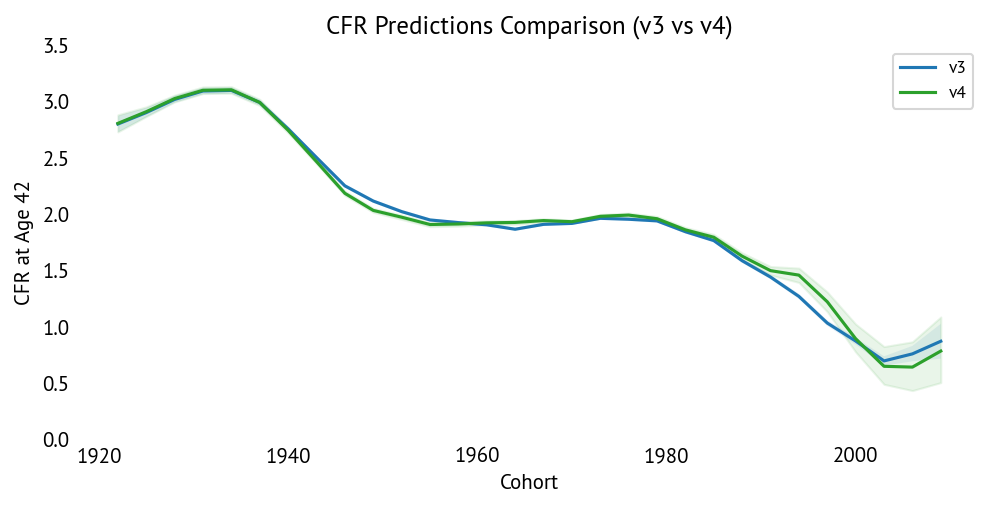
Details of the extended model are in the Technical Report.
Summary
Using a Bayesian model and nearly 50 years of fertility data, we can project cohort fertility rates for generations still in their reproductive years. The model predicts imminent declines to unprecedented levels.
These projections should be interpreted as “what we expect if recent patterns persist.” Of course, decisions about childbearing respond to changing circumstances -- but demographic trends have momentum. They don’t reverse quickly or easily. Unless something changes substantially and soon, US fertility is heading for historic lows.
Possible Objections and Responses
Objection: CPS fertility data undercounts births, especially among disadvantaged groups.
Response: This analysis uses the CPS variable “children ever born” (FREVER), which records cumulative parity rather than recent birth events. Parity is generally reported accurately at all ages, especially compared to annual birth measures.
Objection: You are assuming recent fertility declines will continue indefinitely.
Response: The model does not impose a continued decline. Cohort effects are modeled as a Gaussian random walk, which assumes that each cohort is the same as the previous one unless there is evidence of change. Where we have little data, the random walk levels out -- so it doesn’t extrapolate the trend or assume it will reverse.
Objection: Fertility timing has shifted later; these cohorts may still “catch up.”
Response: The extended model (v4) includes cohort-specific timing shifts. It fits the data better, but produces similar completed fertility projections. Nevertheless, if conditions change in ways that increase fertility, the most recent generations could catch up, at least in part.
Objection: Is age 42 really the end of childbearing years? Fertility at older ages might increase due to improvements in reproductive technology.
Response: The model estimates age effects up to age 54, but uses age 42 (midpoint of the 40-44 range) as the endpoint for CFR calculations, consistent with common demographic practice. While fertility at older ages has increased, births to women over 42 are a small fraction of total fertility. Even large relative increases in older-age fertility would have a small effect on overall CFR.
Objection: Immigration could raise future fertility.
Response: The model includes immigrants who were in the US when surveyed—their fertility is part of the cohort CFR for their birth year. Future immigration could raise overall fertility through compositional changes, if immigrants have higher fertility than natives. However, immigrant fertility in the US has declined, and second-generation fertility converges toward native-born levels. So even with increased immigration, if current trends continue, the compositional effect might be limited. Large, sustained changes in immigration patterns and immigrant fertility would be required to materially change the projections.
Objection: Economic or policy changes (childcare, housing, parental leave) could reverse the trend.
Response: That is possible. The projections should be interpreted as conditional on current conditions persisting. But demographic trends exhibit inertia, and historically, large fertility reversals have been slow and rare even in the presence of policy interventions.
Objection: A log-linear age–cohort model is too simple to capture fertility dynamics.
Response: The model is validated on cohorts with completed fertility. The extended model improves in-sample fit but does not materially change the projections for completed cohort fertility. But it’s always possible that a more complex model would capture additional effects and produce different projections.
Objection: CFR below 1 is implausibly low.
Response: CFR measures the average number of children per woman across the entire cohort, including women with no children. CFRs below 1 are already observed in several high-income countries, including South Korea, so they are demographically feasible.
Objection: Survey weighting via resampling is ad hoc.
Response: Resampling using survey weights is a standard approximation for incorporating complex survey designs in Bayesian models. The approach is documented in the technical report, and validation against external Census data suggests it performs well for this application.
DATA AND METHODS: The analysis uses CPS Fertility Supplement data from 1976-2024, covering 1.17 million women aged 15-54. The model is a Bayesian hierarchical log-linear model with Gaussian random walk priors, fit using PyMC. The model accounts for survey weights by resampling and was validated against historical cohort fertility tables. All code and notebooks are available at github
January 2026