You can order print and ebook versions of Think Bayes 2e from Bookshop.org and Amazon.
Comparing birth rates#
Here’s an exercise that was in a draft of Think Bayes, but I ended up cutting it.
Exercise: Two doctors fresh out of medical school are arguing about whose hospital delivers more babies. The first doctor says, “I’ve been at Hospital A for one week, and already we’ve had a day when we delivered 19 babies.”
The second doctor says, “I’ve been at Hospital B for two weeks, and already there’s been a 20-baby day.”
Which hospital do you think delivers more babies on average? You can assume that the number of babies born in a day is well modeled by a Poisson distribution with parameter \(\lambda\), which is the Greek letter pronounced “lambda”.
The following function computes the PMF of a Poisson distribution with parameter lam over a range of integers, qs:
from empiricaldist import Pmf
from scipy.stats import poisson

def make_poisson_pmf(lam, qs):
    """Make a PMF of a Poisson distribution.

    lam: event rate
    qs: sequence of values for `k`

    returns: Pmf
    """
    ps = poisson(lam).pmf(qs)
    pmf = Pmf(ps, qs)
    pmf.normalize()
    return pmf
For example, if the actual value of \(\lambda\) is 8, we can compute the distribution of babies born in a single day like this:
import numpy as np

lam = 8
qs = np.arange(24)
pmf = make_poisson_pmf(lam, qs)
And here’s what it looks like.
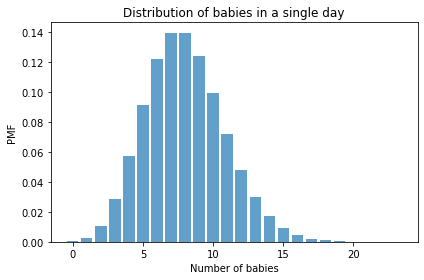
The mean of this distribution is the parameter, \(\lambda\).
pmf.mean()
7.999938721091352
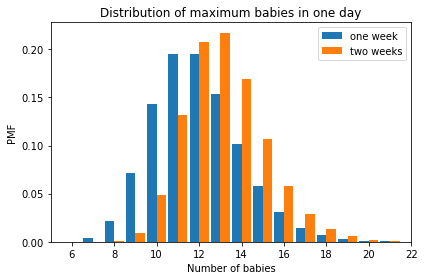
And here’s what the distributions look like for the maximum number of babies after one week or two weeks.
pmf_max1 = pmf.max_dist(7)
pmf_max1.bar(label='one week', align='edge', width=-0.45)

pmf_max2 = pmf.max_dist(2 * 7)
pmf_max2.bar(label='two weeks', align='edge', width=0.45)

decorate(xlabel='Number of babies',
         xlim=[5, 22],
         ylabel='PMF',
         title='Distribution of maximum babies in one day')
Now you finish it off from there.
# Solution

# Here's a prior distribution for the values of lamdba

hypos = np.linspace(0, 25, 101)
prior = Pmf(1, hypos)
# Solution

# Here's the likelihood of the data for each hypothetical
# value of lambda, for the doctor who reported the maximum
# number of babies in one week

days = 1 * 7      # one week
data = 19         # maximum of 19 babies

likelihood1 = [make_poisson_pmf(hypo, qs).max_dist(days)(data)
               for hypo in hypos]
# Solution

# And here's the first posterior distribution

posterior1 = prior * likelihood1
posterior1.normalize()
4.201483589848796
# Solution

# Here's the likelihood for the doctor who reported the
# maximum number of babies in two weeks.

days = 2 * 7
data = 20

likelihood2 = [make_poisson_pmf(hypo, qs).max_dist(days)(data)
               for hypo in hypos]
# Solution

# And here's the second posterior

posterior2 = prior * likelihood2
posterior2.normalize()
4.259983296308155
# Solution

# And here's what the two posterior distributions look like

posterior1.plot(label='A, one week, 19 babies max')
posterior2.plot(label='B, two weeks, 20 babies max')

decorate(xlabel='Average babies per day (lambda)',
         ylabel='PDF',
         title='Posterior distribution of the parameter lambda')
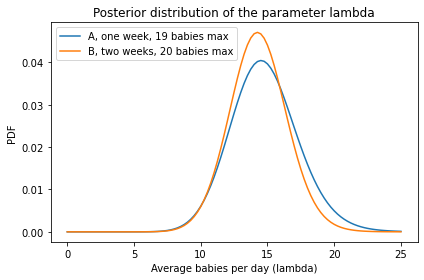
# Solution

# The posterior mean is a little higher for hospital A,
# based on one week of data and a slightly lower maximum

posterior1.mean(), posterior2.mean()
(14.794330239819137, 14.327038448986379)
# And here's the probability that the birth rate is
# higher in Hospital A

posterior1.gt_dist(posterior2) + posterior1.eq_dist(posterior2) / 2
0.5511810168369614