You can order print and ebook versions of Think Bayes 2e from Bookshop.org and Amazon.
9. Decision Analysis#
This chapter presents a problem inspired by the game show The Price is Right. It is a silly example, but it demonstrates a useful process called Bayesian decision analysis.
As in previous examples, we’ll use data and prior distribution to compute a posterior distribution; then we’ll use the posterior distribution to choose an optimal strategy in a game that involves bidding.
As part of the solution, we will use kernel density estimation (KDE) to estimate the prior distribution, and a normal distribution to compute the likelihood of the data.
And at the end of the chapter, I pose a related problem you can solve as an exercise.
9.1. The Price Is Right Problem#
On November 1, 2007, contestants named Letia and Nathaniel appeared on The Price is Right, an American television game show. They competed in a game called “The Showcase”, where the objective is to guess the price of a collection of prizes. The contestant who comes closest to the actual price, without going over, wins the prizes.
Nathaniel went first. His showcase included a dishwasher, a wine cabinet, a laptop computer, and a car. He bid \$26,000.
Letia’s showcase included a pinball machine, a video arcade game, a pool table, and a cruise of the Bahamas. She bid \$21,500.
The actual price of Nathaniel’s showcase was \$25,347. His bid was too high, so he lost.
The actual price of Letia’s showcase was \$21,578.
She was only off by \$78, so she won her showcase and, because her bid was off by less than 250, she also won Nathaniel’s showcase.
For a Bayesian thinker, this scenario suggests several questions:
Before seeing the prizes, what prior beliefs should the contestants have about the price of the showcase?
After seeing the prizes, how should the contestants update those beliefs?
Based on the posterior distribution, what should the contestants bid?
The third question demonstrates a common use of Bayesian methods: decision analysis.
This problem is inspired by an example in Cameron Davidson-Pilon’s book, Probablistic Programming and Bayesian Methods for Hackers.
9.2. The Prior#
To choose a prior distribution of prices, we can take advantage of data from previous episodes. Fortunately, fans of the show keep detailed records.
For this example, I downloaded files containing the price of each showcase from the 2011 and 2012 seasons and the bids offered by the contestants.
The following function reads the data and cleans it up a little.
import pandas as pd

def read_data(filename):
    """Read the showcase price data."""
    df = pd.read_csv(filename, index_col=0, skiprows=[1])
    return df.dropna().transpose()
I’ll read both files and concatenate them.
df2011 = read_data('showcases.2011.csv')
df2012 = read_data('showcases.2012.csv')

df = pd.concat([df2011, df2012], ignore_index=True)
Here’s what the dataset looks like:
df.head(3)
| Showcase 1 | Showcase 2 | Bid 1 | Bid 2 | Difference 1 | Difference 2 | |
|---|---|---|---|---|---|---|
| 0 | 50969.0 | 45429.0 | 42000.0 | 34000.0 | 8969.0 | 11429.0 |
| 1 | 21901.0 | 34061.0 | 14000.0 | 59900.0 | 7901.0 | -25839.0 |
| 2 | 32815.0 | 53186.0 | 32000.0 | 45000.0 | 815.0 | 8186.0 |
The first two columns, Showcase 1 and Showcase 2, are the values of the showcases in dollars.
The next two columns are the bids the contestants made.
The last two columns are the differences between the actual values and the bids.
9.3. Kernel Density Estimation#
This dataset contains the prices for 313 previous showcases, which we can think of as a sample from the population of possible prices.
We can use this sample to estimate the prior distribution of showcase prices. One way to do that is kernel density estimation (KDE), which uses the sample to estimate a smooth distribution. If you are not familiar with KDE, you can read about it here.
SciPy provides gaussian_kde, which takes a sample and returns an object that represents the estimated distribution.
The following function takes sample, makes a KDE, evaluates it at a given sequence of quantities, qs, and returns the result as a normalized PMF.
from scipy.stats import gaussian_kde
from empiricaldist import Pmf

def kde_from_sample(sample, qs):
    """Make a kernel density estimate from a sample."""
    kde = gaussian_kde(sample)
    ps = kde(qs)
    pmf = Pmf(ps, qs)
    pmf.normalize()
    return pmf
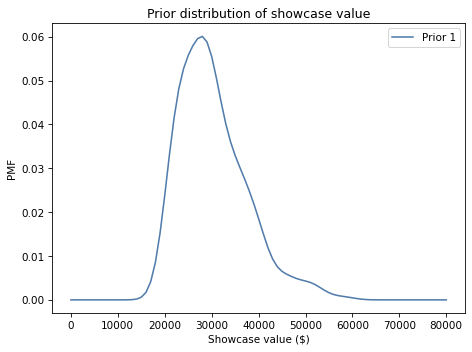
We can use it to estimate the distribution of values for Showcase 1:
import numpy as np

qs = np.linspace(0, 80000, 81)
prior1 = kde_from_sample(df['Showcase 1'], qs)
Here’s what it looks like:
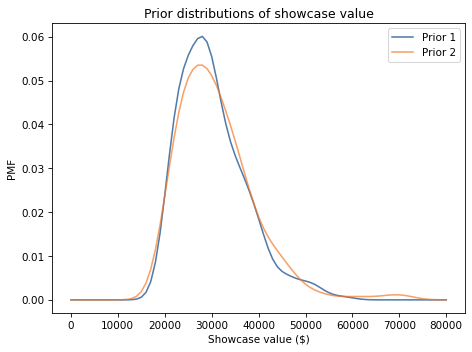
Exercise: Use this function to make a Pmf that represents the prior distribution for Showcase 2, and plot it.
9.4. Distribution of Error#
To update these priors, we have to answer these questions:
What data should we consider and how should we quantify it?
Can we compute a likelihood function; that is, for each hypothetical price, can we compute the conditional likelihood of the data?
To answer these questions, I will model each contestant as a price-guessing instrument with known error characteristics.
In this model, when the contestant sees the prizes, they guess the price of each prize and add up the prices.
Let’s call this total guess.
Now the question we have to answer is, “If the actual price is price, what is the likelihood that the contestant’s guess would be guess?”
Equivalently, if we define error = guess - price, we can ask, “What is the likelihood that the contestant’s guess is off by error?”
To answer this question, I’ll use the historical data again. For each showcase in the dataset, let’s look at the difference between the contestant’s bid and the actual price:
sample_diff1 = df['Bid 1'] - df['Showcase 1']
sample_diff2 = df['Bid 2'] - df['Showcase 2']
To visualize the distribution of these differences, we can use KDE again.
qs = np.linspace(-40000, 20000, 61)
kde_diff1 = kde_from_sample(sample_diff1, qs)
kde_diff2 = kde_from_sample(sample_diff2, qs)
Here’s what these distributions look like:
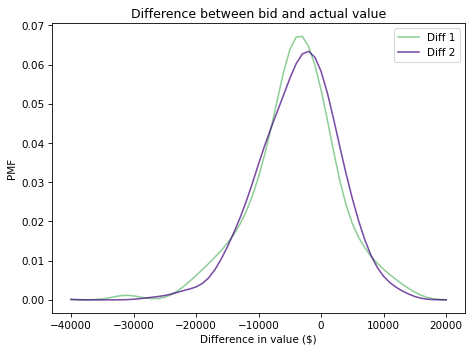
It looks like the bids are too low more often than too high, which makes sense. Remember that under the rules of the game, you lose if you overbid, so contestants probably underbid to some degree deliberately.
For example, if they guess that the value of the showcase is \\(40,000, they might bid \\\)36,000 to avoid going over.
It looks like these distributions are well modeled by a normal distribution, so we can summarize them with their mean and standard deviation.
For example, here is the mean and standard deviation of Diff for Player 1.
mean_diff1 = sample_diff1.mean()
std_diff1 = sample_diff1.std()

print(mean_diff1, std_diff1)
-4116.3961661341855 6899.909806377117
Now we can use these differences to model the contestant’s distribution of errors. This step is a little tricky because we don’t actually know the contestant’s guesses; we only know what they bid.
So we have to make some assumptions:
I’ll assume that contestants underbid because they are being strategic, and that on average their guesses are accurate. In other words, the mean of their errors is 0.
But I’ll assume that the spread of the differences reflects the actual spread of their errors. So, I’ll use the standard deviation of the differences as the standard deviation of their errors.
Based on these assumptions, I’ll make a normal distribution with parameters 0 and std_diff1.
SciPy provides an object called norm that represents a normal distribution with the given mean and standard deviation.
from scipy.stats import norm

error_dist1 = norm(0, std_diff1)
The result is an object that provides pdf, which evaluates the probability density function of the normal distribution.
For example, here is the probability density of error=-100, based on the distribution of errors for Player 1.
error = -100
error_dist1.pdf(error)
5.781240564008691e-05
By itself, this number doesn’t mean very much, because probability densities are not probabilities. But they are proportional to probabilities, so we can use them as likelihoods in a Bayesian update, as we’ll see in the next section.
9.5. Update#
Suppose you are Player 1. You see the prizes in your showcase and your guess for the total price is \$23,000.
From your guess I will subtract away each hypothetical price in the prior distribution; the result is your error under each hypothesis.
guess1 = 23000
error1 = guess1 - prior1.qs
Now suppose we know, based on past performance, that your estimation error is well modeled by error_dist1.
Under that assumption we can compute the likelihood of your error under each hypothesis.
likelihood1 = error_dist1.pdf(error1)
The result is an array of likelihoods, which we can use to update the prior.
posterior1 = prior1 * likelihood1
posterior1.normalize()
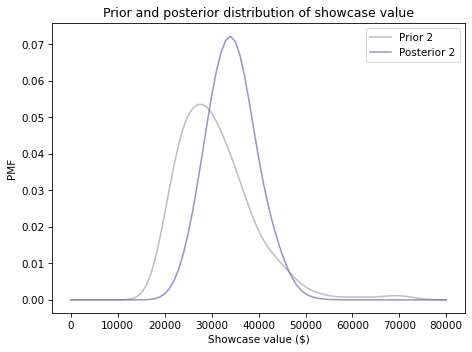
Here’s what the posterior distribution looks like:
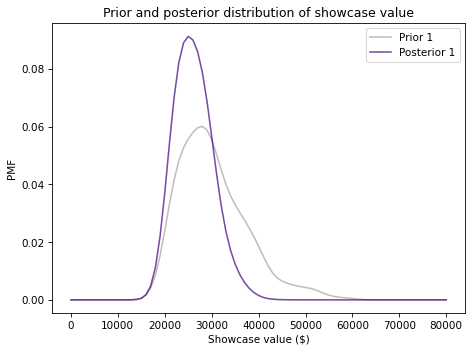
Because your initial guess is in the lower end of the range, the posterior distribution has shifted to the left. We can compute the posterior mean to see by how much.
prior1.mean(), posterior1.mean()
(30299.488817891375, 26192.024002392536)
Before you saw the prizes, you expected to see a showcase with a value close to \\(30,000. After making a guess of \\\)23,000, you updated the prior distribution. Based on the combination of the prior and your guess, you now expect the actual price to be about \$26,000.
Exercise: Now suppose you are Player 2. When you see your showcase, you guess that the total price is \$38,000.
Use diff2 to construct a normal distribution that represents the distribution of your estimation errors.
Compute the likelihood of your guess for each actual price and use it to update prior2.
Plot the posterior distribution and compute the posterior mean. Based on the prior and your guess, what do you expect the actual price of the showcase to be?
9.6. Probability of Winning#
Now that we have a posterior distribution for each player, let’s think about strategy.
First, from the point of view of Player 1, let’s compute the probability that Player 2 overbids. To keep it simple, I’ll use only the performance of past players, ignoring the value of the showcase.
The following function takes a sequence of past bids and returns the fraction that overbid.
def prob_overbid(sample_diff):
    """Compute the probability of an overbid."""
    return np.mean(sample_diff > 0)
Here’s an estimate for the probability that Player 2 overbids.
prob_overbid(sample_diff2)
0.29073482428115016
Now suppose Player 1 underbids by \$5000. What is the probability that Player 2 underbids by more?
The following function uses past performance to estimate the probability that a player underbids by more than a given amount, diff:
def prob_worse_than(diff, sample_diff):
    """Probability opponent diff is worse than given diff."""
    return np.mean(sample_diff < diff)
Here’s the probability that Player 2 underbids by more than \$5000.
prob_worse_than(-5000, sample_diff2)
0.38338658146964855
And here’s the probability they underbid by more than \$10,000.
prob_worse_than(-10000, sample_diff2)
0.14376996805111822
We can combine these functions to compute the probability that Player 1 wins, given the difference between their bid and the actual price:
def compute_prob_win(diff, sample_diff):
    """Probability of winning for a given diff."""
    # if you overbid you lose
    if diff > 0:
        return 0

    # if the opponent overbids, you win
    p1 = prob_overbid(sample_diff)

    # or of their bid is worse than yours, you win
    p2 = prob_worse_than(diff, sample_diff)

    # p1 and p2 are mutually exclusive, so we can add them
    return p1 + p2
Here’s the probability that you win, given that you underbid by \$5000.
compute_prob_win(-5000, sample_diff2)
0.6741214057507987
Now let’s look at the probability of winning for a range of possible differences.
xs = np.linspace(-30000, 5000, 121)
ys = [compute_prob_win(x, sample_diff2)
      for x in xs]
Here’s what it looks like:
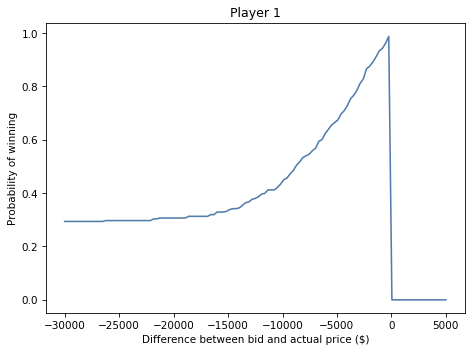
If you underbid by \$30,000, the chance of winning is about 30%, which is mostly the chance your opponent overbids.
As your bids gets closer to the actual price, your chance of winning approaches 1.
And, of course, if you overbid, you lose (even if your opponent also overbids).
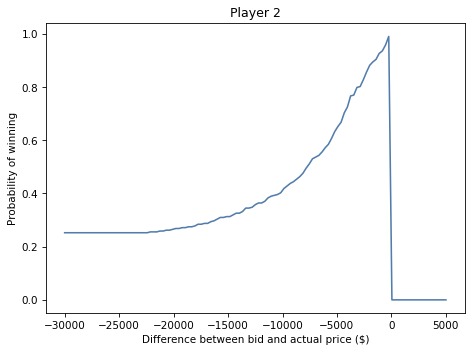
Exercise: Run the same analysis from the point of view of Player 2. Using the sample of differences from Player 1, compute:
The probability that Player 1 overbids.
The probability that Player 1 underbids by more than \$5000.
The probability that Player 2 wins, given that they underbid by \$5000.
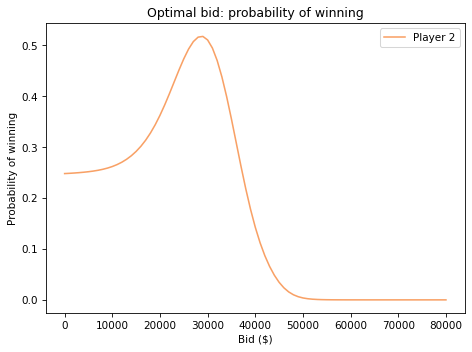
Then plot the probability that Player 2 wins for a range of possible differences between their bid and the actual price.
9.7. Decision Analysis#
In the previous section we computed the probability of winning, given that we have underbid by a particular amount.
In reality the contestants don’t know how much they have underbid by, because they don’t know the actual price.
But they do have a posterior distribution that represents their beliefs about the actual price, and they can use that to estimate their probability of winning with a given bid.
The following function takes a possible bid, a posterior distribution of actual prices, and a sample of differences for the opponent.
It loops through the hypothetical prices in the posterior distribution and, for each price,
Computes the difference between the bid and the hypothetical price,
Computes the probability that the player wins, given that difference, and
Adds up the weighted sum of the probabilities, where the weights are the probabilities in the posterior distribution.
def total_prob_win(bid, posterior, sample_diff):
    """Computes the total probability of winning with a given bid.

    bid: your bid
    posterior: Pmf of showcase value
    sample_diff: sequence of differences for the opponent

    returns: probability of winning
    """
    total = 0
    for price, prob in posterior.items():
        diff = bid - price
        total += prob * compute_prob_win(diff, sample_diff)
    return total
This loop implements the law of total probability:
Here’s the probability that Player 1 wins, based on a bid of \$25,000 and the posterior distribution posterior1.
total_prob_win(25000, posterior1, sample_diff2)
0.4842210945439812
Now we can loop through a series of possible bids and compute the probability of winning for each one.
bids = posterior1.qs

probs = [total_prob_win(bid, posterior1, sample_diff2)
         for bid in bids]

prob_win_series = pd.Series(probs, index=bids)
Here are the results.
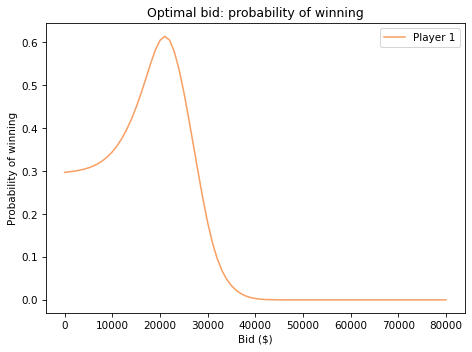
And here’s the bid that maximizes Player 1’s chance of winning.
prob_win_series.idxmax()
21000.0
prob_win_series.max()
0.6136807192359474
Recall that your guess was \\(23,000. Using your guess to compute the posterior distribution, the posterior mean is about \\\)26,000. But the bid that maximizes your chance of winning is \$21,000.
Exercise: Do the same analysis for Player 2.
9.8. Maximizing Expected Gain#
In the previous section we computed the bid that maximizes your chance of winning. And if that’s your goal, the bid we computed is optimal.
But winning isn’t everything. Remember that if your bid is off by \$250 or less, you win both showcases. So it might be a good idea to increase your bid a little: it increases the chance you overbid and lose, but it also increases the chance of winning both showcases.
Let’s see how that works out. The following function computes how much you will win, on average, given your bid, the actual price, and a sample of errors for your opponent.
def compute_gain(bid, price, sample_diff):
    """Compute expected gain given a bid and actual price."""
    diff = bid - price
    prob = compute_prob_win(diff, sample_diff)

    # if you are within 250 dollars, you win both showcases
    if -250 <= diff <= 0:
        return 2 * price * prob
    else:
        return price * prob
For example, if the actual price is \\(35000 and you bid \\\)30000, you will win about \$23,600 worth of prizes on average, taking into account your probability of losing, winning one showcase, or winning both.
compute_gain(30000, 35000, sample_diff2)
23594.249201277955
In reality we don’t know the actual price, but we have a posterior distribution that represents what we know about it. By averaging over the prices and probabilities in the posterior distribution, we can compute the expected gain for a particular bid.
In this context, “expected” means the average over the possible showcase values, weighted by their probabilities.
def expected_gain(bid, posterior, sample_diff):
    """Compute the expected gain of a given bid."""
    total = 0
    for price, prob in posterior.items():
        total += prob * compute_gain(bid, price, sample_diff)
    return total
For the posterior we computed earlier, based on a guess of \\(23,000, the expected gain for a bid of \\\)21,000 is about \$16,900.
expected_gain(21000, posterior1, sample_diff2)
16923.59933856512
But can we do any better?
To find out, we can loop through a range of bids and find the one that maximizes expected gain.
bids = posterior1.qs

gains = [expected_gain(bid, posterior1, sample_diff2) for bid in bids]

expected_gain_series = pd.Series(gains, index=bids)
Here are the results.
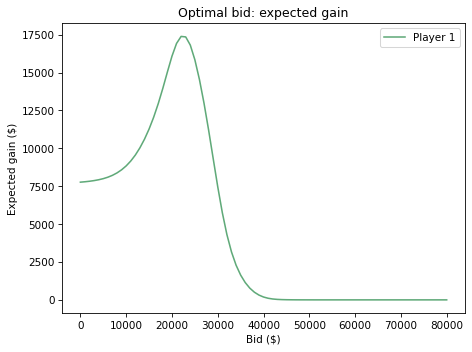
Here is the optimal bid.
expected_gain_series.idxmax()
22000.0
With that bid, the expected gain is about \$17,400.
expected_gain_series.max()
17384.899584430797
Recall that your initial guess was \\(23,000. The bid that maximizes the chance of winning is \\\)21,000. And the bid that maximizes your expected gain is \$22,000.
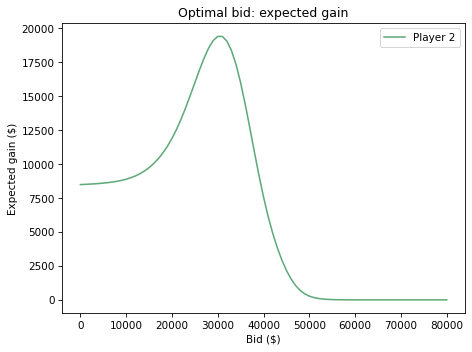
Exercise: Do the same analysis for Player 2.
9.9. Summary#
There’s a lot going on this this chapter, so let’s review the steps:
First we used KDE and data from past shows to estimate prior distributions for the values of the showcases.
Then we used bids from past shows to model the distribution of errors as a normal distribution.
We did a Bayesian update using the distribution of errors to compute the likelihood of the data.
We used the posterior distribution for the value of the showcase to compute the probability of winning for each possible bid, and identified the bid that maximizes the chance of winning.
Finally, we used probability of winning to compute the expected gain for each possible bid, and identified the bid that maximizes expected gain.
Incidentally, this example demonstrates the hazard of using the word “optimal” without specifying what you are optimizing. The bid that maximizes the chance of winning is not generally the same as the bid that maximizes expected gain.
9.10. Discussion#
When people discuss the pros and cons of Bayesian estimation, as contrasted with classical methods sometimes called “frequentist”, they often claim that in many cases Bayesian methods and frequentist methods produce the same results.
In my opinion, this claim is mistaken because Bayesian and frequentist method produce different kinds of results:
The result of frequentist methods is usually a single value that is considered to be the best estimate (by one of several criteria) or an interval that quantifies the precision of the estimate.
The result of Bayesian methods is a posterior distribution that represents all possible outcomes and their probabilities.
Granted, you can use the posterior distribution to choose a “best” estimate or compute an interval. And in that case the result might be the same as the frequentist estimate.
But doing so discards useful information and, in my opinion, eliminates the primary benefit of Bayesian methods: the posterior distribution is more useful than a single estimate, or even an interval.
The example in this chapter demonstrates the point. Using the entire posterior distribution, we can compute the bid that maximizes the probability of winning, or the bid that maximizes expected gain, even if the rules for computing the gain are complicated (and nonlinear).
With a single estimate or an interval, we can’t do that, even if they are “optimal” in some sense. In general, frequentist estimation provides little guidance for decision-making.
If you hear someone say that Bayesian and frequentist methods produce the same results, you can be confident that they don’t understand Bayesian methods.
9.11. Exercises#
Exercise: When I worked in Cambridge, Massachusetts, I usually took the subway to South Station and then a commuter train home to Needham. Because the subway was unpredictable, I left the office early enough that I could wait up to 15 minutes and still catch the commuter train.
When I got to the subway stop, there were usually about 10 people waiting on the platform. If there were fewer than that, I figured I just missed a train, so I expected to wait a little longer than usual. And if there there more than that, I expected another train soon.
But if there were a lot more than 10 passengers waiting, I inferred that something was wrong, and I expected a long wait. In that case, I might leave and take a taxi.
We can use Bayesian decision analysis to quantify the analysis I did intuitively. Given the number of passengers on the platform, how long should we expect to wait? And when should we give up and take a taxi?
My analysis of this problem is in redline.ipynb, which is in the repository for this book. Click here to run this notebook on Colab.
Exercise: This exercise is inspired by a true story. In 2001 I created Green Tea Press to publish my books, starting with Think Python. I ordered 100 copies from a short run printer and made the book available for sale through a distributor.
After the first week, the distributor reported that 12 copies were sold. Based that report, I thought I would run out of copies in about 8 weeks, so I got ready to order more. My printer offered me a discount if I ordered more than 1000 copies, so I went a little crazy and ordered 2000.
A few days later, my mother called to tell me that her copies of the book had arrived. Surprised, I asked how many. She said ten.
It turned out I had sold only two books to non-relatives. And it took a lot longer than I expected to sell 2000 copies.
The details of this story are unique, but the general problem is something almost every retailer has to figure out. Based on past sales, how do you predict future sales? And based on those predictions, how do you decide how much to order and when?
Often the cost of a bad decision is complicated. If you place a lot of small orders rather than one big one, your costs are likely to be higher. If you run out of inventory, you might lose customers. And if you order too much, you have to pay the various costs of holding inventory.
So, let’s solve a version of the problem I faced. It will take some work to set up the problem; the details are in the notebook for this chapter.
Suppose you start selling books online. During the first week you sell 10 copies (and let’s assume that none of the customers are your mother). During the second week you sell 9 copies.
Assuming that the arrival of orders is a Poisson process, we can think of the weekly orders as samples from a Poisson distribution with an unknown rate. We can use orders from past weeks to estimate the parameter of this distribution, generate a predictive distribution for future weeks, and compute the order size that maximized expected profit.
Suppose the cost of printing the book is \$5 per copy,
But if you order 100 or more, it’s \$4.50 per copy.
For every book you sell, you get \$10.
But if you run out of books before the end of 8 weeks, you lose \$50 in future sales for every week you are out of stock.
If you have books left over at the end of 8 weeks, you lose \$2 in inventory costs per extra book.
For example, suppose you get orders for 10 books per week, every week. If you order 60 books,
The total cost is \$300.
You sell all 60 books, so you make \$600.
But the book is out of stock for two weeks, so you lose \$100 in future sales.
In total, your profit is \$200.
If you order 100 books,
The total cost is \$450.
You sell 80 books, so you make \$800.
But you have 20 books left over at the end, so you lose \$40.
In total, your profit is \$310.
Combining these costs with your predictive distribution, how many books should you order to maximize your expected profit?
To get you started, the following functions compute profits and costs according to the specification of the problem:
To test these functions, suppose we get exactly 10 orders per week for eight weeks:
If you print 60 books, your net profit is \$200, as in the example.
If you print 100 books, your net profit is \$310.
Of course, in the context of the problem you don’t know how many books will be ordered in any given week. You don’t even know the average rate of orders. However, given the data and some assumptions about the prior, you can compute the distribution of the rate of orders.
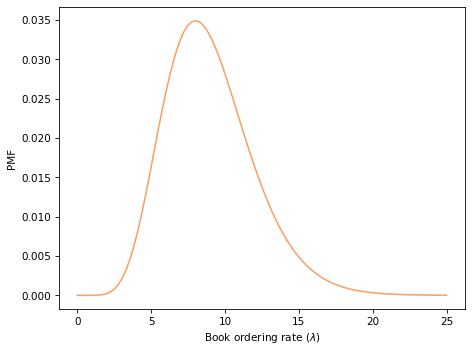
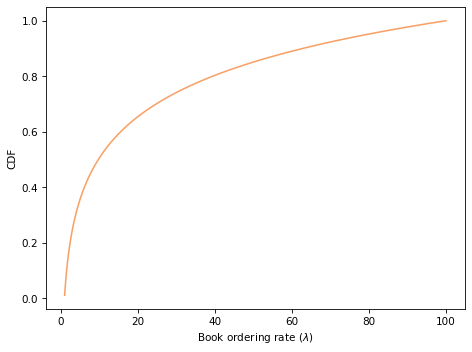
You’ll have a chance to do that, but to demonstrate the decision analysis part of the problem, I’ll start with the arbitrary assumption that order rates come from a gamma distribution with mean 9.
Here’s a Pmf that represents this distribution.
And here’s what it looks like:
Now, we could generate a predictive distribution for the number of books ordered in a given week, but in this example we have to deal with a complicated cost function. In particular, out_of_stock_cost depends on the sequence of orders.
So, rather than generate a predictive distribution, I suggest we run simulations. I’ll demonstrate the steps.
First, from our hypothetical distribution of rates, we can draw a random sample of 1000 values.
For each possible rate, we can generate a sequence of 8 orders.
Each row of this array is a hypothetical sequence of orders based on a different hypothetical order rate.
Now, if you tell me how many books you printed, I can compute your expected profits, averaged over these 1000 possible sequences.
For example, here are the expected profits if you order 70, 80, or 90 books.
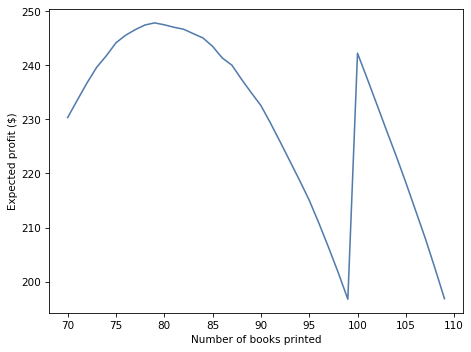
Now, let’s sweep through a range of values and compute expected profits as a function of the number of books you print.
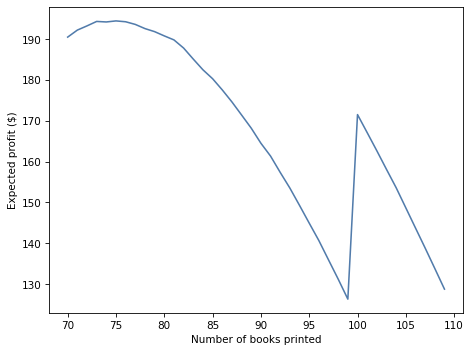
Here is the optimal order and the expected profit.
Now it’s your turn. Choose a prior that you think is reasonable, update it with the data you are given, and then use the posterior distribution to do the analysis I just demonstrated.
Think Bayes, Second Edition
Copyright 2020 Allen B. Downey
License: Attribution-NonCommercial-ShareAlike 4.0 International (CC BY-NC-SA 4.0)