Who Is More Trusting: Liberals or Conservatives?
When I go crawling around in data from the General Social Survey, sooner or later I run into Ryan Burge, who writes Graphs About Religion. In his most recent post, he wrote about changes in interpersonal trust, as measured by this GSS question:
Generally speaking, would you say that most people can be trusted or that you can’t be too careful in dealing with people?
Among other analyses, he looks at how the responses relate to self-identification as liberal, conservative, or moderate. The results are ... complicated. Ryan writes:
Among older Americans who identify as liberal, they are more likely to trust other people. Among Gen Z liberals, it’s exactly the opposite.
To explain why older liberals are more trusting, Ryan suggests:
Liberalism is based on collectivism. It embraces the idea that “together, we can achieve more.” Things like universal healthcare rely on a sense of trust among large groups of people.
But if that’s true, why does the effect go in the opposite direction with Gen Z? Ryan speculates:
Well, maybe liberals feel very slighted by the fact that Donald Trump has been on the ballot for president in every election in which they’ve been eligible to vote, and he’s won twice. Or it could be that they are more impacted by the cynicism of the internet than conservatives? Or maybe it’s because they report higher rates of depression and anxiety than the rest of the ideological spectrum?
As it happened, I looked at the same GSS variable in a recent article. But I didn’t do the breakdown by political ideology, so let’s do that now.
The Story So Far
First, here’s a recap of what we saw in the previous post, with the whole GSS sample. The following figure shows the percentage of respondents who said “most people can be trusted.”
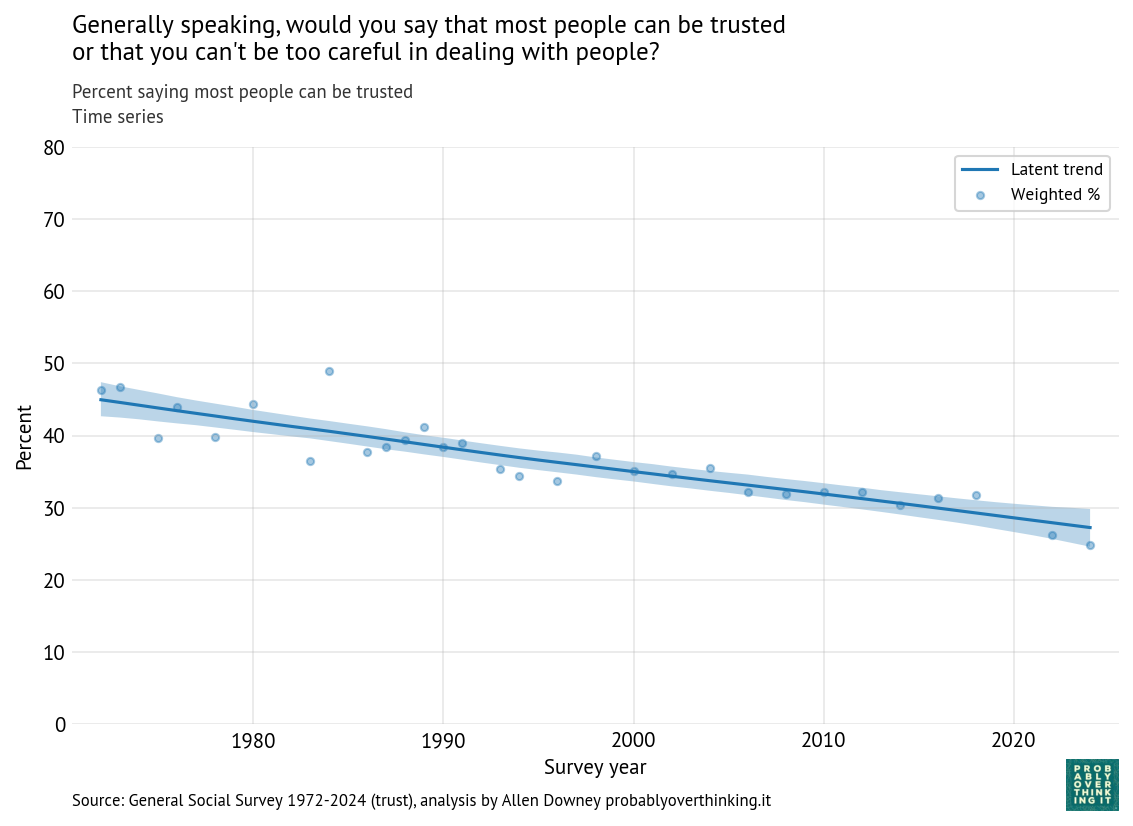
Figure 1:Time series: percent saying most people can be trusted (all respondents)
Interpersonal trust has declined consistently since the survey started in 1972. In the previous post, I decomposed this trend into cohort and period effects. Here’s the estimated cohort effect:
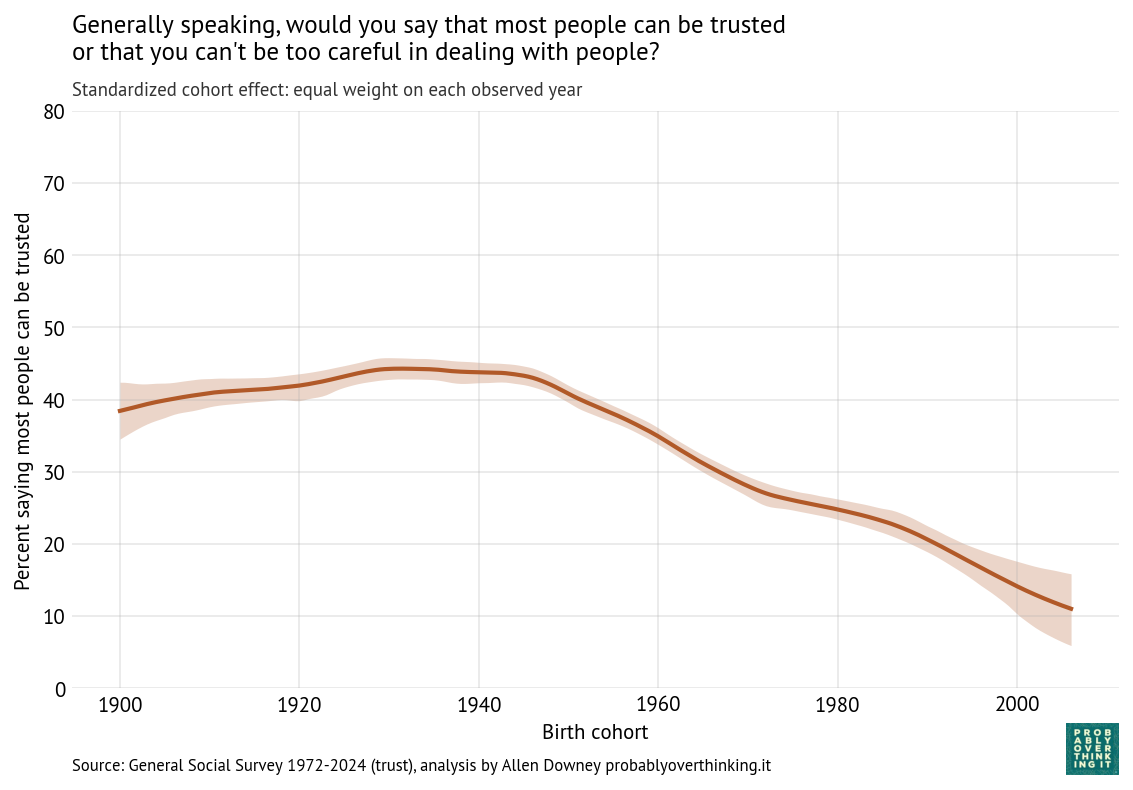
Figure 2:Standardized cohort effect with fixed time mix, percent saying most people can be trusted (all respondents)
The level of trust increased between the cohorts born in the 1900s through the 1940s, and then started a steep decline — more than 30 percentage points over 60 years. And here’s the remaining period effect, after factoring out the cohort effect.
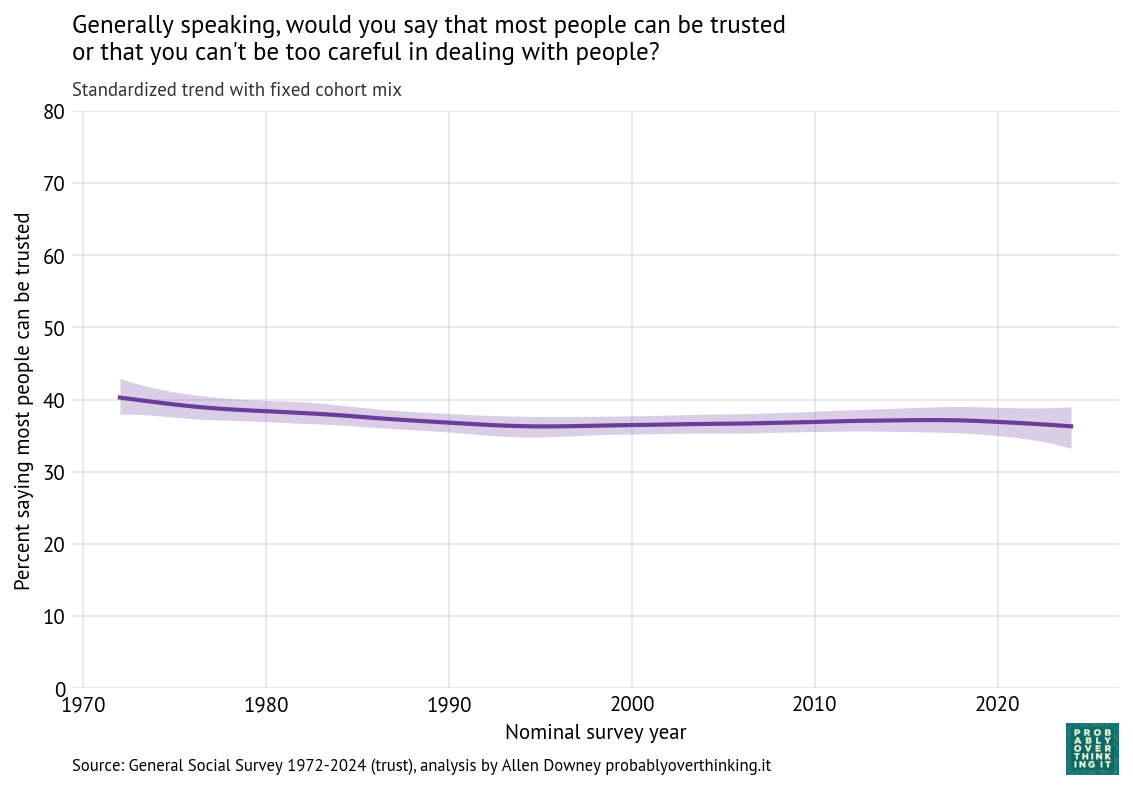
Figure 3:Standardized time trend with fixed cohort mix, percent saying most people can be trusted (all respondents)
There is almost no period effect in the full sample.
Breakdown by Politics
Now let’s get to the question we started with:
Who is more trusting: liberals or conservatives?
Here’s the time series, broken down by ideology.
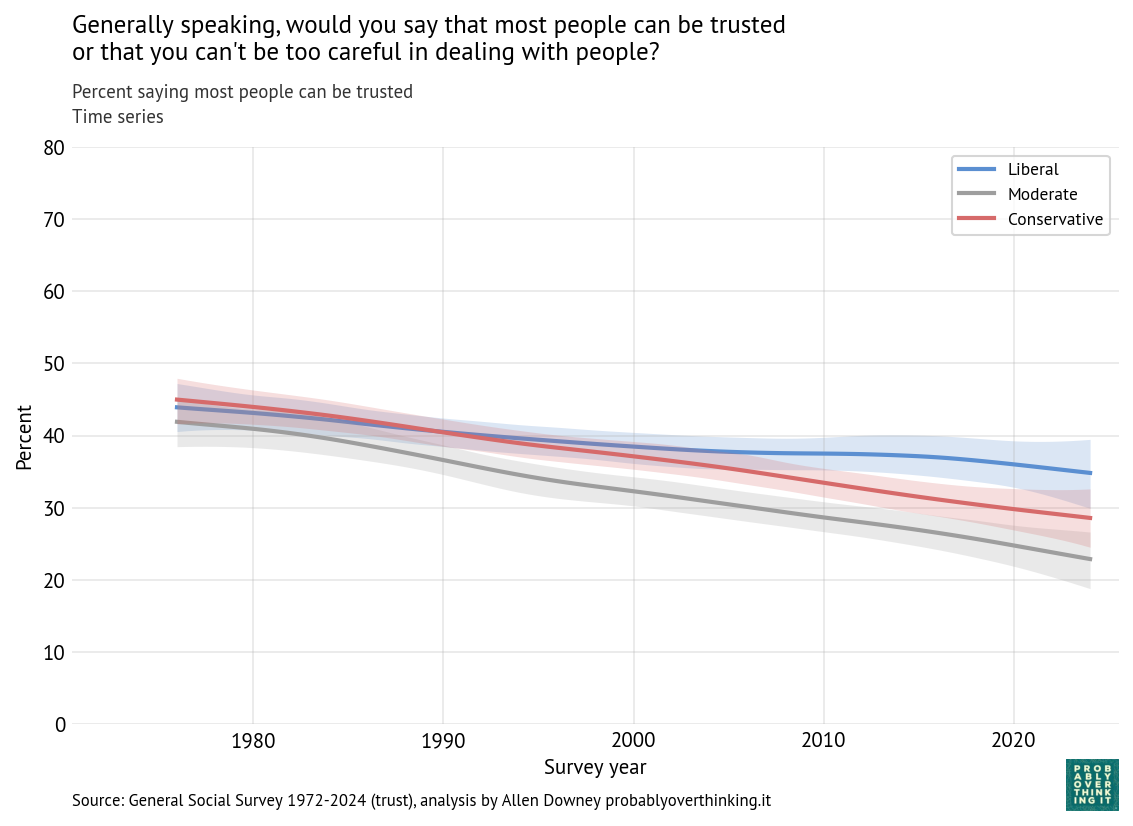
Figure 4:Period-only time model: percent saying most people can be trusted, by 3-point political views
Until recently, there was not much difference: liberals and conservatives were about equally likely to say people can be trusted — both a little more trusting than moderates (who are, maybe, too distrustful to join a team).
Since the 2000s, liberals and conservatives have diverged, and now liberals are more trusting, by about 5 percentage points. But all three groups are still declining.
Now let’s decompose those trends into cohort and period effects. Here are the cohort effects for the three groups.
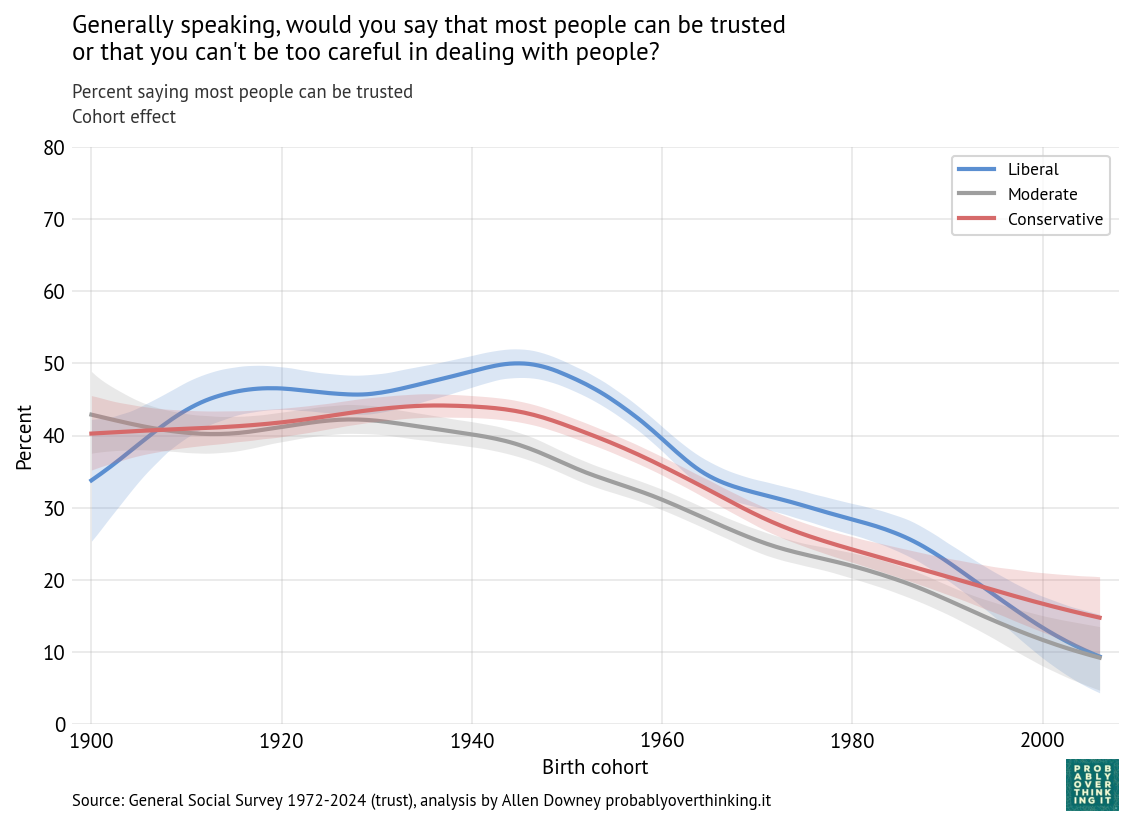
Figure 5:Standardized cohort effect for generalized trust by political views (uniform weights on survey years within group)
Here we can see what Ryan reported: in most generations, liberals are more trusting than conservatives; it’s only in the most recent generation that it goes the other way. The crossover happens among people born in the mid-1990s, close to the conventional beginning of Gen Z (born 1997 to 2012).
And here’s the period effect for the three groups.
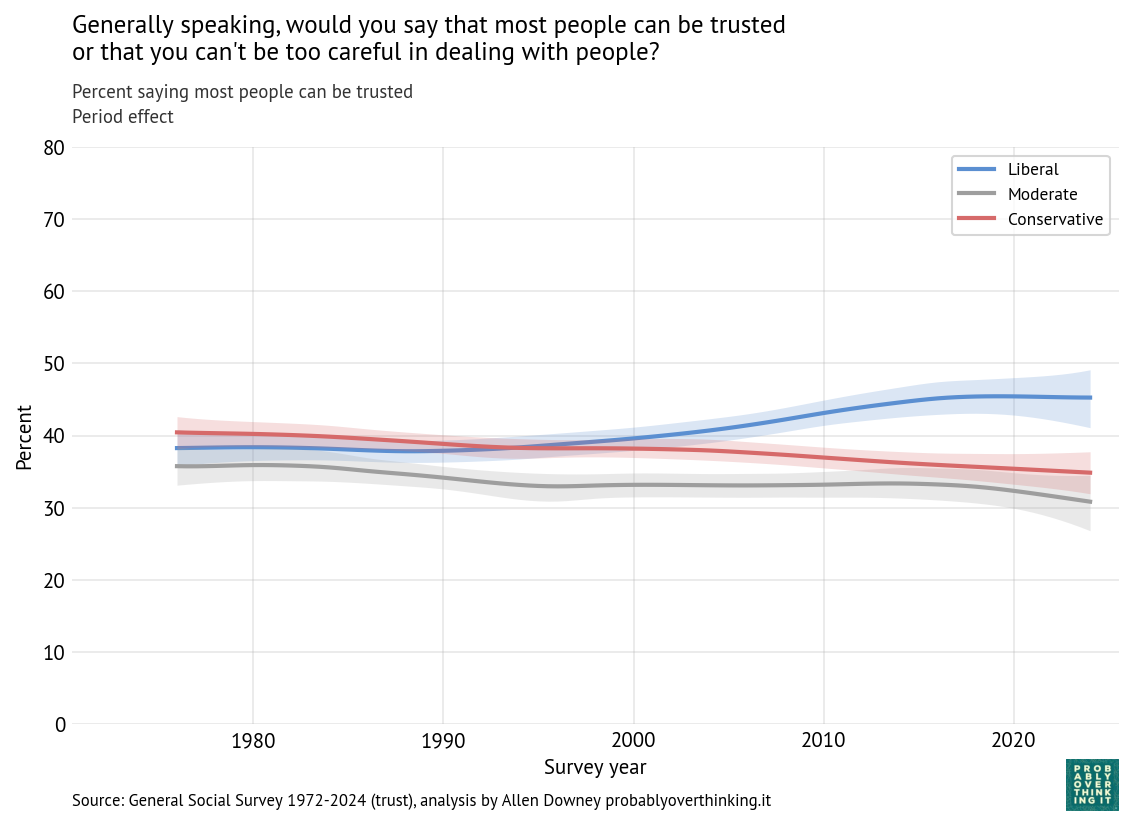
Figure 6:Standardized period trend for generalized trust by political views (fixed within-group cohort weights)
For conservatives and moderates, the period effect is generally downward, although small. For liberals, it’s the other way around, generally increasing since about 2000.
The cohort-period decomposition provides some hints about what’s going on:
Among conservatives and moderates, the cohort and period effects are both downward, so they contributed to a steeper decline over time.
Among liberals, the cohort effect is also downward, but the period effect is upward, so the period effect mitigates the cohort effect.
To explain the cohort effect, I think Ryan’s suggestions are plausible. People born after 1995 have grown up during a discouraging time to be a liberal. Recent developments contrary to the liberal worldview include
The rise of populist and nationalist movements in several countries, along with democratic backsliding or erosion of liberal norms.
Slow progress or reversal on climate change.
Increasing distrust of experts, journalists, scientists, and public institutions.
Declining confidence in institutions such as Congress, the media, and organized religion.
A series of conservative Supreme Court decisions, most notably the overturning of long-established abortion rights protections in 2022.
Negativity bias in the media — especially social media — is probably a contributing factor. And going to school during the pandemic probably didn’t help.
But what about that period effect — can we think of reasons liberals would be more trusting, starting around 2005? If the recent cohort effect among young liberals is driven by the Trump era (at least in part), maybe the period effect was driven by events and trends of the Obama era that were aligned with the liberal worldview:
Perception that the country was becoming more socially inclusive and diverse.
Greater visibility and acceptance of LGBTQ people, and growing support for same-sex marriage, culminating in nationwide legalization in 2015.
Expansion of health insurance coverage through the Patient Protection and Affordable Care Act.
And falling crime rates from the 1990s through the 2010s might have contributed more directly to increasing interpersonal trust.
Of course these explanations are speculative, so let’s get back to what’s supported by the data:
Since the 1970s, interpersonal trust has declined consistently in all three groups (liberal, conservative, and moderate).
Before 2005, liberals and conservatives were about equally trusting; since then, the decline among liberals has slowed, so they are now the most trusting group.
Among conservatives and moderates, the cohort and period effects are both downward, so they contribute to steeper decline.
Among liberals, the cohort effect is steeply downward in the most recent cohorts, but the decline is mitigated by a positive period effect.
But if the cohort effect persists, the decline of trust among liberals might accelerate.