If you could choose any time to be born, when would you choose? That’s the question Barack Obama asked in a 2016 commencement address at Howard University. But he added a twist:
If you had to choose one moment in history in which you could be born, and you didn’t know ahead of time who you were going to be -- what nationality, what gender, what race, whether you’d be rich or poor, gay or straight, what faith you’d be born into -- you wouldn’t choose 100 years ago. You wouldn’t choose the fifties, or the sixties, or the seventies. You’d choose right now. [Emphasis added]
That was a bold thing to say to new college graduates, even in 2016. Many young adults are not happy with the state of the world, and not many of them think things are getting better. I know this because I taught college students for more than 20 years (and I gave my own commencement address to some of them in 2007). I also have two children born in the 2000s; I am aware of the Gen Z experience.
So I read Obama’s address with a skeptical eye. I wondered if he was right in 2016, and if so, whether he would still be right in 2026. And I thought about how to prove or disprove it. The objections are obvious. Taking the categories Obama listed one by one:
If you did not know what nationality you would be, you might be worried about mass deportations and the mistreatment of detainees by Immigration and Customs Enforcement (ICE).
Related to gender, you might think of the Supreme Court decision to overturn Roe v. Wade and the subsequent state laws banning or restricting access to abortion.
Related to race, you might think of the murder of George Floyd by a White police officer and the increasing visibility of White nationalism.
Related to poverty, you might think about increasing inequality in income and wealth, and the increasing prices of food, housing, education, and medical care.
Related to sexual orientation and gender identity, you might think of the 2016 shooting at the Pulse nightclub in Orlando, where 49 people were killed; or public hostility toward trans people.
And related to religion, you might think of Donald Trump’s 2015 call for a “total and complete shutdown of Muslims entering the United States”, and reports of antisemitic incidents after the Hamas attack on Israel and Israel’s attacks on Gaza and Lebanon.
It is not obvious that now is the best time to be an immigrant, woman, or racial minority -- or poor, gay, trans, or non-Christian. But despite all that, I think Obama was right in 2016, and he would still be right in 2026. If you could choose when to be born, you should choose now.
In one way, I am the worst possible person to make this argument. I am not an immigrant, a woman, or a racial minority, and I am not poor, gay or trans. In terms of identity, my only tenuous claim to credibility is that I am not religious.
But in terms of epistemology, I have a stronger qualification: I am a data scientist; that is, I have training and experience using statistics to extract reliable information from data. I wrote several technical books about statistics and data analysis, and a previous book where I presented statistical ideas for a general audience.
I am also inclined to be skeptical. I did not start this book with a settled conclusion, I did not cherry pick data to support my conclusion, and I did not “torture the data until it confessed”[1]. If the results had turned out differently, I would argue that Obama was wrong, and the title of this book would be You Would Not Choose Now -- or possibly The Stupidest Timeline.
To make my case, I’ll present two lines of evidence. The first is from several long-running surveys of adults in the United States, which include questions about race, gender, religion, and related topics. With these datasets, we can track how public opinion has changed over the last fifty or sixty years. We’ll see that people now are less racist, sexist, homophobic, xenophobic, and nationalist than they were in the past, at least as far back as we have data.
The second line of evidence is a history of civil rights, with a dose of civics (checks and balances!), a bit of constitutional law, and a sprinkle of personal anecdotes. Some progress in civil rights is more recent than you might think. If you were born 100 years ago, or in the fifties, sixties, or seventies, you might be surprised at the rights you did not have.
I think this history is interesting in part because it’s messy. It’s a cliché that laws are like sausages -- it’s better not to see them being made. That is certainly true of constitutional law and the foundations of civil rights. The more closely you look at Supreme Court decisions, the more fragile it all seems.
The history is also interesting for me because I didn’t learn much of it in school. In part, that’s because I went to school a while ago -- some of this history wasn’t history yet. But even taking that into account, in my American History class, we didn’t get very far into the 20th Century. We spent six weeks on the Stamp Act of 1765 and twenty minutes on the Vietnam War[2]. If your class was like that, I hope you’ll enjoy filling in some of the gaps.
The premise of Obama’s challenge is a variation of the Veil of Ignorance, a famous thought experiment associated with moral philosopher John Rawls. His goal was to derive a principle of justice -- he asked, if you did not know who you would be, what rules of society would you choose? Obama’s challenge is different -- it’s about history, not justice -- but it leads to a similar conclusion. You might choose to be born in ancient Rome if you knew you would be an Emperor, or in Victorian England if you knew you would be an aristocrat. But if you did not know who you would be, you might choose right now.
Generational replacement and changing minds
If you like graphs, I think you will like this book. If you don’t like graphs, I hope you’ll like it anyway, but I have to warn you: there are a lot of them.
There are only a few different kinds of graphs; once you are familiar with them, they will be easier to read and interpret. Toward that end, we’ll start with an example that demonstrates the analysis and visualization I’ll use throughout the book.
The example is based on data from the General Social Survey (GSS). Since the early 1970s, the GSS has included this question:
Do you think most people would try to take advantage of you if they got a chance, or would they try to be fair?
The people who took the survey could choose “would take advantage of you”, “would try to be fair”, or “it depends”. A few people did not answer, and a few said they don’t know or couldn’t choose. Leaving them out, the following figure shows the percentage who said people would try to be fair.
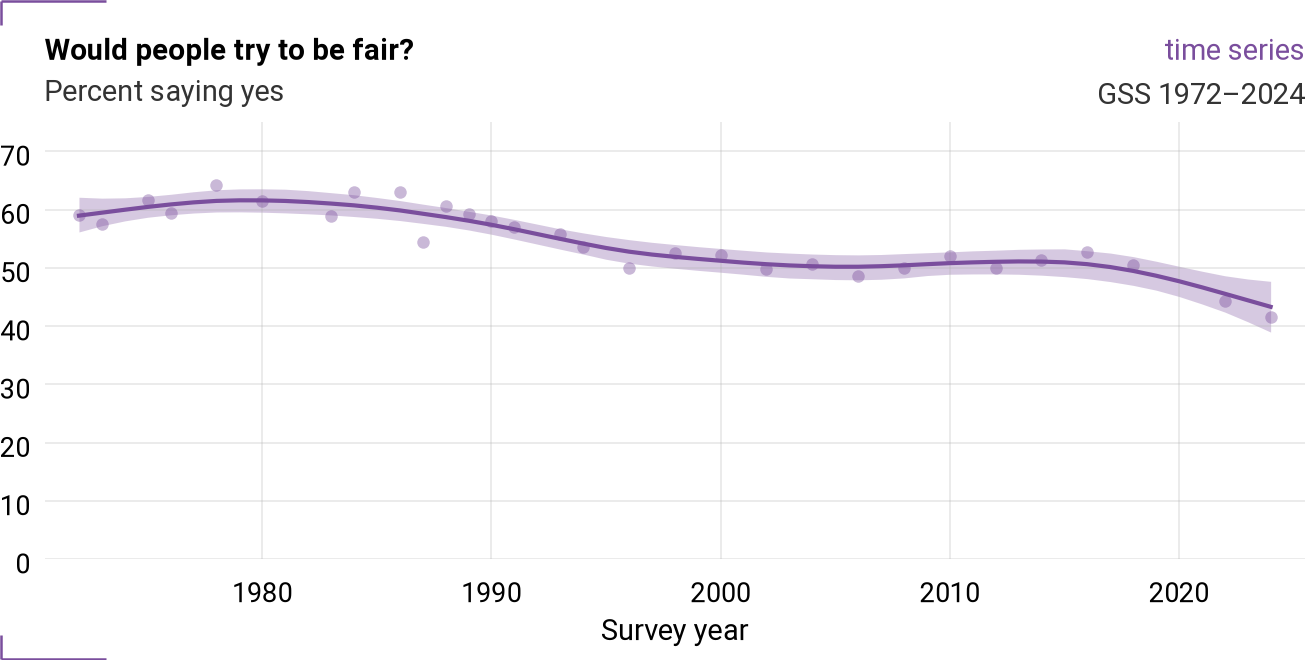
Figure 1:Time series, percent saying people would try to be fair.
The dots show the estimated percentage during each iteration of the survey. The GSS does not follow the same people over time; they recruit a different group of respondents during each iteration. That makes it possible to adjust the membership of the group over time to reflect demographic changes -- for example, compared to 1970, there are more old people in the United States now, and the proportions of racial and ethnic groups have changed.
The dots vary from year to year partly because of random sampling. In any iteration of the survey, the people chosen to participate might have a more positive worldview than average, or a more negative worldview, just by chance. But the GSS includes more than 1000 people in every iteration and more than 2000 in recent iterations. So the variability due to chance is small.
A likely explanation for the larger variations is that people answer questions like this differently from year to year based on what’s happening in the world, what they are hearing about in the media, and what people are talking about.
The solid line and the shaded area are the results of a statistical model based on that assumption -- specifically, that the percentage we see during each iteration is a combination of a smooth trend and unpredictable variation. The solid line shows an estimate of the smooth trend, and the shaded area shows the uncertainty of the estimate.
With that explanation out of the way, let’s interpret the results. In 1972, about 59% of the respondents said people would try to be fair. By 2024, that share had fallen to about 42%. So people are more cynical now, at least by this measure.
Changing minds and generational replacement
When public opinion changes, there are two kinds of explanation to consider:
Changing minds: People adopt different views over the course of their lives, possibly in response to events.
Generational replacement: As older people die or age out of the survey, they are replaced by young adults with different views.
With a repeated survey like the GSS, we can follow each generation to see how it changes over time. The following figure shows one line for each birth cohort -- that is, people born in the same year.
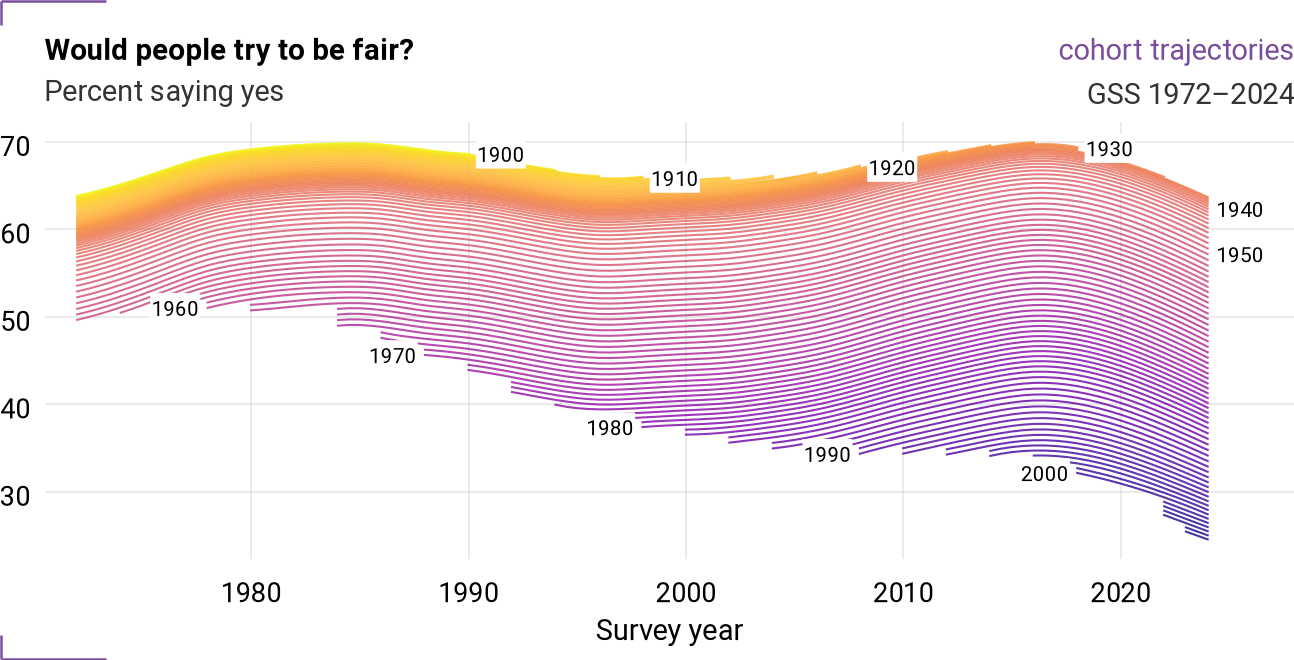
Figure 2:Cohort trajectories, percent saying people would try to be fair, one line per birth year.
The labels on the lines indicate year of birth. For example, in the upper left, we can see that people born around 1900 were likely to say people try to be fair; the percentage increases from about 65% to near 70% in the early 1980s. In the lower right, people born around 2000 are much less likely to say so; the percentage drops below 30% in the most recent surveys. So there are big differences between generations.
Following the cohorts over time, many of the lines slope upward, which means that within each birth cohort, people are less cynical over time, on average. However, it looks like this trend has reversed recently -- the lines slope downward after 2015 or so.
These results come from a statistical model that makes several simplifying assumptions. Like the previous model, it assumes that changes over time come from a combination of a slowly varying underlying tendency and irregular variation from year to year. In addition, it assumes that each cohort has an underlying tendency that differs gradually from one birth year to the next.
These assumptions impose restrictions on the results. For example, in this model, it is not possible for cohort lines to cross. That’s not completely realistic -- in the real world, an event could have a larger effect on one cohort than another, which could cause their lines to cross.
But imposing this restriction has a benefit -- with this model, we can make separate estimates for the contributions of generational replacement and changing minds. In statistical terms, these are the “cohort component” and the “period component”. The cohort component is the estimated tendency of each generation to give a particular response. The following figure shows the cohort component of the tendency to say that people are fair:
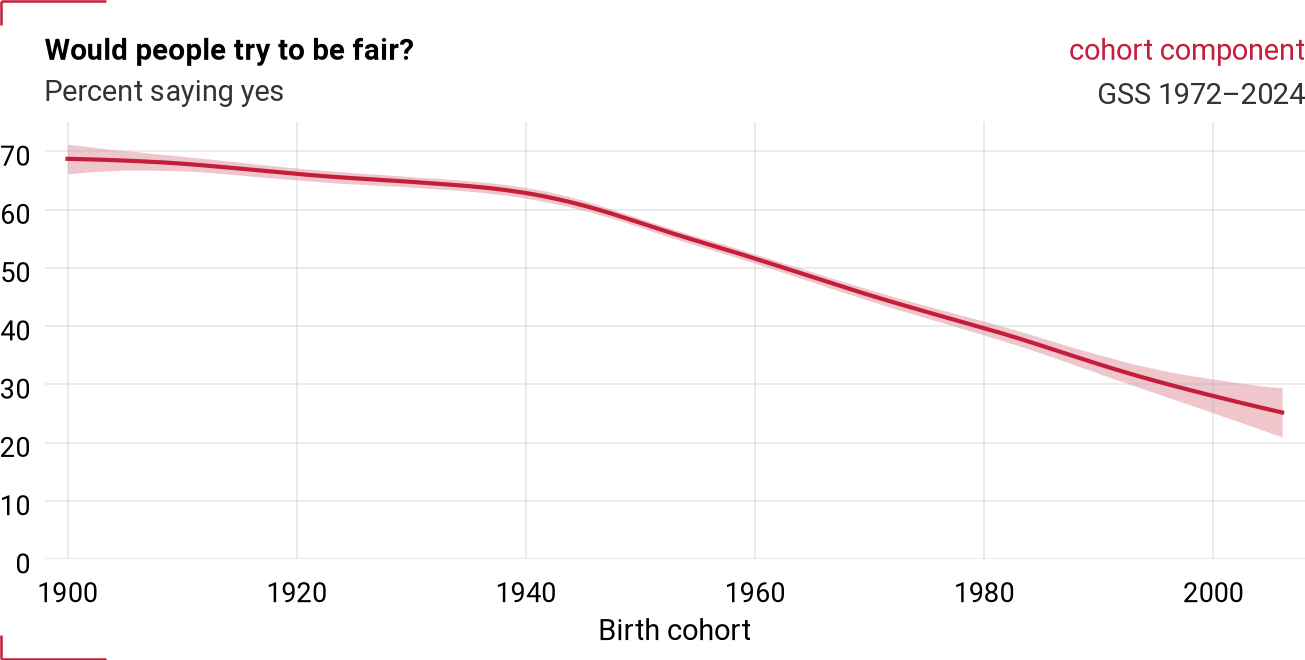
Figure 3:Cohort component: percent saying people would try to be fair.
The cohort component declines slowly among people born between 1900 and 1940 -- then it drops off more steeply, all the way to the most recent cohort. The total decline is more than 40 percentage points, which is precipitous.
The period component is the estimated tendency to give a particular response at each point in time. The following figure shows the period component for the fairness question.
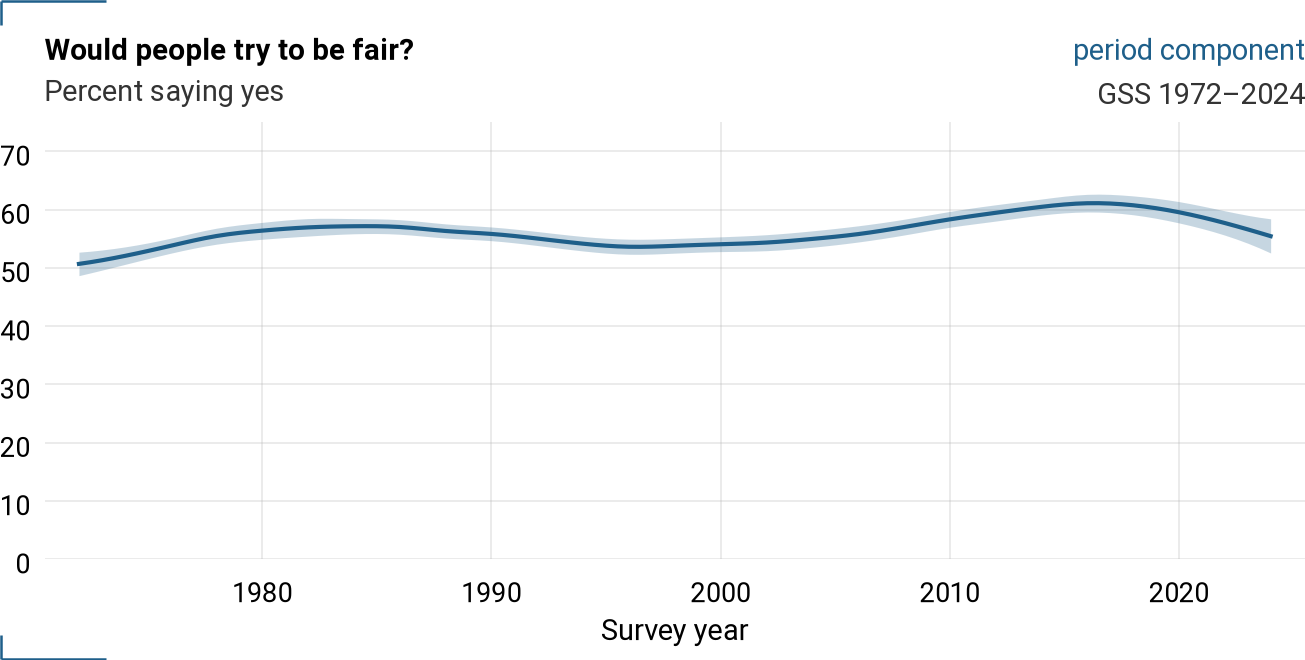
Figure 4:Period component: percent saying people would try to be fair.
The overall trend is upward, although there was a decline between 1985 and 1995 and another decline since 2015.
To explain changes in the period component, we should think about trends and events that affected all groups at the same time. In this example, a possible explanation for the drop between 1985 and 1995 is the rise of violent crime, which peaked around 1991. The recovery after 1995 coincides with a long decline in most crime rates. For the drop after 2015, possible explanations include increasing political polarization, divisive social media, and the isolating effects of the COVID-19 pandemic.
To explain a cohort effect, in general, we should think about differences in upbringing between generations. One difference is in the media environment they were exposed to. People born in the 1900s grew up with newspapers and radio, people born in the 1940s were the first to grow up with television, and people born in the 1980s were the first to grow up with the internet.
Successive generations also used different communication technologies -- which increased the number of people they encountered who would “take advantage”. In the 1970s, a telemarketer might call your house, but long distance phone calls were expensive, so if someone in Nigeria was pretending to be a prince, you were not likely to hear from them. The internet, which makes international communication almost free, has the unfortunate effect of exposing the most vulnerable people directly to the most unscrupulous, anywhere in the world. To judge whether people are fair, you only have to open your spam folder to see how many people try to take advantage of you every day.
Widespread changes like these might appear in the cohort component, if their effect is primarily through differences in upbringing, or in the period component, if their effect is through experiences later in life.
In this example, the results suggest that the cohort component dominates: each generation is more cynical than the previous one when we first survey them as young adults; then, over the course of their lives, they become a little more trusting, on average. We will see other examples where the period effect dominates, some where they reinforce each other, and a few where they cancel each other out.
Talking 'bout my generation
In discussing generational changes, I will sometimes use conventional names for recent generations -- like Baby Boomer, Millennial, and Gen Z -- but I will not use these categories for statistical analysis.
One problem is that these generation names cover about 15 years each, so they can obscure differences between the oldest and youngest members. Barack Obama, born in 1961, is one of the youngest Baby Boomers; Donald Trump, born in 1946, is one of the oldest. They don’t have much in common.
Another problem is that generational language sometimes elicits generational antagonism. For example, “Millennial” was overused as a term of deprecation for so long, it covered half of Gen Z -- and then young people retaliated with the dismissive catchphrase “OK, Boomer”. Decades of birth don’t trigger identity issues in the same way, with the possible exception of “90s kids”.
Nevertheless, so you understand where I am coming from, I was born in 1967, which makes me Gen X (1965-1980). When I started teaching at Olin College, in 2003, my students were Millennials (1981-1996). My children, born in the early 2000s, are Gen Z (1997-2012). My brother was born in 1963, which technically makes him a Baby Boomer (1946-1964). As much as I enjoy reminding him about that, the lines between social generations are not sharp, and people who fall between two sometimes feel like they belong to neither.
My parents were born in the 1930s; they belong to the Silent Generation (1928-1945), so-named because they were supposedly conformist and traditional. But the Silent Generation was also central in the civil rights movement and the birth of rock and roll -- which is a reminder that not everyone born in an 18-year period has the same personality traits.
My grandparents were born in the 1910s, so they belonged to the Greatest Generation (1901-1927). That name came from a speech by General James Van Fleet, born in 1892; it was popularized by journalist Tom Brokaw, born in 1940 -- so at least it’s not a name the “Greatest” gave themselves. Even so, you can see how these nicknames might inspire inter-generational resentment.
Kids these days
When people talk about generations, the focus of attention is usually the current generation of children and young adults. And when older people assess the condition of “kids these days”, the conclusions are not often positive.
That is not the conclusion of this book. On the contrary, one of the most consistent patterns in the data we will see is that the young adults in the most recent surveys are less racist than previous generations, and less sexist, homophobic, and xenophobic. They are more fair-minded, empathetic, and tolerant. Honestly, I think they are better people.
However, as we saw in the previous analysis, they are less trusting than previous generations -- and there is a similar pattern in questions about interpersonal trust and trust in institutions. People born in the 2000s are also less happy than previous generations, as reflected in their responses to survey questions and corroborated by tangible measures of despair.
In fact, trust and happiness have been declining for decades. Social scientists have theories about the reasons, and I will discuss some of them, but at this point there is no clear consensus.
No one likes good news
On long time scales, most things are getting better. For example, in the last 100 years, life expectancy has increased in every region of the world, mostly due to large decreases in death rates for mothers, babies, and children, but also due to improvements in medicine (especially vaccination), public health (especially sanitation) and safety (including workplace and transportation safety), decreases in violence (both homicides and wars), and better lifestyles (less smoking and drinking). Deaths due to natural disasters have decreased too, mostly because of better infrastructure and emergency services.
People’s circumstances have improved, too. The number of people living in poverty has decreased dramatically, food security and nutrition have improved, and levels of education have increased and expanded to reach more people, especially girls and women. The quality of the environment has improved: more people have clean air and water, and fewer are exposed to toxins, especially lead and the byproducts of fossil fuels. And the reach of technology has expanded: more people have electricity, refrigeration, heat and cooling in their homes, and access to telephones and the internet.
But many people are unaware of these measures of progress, in part because bad news often comes in the form of highly visible catastrophes, and good news tends to be slow and harder to detect. For example, when a natural disaster affects a large number of people, it is often reported in international news. But when a country gradually improves the quality of housing to protect people from fires and earthquakes, that’s not newsworthy.
I am aware of slow positive trends because I follow people like Hans Rosling, who talked about them in videos, articles, and a 2018 book called Factfulness: Ten Reasons We’re Wrong About the World -- and Why Things Are Better Than You Think. I also follow organizations like Our World in Data, which provides “research and data to make progress against the world’s largest problems”. I have done research on some of these topics, most recently on the shrinking difference in life expectancy between men and women. I write about positive trends on my blog, and I have given talks about them.
Here’s what I have found when I report good news: People get angry. They do not believe it. They do not like it. And they do not like me or the horse I rode in on.
A few years ago I gave a talk at a technology conference in Seattle and I mentioned some of these positive trends. They made up less than 20% of the talk, but they elicited the majority of the questions I got at the end. One person suggested I was “stuck in a trough of toxic positivity”. Another said they think I’m “gaslighting younger generations who face real challenges”. Another asked how my outlook is shaped by my identity “as a white male and the privilege that [I] get from that” -- a reminder that I am on thin ice when I talk about these topics.
I understand these reactions. The belief that things are getting better is a minority view. In 2016, around the time of Obama’s address, Pew Research ran a survey that included this question:
In general, would you say life in America today is better, worse, or about the same as it was fifty years ago for people like you?
Only 36% said things were better and about 43% said worse (the rest said “about the same” or declined to answer). When they asked the same question in 2023, the responses were even more pessimistic: only 23% said better, and 58% said worse. In other words, a majority of Americans think that things were better in the 1970s than in the 2020s.
I understand why, when I say things are getting better, it can sound like I am dismissing people’s real, justified concerns. It can have the same effect as telling someone who is rightfully angry to “calm down”. I know better than to do that.
Progress is not guaranteed
So when I say things are getting better, I have learned to acknowledge -- in the same breath -- that we still have real problems. For example, in the 1970s about 50% of Americans thought “most men are better suited for politics than are most women”. Now fewer than 20% agree. A pessimist might look at this trend and say, “There’s still a lot of sexism in this country -- we have not come far enough, and change is too slow”. An optimist[3] might look at the same data and say
We have made progress,
We still have work to do,
Past progress didn’t happen automatically -- it happened because people worked to make it happen,
Future progress will not happen automatically -- but we have reason to believe it can.
I think it’s important to know about past progress, because it gives us hope and energy to work for change. And it’s important to know how it happened, because that understanding informs beliefs about what will work in the future.
President Obama might also know how people react to good news, because as soon as he said “You would choose right now”, he followed with this:
I tell you all this because it’s important to note progress. Because to deny how far we’ve come would do a disservice to the cause of justice, to the legions of foot soldiers; to not only the incredibly accomplished individuals who have already been mentioned, but your mothers and your dads, and grandparents and great grandparents, who marched and toiled and suffered and overcame to make this day possible.
I tell you this not to lull you into complacency, but to spur you into action -- because there’s still so much more work to do, so many more miles to travel. And America needs you to gladly, happily take up that work. You all have some work to do.
I hope that the evidence in this book will help you note the progress we have made, and I hope it will spur you to action. We all have some work to do.
Neutral-ish
Mostly, I will maintain a neutral point of view: the lines go up, the lines go down; I will describe the trends and speculate about the reasons -- you can decide whether you like the direction things are going. But for some questions, you might be able to discern my opinions.
For example, in Chapter 2, we’ll see that the percentage of Americans who think homosexual conduct is wrong has dropped from about 75% in 1990 to less than 40% in 2024. In my opinion, there’s nothing wrong with homosexuality, so I think this is a positive trend. But I acknowledge that 40% of Americans disagree, and I want this book to be interesting and useful for them, too.
As another example, in Chapter 3, we’ll see that approval of interracial marriage increased from 4% in 1958 to 94% in 2021. This trend is evidence of declining racism and I think it is unambiguously good. But other questions about race are more complex; for example, on affirmative action, I think reasonable people could disagree, so I maintain a more neutral tone when I present those results.
In Chapter 4, about gender, I write from the perspective that gender equality is good and opposition to it is morally wrong. But if people prefer traditional gender roles for themselves, they are entitled to their preferences.
In Chapter 5, I take the position that the First Amendment of the Constitution guarantees freedom of religion, and animosity between people of different faiths is bad. So when we see that prejudice against religious minorities has declined, I consider that to be a good thing.
Similarly in Chapter 6, about nationality, I take the view that everyone in the jurisdiction of the United States is entitled to the equal protection of the law. But I don’t think I’m out on a limb -- that’s literally the 14th Amendment. I also think immigrants and refugees should enjoy the protection of United States law and international obligations. Again, this should not be controversial -- I’m just saying we should follow our own laws. But I acknowledge that immigration is complicated, and again, reasonable people disagree.
Chapter 7 is about poverty; there I take the view that capitalism is generally a good thing that has helped create value and wealth over the last few centuries. That wealth has not been shared equally, to be sure, but it has led to improvements in the quality of life for everyone, including the poorest.
In Chapter 8 we’ll see that religious participation has declined over the last 50 years. I will not cheer or lament this trend. Churches provide social connection and spiritual fulfillment for a lot of people; the decline of those things is a loss. But I support the separation of church and state, so if people have less inclination now to impose religious beliefs on others, that is a gain.
Finally, in Chapter 9 we will look at changes in attitudes about personal autonomy, including sex, abortion, and the end of life. I generally think more autonomy is better. For example, we will see that people are more accepting of pre-marital sex than they used to be. I think that’s good. But, of course, some exercises of autonomy cause real harm. As evidence that people recognize this limit, we will see that acceptance of extra-marital sex -- that is, having an affair -- is low and almost unchanged in fifty years. I think that’s good, too.
With that, my cards are on the table, and you got a sneaky outline of the book, too. You don’t have to agree with about all of that -- it would be surprising if you did. But I hope you will find this book valuable even if your opinions are not identical to mine.
But what about the Trump era?
When Barack Obama said you would choose now, “now” was May 2016. About six months later, Donald Trump was elected president, and since then a lot has happened. Even if we decide Obama was right in 2016, we might not think so if “now” means now.
The last 10 years have been a challenge to the belief that things are getting better. Based on events and public discourse, it might seem like we’ve seen a resurgence of racism, sexism, xenophobia, homophobia, and transphobia -- as well as White supremacy and Christian nationalism.
But it is hard to know whether these ideas have become more widespread or just more visible. We will see that there is evidence of both. In some long-term trends there are signs of recent reversals, but often the statistics are ambiguous. And even when the evidence is clear, the size of the reversals is modest.
Over the last 10 years, there have been repeated reports that young men are much more conservative than young women. I have done research on these claims, in collaboration with the American Institute for Boys and Men. In general, we found that the political differences between young men and women have been overstated. And the issue is not that young men have lurched to the right; in their political views, they are about as liberal as expected based on long-term trends. To the degree that gender gaps have widened, most of the increase is because young women are somewhat more liberal than expected. We’ll see examples of these trends in Chapter 4.
What about the climate crisis?
If you are worried about the climate crisis, you might not be comforted when I say that people are somewhat less sexist than they used to be. That’s great, you might think, but not much good if we are all dead.
In my opinion, we have not done enough to address climate change, and as a result we are going to have serious, global problems over the next several decades -- many of which could have been avoided if we had done more, sooner.
Nevertheless, based on our best current understanding, there are still paths to a stable, habitable planet and a good quality of life for everyone on it. We are not doomed.
This book will not lay out that argument, but I can recommend other books that do. One is Not the End of the World: How We Can Be the First Generation to Build a Sustainable Planet, by Hannah Ritchie, a researcher at Our World in Data, which I mentioned earlier. Ritchie has another book, called Clearing the Air: A Hopeful Guide to Solving Climate Change in 50 Questions and Answers, that I also recommend. The titles tell you what they are about. I’ll also refer you to Project Drawdown, an independent research organization that provides “science-based climate solutions and strategies”, including a curated list of solutions with the greatest potential for positive impact.
These resources provide good reasons for cautious optimism: we have problems and there’s work we need to do to solve them, but it is not impossible.
Is this just about the United States?
Yes, we will focus almost entirely on the United States. I think that’s the context Obama had in mind when he posed his challenge. But many of the trends we’ll see in this book are also happening in other countries, and there are long-running surveys with similar questions in other parts of the world, including the European Social Survey, Afrobarometer, Latinobarómetro, Asian Barometer, and Arab Barometer. The World Values Survey has even broader coverage, with surveys in more than 100 countries since 1981. I hope someone will run an analysis like mine in other countries.
Was this book written by artificial intelligence?
No, I wrote it. I used AI tools to help, but I followed a personal policy on acceptable use. For example, I often use ChatGPT for brainstorming, but I always start with my own ideas and make my own choices about which ideas to pursue. I use ChatGPT and Claude for research, but I always check the sources, and I take responsibility for any errors. I used Cursor to generate a lot of the code to analyze data and visualize the results. But I used the processes of data science and software engineering to review the code and cross-validate the results. And I used Cursor for proofreading and help with typesetting.
If there are no further questions, let’s get started.